Dynasty GAAP Memo: Quarterbacks And The Indirect Cash Flow

If you have read my work before, you know I write in the form of “accounting memos” and apply accounting and finance themes to dynasty fantasy football. For anyone who has not been exposed, the format is very standard. Each memo will start with the “purpose.” Next, it will supply background and then outline the applicable “guidance,” or accounting literature utilized. Last will be the analysis and conclusion. The goal is to state the issue and quickly address it. My write-ups will follow this same logic. To summarize, welcome to “Good at Analyzing Players” or “GAAP”, a play on “Generally Accepted Accounting Principles” (and yes, my wife did come up with it).
Purpose:
The purpose of this memo is to evaluate dynasty quarterbacks utilizing the ‘indirect cash flow method’.
Background:
As I continue to explore dynasty and try new leagues, scoring systems, and formats, the one requirement that I find myself needing to join a league is that it needs to be superflex. With that, the importance of evaluating quarterbacks in dynasty skyrockets, and the elite players at the position are untouchable. With that, I realized I had never written about quarterbacks directly in my memos. I usually focus on the skill positions and discuss the QB indirectly.
Ironically, this memo will explore QB values by utilizing the ‘indirect method’. To introduce the ‘indirect method’, I first need to discuss the cash flow statement. A cash flow statement tracks the inflow and outflow of cash, providing insights into a company’s financial health and operational efficiency. To apply this to dynasty, the cash flow statement for your roster is the amount of cash (or fantasy points) created.
In accounting, there are two methods to prepare a cash flow statement. These are defined below:
- Direct Method: The cash flow direct method determines changes in cash receipts and payments, which are reported in the cash flow from the operations section. When evaluating a dynasty asset’s direct cash flow, this would mean looking at the specific player’s points scored or points-per-game.
- Indirect Method: The indirect method takes the net income generated in a period and adds or subtracts changes in the asset and liability accounts to determine the implied cash flow. In dynasty and quarterbacks, this is looking at a player’s skill position players and other attributes to derive a player’s cash flow or dynasty value.
A lot of dynasty owners probably use the direct method. If we apply this, we know Josh Allen is great because he has finished as a top two QB the last four seasons and, based upon this, would expect more elite finishes in scoring. Suppose we apply the indirect method and evaluate the players around Allen in 2024. In that case, this might be a different story as Allen lost his WR1 in Stefon Diggs this offseason and will be more reliant on unproven assets like Dalton Kincaid and rookie Keon Coleman. Not to say that Allen is not still an elite QB, but his profile becomes slightly less cemented.
In order to calculate each QB’s indirect cash flow, this memo will explore the attached skill position players to each QB to identify if there is potential for value overstatements or understatements. This includes evaluating the team’s wide receivers, tight ends, receiving running backs, and rushing ability.
Resources:
- Sleeper: Great interface for looking up historical statistics
- DLF Dynasty Rankings: Best Dynasty Rankings in the Industry
- DLF Average Draft Position (“ADP”) Data: Best resource to gauge current player value. Based upon real Dynasty Startups.
Analysis:
To begin this analysis, I need to define how the indirect cash flow for each player was calculated. The premise is that these players, their scoring, and other adjustments can indirectly change a QB’s output and increase the ceiling for that QB from week to week. A great example of this is Brock Purdy who has an elite supporting cast of Christian McCaffrey, Deebo Samuel, Brandon Aiyuk, George Kittle, and rookie Ricky Pearsall at his disposal.
Below I have laid out each metric (or score) with an example.
WR Score:
This input takes the top 48 receivers from the 2023 season based on average PPR scoring. Then applies the scoring below:
- WR1 Finish (top 12) = 4 Points
- WR2 Finish (12 to 24) = 3 Points
- WR3 Finish (25 to 36) = 2 Points
- WR4 Finish (37 to 48) = 1 Point
I then also adjusted for rookie WRs based on draft capital (with a little judgment). For this, Marvin Harrison Jr., Malik Nabers, and Rome Odunze got 3 points and the remaining first and second round WRs got 2 points.
The best example of a high WR score is the Houston Texans which have a WR score of 11. This consists of 4 points for Nico Collins (WR1 PPG Avg), 3 for Stefon Diggs (WR2 PPG Avg), 3 points for Tank Dell (WR2 PPG Avg), and 1 point for Noah Brown (WR4 PPG Avg).
TE Score:
Similar to the WR score, this considers the top 24 tight ends from the 2023 season based on average PPR scoring. However, the average points scored for a TE1 vs. a WR1 was 12.3 PPG compared to 19.0, respectively. Based upon this, I discounted the TE points accordingly:
- TE1 Finish (top 12) = 2 Points
- TE2 Finish (12 to 24) = 1 Points
I then also adjusted for rookie WRs based on draft capital. For this, Brock Bowser got 2 points and Ben Sinnott got 1 as they were the only tight ends drafted in the first two rounds.
For this metric, the Kansas City Chiefs go 2 points as Travis Kelce finished as a TE1 in 2023 on a point-per-game basis.
Rushing Adjustment:
In fantasy, rushing yards for QB create a high floor and increase a player’s ceiling. To evaluate this, I looked at 2023 rushing yards and derived the scoring below:
- Greater than 800 rushing yards = 5 points
- Greater than 500 rushing yards = 4 Points
- Greater than 300 rushing yards = 3 points
- Greater than 200 rushing yards = 2 points
On this, I made a few judgmental injury adjustments as well as rookie adjustments. Due to injuries, I assigned Anthony Richardson and Kyler Murry 4 points and Daniel Jones 2 points. Additionally, based on college rushing production, I assigned the following points to rookies: Jayden Daniels (4 points), Caleb Williams (2 points), Drake Maye (2 points), Bo Nix (0 Points), and JJ McCarthy (0 points).
RB Receiving Adjustment:
Elite pass catching RBs can turn a check down into a long gain. Based on this, I thought it was relevant to include these specialized backs. Similar to TE above, these metrics were highly discounted from the WR, and the below were utilized:
- Greater than 500 receiving yards = 2 points
- Greater than 400 receiving yards = 1 point
As part of this, I did adjust Jahmyr Gibbs, who profiles as an elite pass-catching back to one point, even though he only had 316 receiving yards in 2023. No rookies were adjusted at this time.
Results:
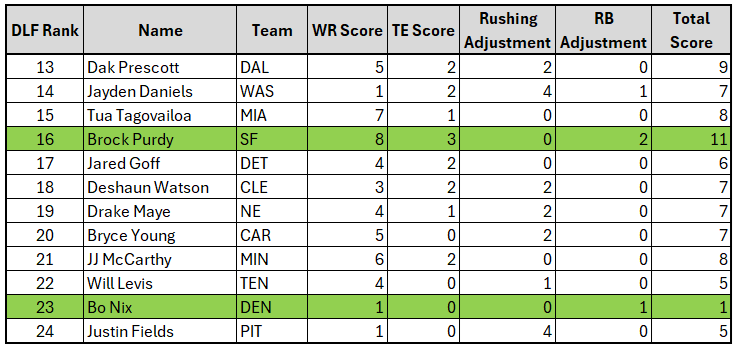
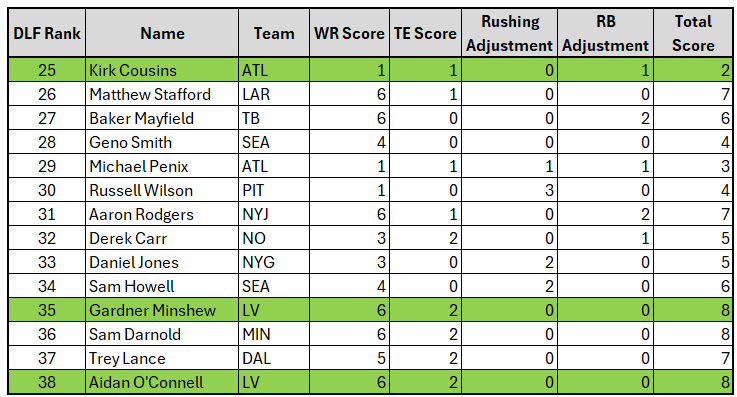
Below I have aggregated each player’s metrics and summarized based upon tiers based from DLF Dynasty QB Rankings to calculate their indirect cash flow. I then highlight a few players in each tier where I believe there is a conclusion to be reached.
QB1s (Top 12)

Observations:
- Joe Burrow: Joe Burrow’s depiction here seems understated to me. Due to injuries, Tee Higgins finished as a WR4 (1 point) and, at this point, it looks like he will be a Bengal in 2024. Pending health, I would anticipate that Higgins will climb back into the WR2 range. Additionally, Burrow got Jermaine Burton in the 3rd round of the NFL draft and many analysts saw him as a first or second round talent. If we adjust for these, Burrow jumps to a respectable 9 points.
- Justin Herbert: Herbert’s 4 points leave a lot to be desired. He got 2 generous points for his 228 rushing yards and another 2 for Ladd McConkey’s 2nd round draft capital. While he remains an elite passer and I believe in the talent, he now gets a run first head coach and one of the lowest indirect cash flow metrics. I might be looking elsewhere in this tier during a startup.
- Caleb Williams: I recently put Caleb as my 1.04 in my 1QB rookie mock and got a bit of pushback on it. However, this calculation does a bit to justify that. In that memo, I stated, “We have never seen a #1 overall pick go into a situation like this that I can remember” and I stand by that. His 11 points from WR were propelled by 8 points from DJ Moore and Keenan Allen who both finished as WR1 on a PPG basis in 2023 then 3 from Rome Odunze’s top 10 draft capital. If all three of these receivers stay healthy, we could see a historic rookie season. I would easily consider him above Justin Herbert and Trevor Lawerence.
- Jordan Love: Similar to Burrow, I think this score is a bit deflated due to the youth on the roster. I would expect a couple of the GB receivers and tight-ends to ascend in 2024 (just don’t ask me which ones). This will drive his metric higher to justify his QB1 ranking. I believe he firmly belongs in this tier.
QB2s (13 to 24)
Observations:
- Brock Purdy: As mentioned above, this study was made for Brock Purdy. I was surprised to see how much higher his score was than the rest of this tier. I realize that one of his receivers will likely move on in the short term, but I’m confident in Kyle Shanahan to backfill that production. I wouldn’t blame anyone for taking him above Dak Prescott due to age.
- Bo Nix: I have seen Bo Nix fall to the middle of the second round of rookie drafts in Superflex leagues. This analysis does a decent job of justifying that. The lowest score of the entire analysis and a rookie? If Caleb Williams is set up for success, Bo Nix isn’t.
QB3s and Beyond
Observations:
- Kirk Cousins: Cousins will be the QB to break this analysis. I expect that he elevates the players around him. I wouldn’t be surprised if Drake London finishes as a WR2 (3 points), Kyle Pitts finishes as a TE1 (2 points), Bijan Robinson catches more passes (2 points), and Darnell Mooney finishes as a WR4 (1 point). That arrives at a much more respectable 8 points and puts him at the top of this tier. Similar arguments could be made for Aaron Rodgers.
- Gardner Minshew and Aidan O’Connell: I’m not sure who wins this job, but it is worth noting the weapons. There will likely be QB1 finishes sprinkled in. Obtaining both might be a viable cheap option in Superflex.
Conclusion:
Like a lot of my memos, the ‘indirect cash flow’ model herein is imperfect. However, it does a good job of highlighting which QBs are set up for success based on the players around them. Notice that I did not re-rank the QBs based on these metrics and instead still presented in DLF’s QB ranking. This is because when evaluating a business, you can’t only focus on the cash flow financial statement. You have to evaluate the income statement, balance sheet, and other disclosures as well to ultimately derive a business’s value. For dynasty, this means that we can’t ignore a player’s talent, age, scouting, or on-field performances. These concepts together derive a player’s value. However, we should consider the indirect inputs as well.
“Never take your eyes off the cash flow because it’s the life blood of business.”
- Dynasty GAAP Memo: Quarterbacks And The Indirect Cash Flow - June 13, 2024
- Dynasty GAAP Memo: Rookie Wide Receiver Volatility - May 17, 2024
- Dynasty GAAP Memo: 2024 1QB Rookie Mock Draft - April 29, 2024


