Defining the ‘Bulletproof Prospect’ Process for Running Backs
What is the bulletproof prospect process?
I have always believed that missing on high draft picks in dynasty leagues is the fastest way to the bottom of the standings and therefore became obsessed with trying to find players who have high floors that will hold their value. This led me down a path to try to find players who would be secure long-term assets.
The process has evolved over time and will continue to do so, I thought it would be best to take a moment and really define what I’ve been looking at.
When building the bulletproof prospect process, I looked at all of the running backs in my database with three or more RB1 seasons. I then compared what they have in common to see if there were any trends that jump out as well as a few other things that smart people have found to “matter”.
The things that I think “matter” are:
- Draft Capital
- Size
- Athleticism
- Production
- Yards Created – by Graham Barfield
The running backs in my database who were able to accomplish the feat of having three or more RB1 fantasy seasons in their career are:
- Adrian Peterson
- Steven Jackson
- Marshawn Lynch
- Chris Johnson
- Todd Gurley
- Mark Ingram
- Ezekiel Elliott
- Melvin Gordon
- Matt Forte
- Ray Rice
- LeSean McCoy
- Maurice Jones-Drew
- Le’Veon Bell
- Frank Gore
- Jamaal Charles
- DeMarco Murray
- David Johnson
- Arian Foster
They will be referred to as “the sample” throughout the rest of the article.
Draft Capital
The first factor I look at for bulletproof prospects is draft capital. Here is how the sample faired in the NFL draft
First-round picks – 8
Second-round picks – 5
Third-round picks – 4
Fourth-round picks – 0
Fifth-round picks – 0
Sixth-round picks – 0
Seventh-round picks – 0
Undrafted – 1
I think that it is pretty safe to say that draft capital matters. It would take a rare case for me to include a player drafted beyond round three as a #bulletproofprospect
Here is another look at how draft capital matters from Peter Howard using this slick table he created.
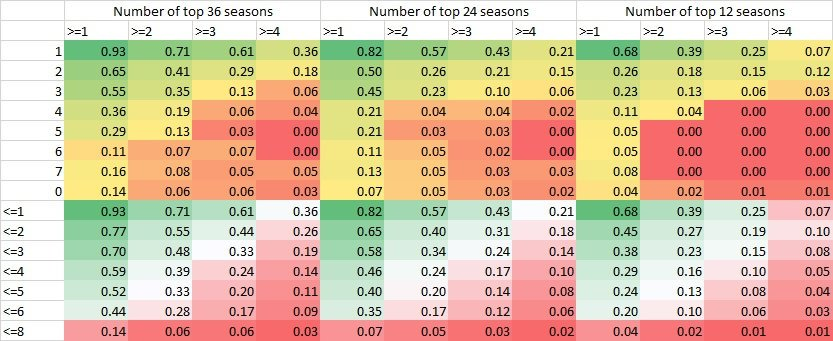
As you can see, highly drafted players are substantially more likely to put up fantasy relevant seasons which pretty much debunks the myth you can find RB’s anywhere in the draft.
Size
Size is perhaps the thing that I found most interesting when looking at this group. I had been a bit of a BMI snob in the past. I liked my running backs thick. In going through this exercise, we can see a couple of trends emerge.
First, all but two of the RBs are heavier than 208 pounds. The two smaller ones are Jamaal Charles and Chris Johnson. It should be noted that they have a 99th– and 100th-percentile 40-yard dash times, meaning they were two of the fastest running backs in the game.
The second trend was that once the running backs hit that 208-pound threshold, BMI didn’t really matter. There are several players in our sample that were low BMI but exceeded 208 pounds.
This is good news for Kerryon Johnson as one of my major concerns with him was that he was too slight to play running back in the NFL.
Another soon-to-be outlier is Christian McCaffrey. However, one thing that I tend to believe is that production trumps all else and McCaffrey has one of the most impressive production profiles I’ve ever seen.
Athleticism
I firmly believe that athleticism matters in athletics. However, athleticism on its own is completely irrelevant. What I mean by that is that an unproductive player with great athleticism is a near certainty to bust.
I will admit that athleticism is the least important of anything that I look at and therefore the only requirement is that the player has functional NFL athleticism. I just want to see that he belongs on an NFL football field. Elite athleticism is always a nice bonus, however, I believe elite athleticism leads us to an elite ceiling, not necessarily a high floor which is what the bulletproof process is looking for.
A very handy site when looking for how an athlete rates athletically is relativeathleticscores.com. Relative Athletic Score (RAS) factors in size and athletic testing to quantify a player’s score. It is based on a scale of 1 to 10 with 10 being the highest. Players are equally distributed across the scale meaning 10% are 1s, 10% are 2s, 10% are 3s, etc.
Here is an article outlining how RAS is distributed among the successful running backs in the NFL. To summarize it, successful running backs are disproportionately represented near the top of the RAS scale. If athleticism did not matter we would see an even distribution across the scale.
Our sample with their RAS scores looks like this:
| Name | RAS Score |
| Adrian Peterson | 9.64 |
| Steven Jackson | 9.75 |
| Marshawn Lynch | 7.81 |
| Chris Johnson | 9.57 |
| Todd Gurley | N/A |
| Mark Ingram | 2.57 |
| Ezekiel Elliot | 8.66 |
| Melvin Gordon | 8.75 |
| Matt Forte | 9.71 |
| Ray Rice | 8.18 |
| LeSean McCoy | 6.2 |
| Maurice Jones-Drew | 7.4 |
| Le’Veon Bell | 8.88 |
| Frank Gore | 6.52 |
| Jamaal Charles | 8.56 |
| DeMarco Murray | 9.18 |
| David Johnson | 9.84 |
| Arian Foster | 5.14 |
All of the players in our sample are above average in athleticism with the lone exception being Mark Ingram. Ten players of our 18 (56%) scored 8 or better. If there was an even distribution, we would only expect 20% to score 8 and above.
The bottom line: athleticism matters.
Production
The most important factor I look at is by far production. After all, good players produce. When looking at production, I look at several different metrics. The first thing I look at is market share of rushing yards.
I went through all 18 players’ rushing market share graphs in this tweet if you want to see them all.
Step 3: Bulletproof process for RB’s – Rushing production.
There are 17 players that have had 3 or more RB1 seasons in the https://t.co/q3FV3M88Vg database.
Lets see how they performed in terms of market share of rushing production
Here is the first bunch. #lotsadomination pic.twitter.com/2UklQeXmLD
— Drew Osinchuk (@DFBeanCounter) July 2, 2019
Essentially what we normally see is consistent domination from our sample. Only Frank Gore and Melvin Gordon had more than one season below the regression line. Therefore, market share of rushing yards is something that we like to see from our running back prospects.
Next up is market share of receiving yards. Everyone knows that receiving work is important to fantasy production at the running back position and the NFL is shifting even more in that direction.
I went through all 18 players’ receiving market share graphs in this twitter thread if you want to see them all.
Step 4: Bulletproof process for RB’s – Receiving production.
There are 17 players that have had 3 or more RB1 seasons in the https://t.co/q3FV3M88Vg database.
Lets see how they performed in terms of market share of receiving production
Here we go.
— Drew Osinchuk (@DFBeanCounter) July 2, 2019
Only three players never had a single season above the regression line. Therefore it is best if we see at least one season above average.
College Dominator
This metric includes the player’s share of rushing and receiving yardage and touchdowns in college.
| Name | College Dominator | Percentile |
| Adrian Peterson | 32.5% | 75th |
| Steven Jackson | 38.7% | 87th |
| Marshawn Lynch | 31.9% | 72nd |
| Chris Johnson | 42.5% | 93rd |
| Todd Gurley | 33.5% | 77th |
| Mark Ingram | 30.7% | 69th |
| Ezekiel Elliot | 37.8% | 86th |
| Melvin Gordon | 47.1% | 96th |
| Matt Forte | 57.3% | 99th |
| LeSean McCoy | 47.1% | 97th |
| Ray Rice | 45.1% | 95th |
| Maurice Jones-Drew | 28.7% | 64th |
| Le’Veon Bell | 45.1% | 95th |
| Frank Gore | 22.5% | 42nd |
| Jamaal Charles | 30.9% | 70th |
| DeMarco Murray | 29.9% | 66th |
| David Johnson | 40.8% | 91st |
| Arian Foster | 20.4% | 32nd |
As you can see, there are only two players below the 66th percentile, undrafted Arian Foster and ageless wonder Frank Gore. Being in the top third of college producers is something that is very important to the bulletproof process.
Yards Created
A newer metric that I believe carries a lot of weight for the bulletproof process is Graham Barfield’s Yards Created metric. This separates out how many yards the running back creates versus how many yards the offensive line creates. The goal is to determine how much the running back is creating for himself – as he doesn’t get to bring his offensive line with him to the NFL.
In its relatively short tenure, it has proven very predictive. Graham started charting games like this for the 2016 college season and since then it has shone a positive light on players like Alvin Kamara, Kareem Hunt, and Joe Mixon to name a few.
All in all, this is the process I go through when looking for the highest-probability running backs. Let’s take a look at how each player from our sample would have fared in the #bulletproofprospect process.
| Name | Draft Capital | Size | Athleticism | MS Rushing | MS Receiving | College Dominator |
| Adrian Peterson | Yes | Yes | Yes | Yes | No | Yes |
| Steven Jackson | Yes | Yes | Yes | Yes | Yes | Yes |
| Marshawn Lynch | Yes | Yes | Yes | Yes | Yes | Yes |
| Chris Johnson | Yes | No | Yes | Yes | Yes | Yes |
| Todd Gurley | Yes | Yes | Yes | Yes | Yes | Yes |
| Mark Ingram | Yes | Yes | No | Yes | Yes | Yes |
| Ezekiel Elliot | Yes | Yes | Yes | Yes | Yes | Yes |
| Melvin Gordon | Yes | Yes | Yes | No | No | Yes |
| Matt Forte | Yes | Yes | Yes | Yes | Yes | Yes |
| LeSean McCoy | Yes | Yes | Yes | Yes | Yes | Yes |
| Ray Rice | Yes | Yes | Yes | Yes | Yes | Yes |
| Maurice Jones-Drew | Yes | Yes | Yes | Yes | Yes | Yes |
| Le’Veon Bell | Yes | Yes | Yes | Yes | Yes | Yes |
| Frank Gore | Yes | Yes | Yes | No | No | No |
| Jamaal Charles | Yes | No | Yes | Yes | Yes | Yes |
| DeMarco Murray | Yes | Yes | Yes | Yes | Yes | Yes |
| David Johnson | Yes | Yes | Yes | Yes | Yes | Yes |
| Arian Foster | No | Yes | No | Yes | Yes | No |
In total 11 of our 18 checked every box. An additional three players only missed in one criteria, one player missed in two criteria, and two players missed in three.
Moving forward it is prudent to apply context to these numbers. Given that it is impossible to apply unbiased context on prior-year players, I won’t attempt to do that. However, over the past few years, there have been exceptions made for players that had high-quality teammates like Nick Chubb and Sony Michel or for underwhelming production like Rashaad Penny being stuck behind a record-setting running back in Donnel Pumphrey.
I am certain that in the years to come, there will be instances where I apply context that you disagree with. That’s allowed. That is why I provide all of the data so you can make your own decisions and apply the context that makes sense to you.
- CeeDee Lamb vs Jerry Jeudy: Teammates and Quarterbacks - June 27, 2020
- ADP Trends: Positional Value Gains by Round in Rookie Drafts - April 22, 2020
- Bulletproof Prospect Process: Bryan Edwards, WR South Carolina - April 20, 2020


