Trading During a Startup Draft: The Historical Value Approach

It seems like everybody and their brother has a dynasty trade calculator right now. But from what I’ve seen, no one is sharing the “secret sauce.” Some of these calculators are based on average draft position (ADP) and/or past trades. Some are based on secret projection models. And some have unknown foundations. Now, I’m not criticizing. Trade calculators are hard — that’s why I didn’t make one.
Instead, I tackled a more manageable subject: trading during a startup draft. The nice thing about this subject is I can throw data at it. And all the data is publicly available (thanks to DLF forum users Telperion and cmizelle). So let’s get to it.
Startup Picks
First, I assembled all the running backs, wide receivers and tight ends with an ADP of 240 or lower in any season from 2010 to 2012, as well as their games played and fantasy points scored (PPR) from 2010 to 2014. Using this data, I calculated each player’s seasonal production value (V) for every year through 2014. V = games played*(points/game – baseline), where baseline scoring is 11 points/game for wide receivers, 10.5 points/game for running backs, and 9.5 points/game for tight ends. Then I calculated each player’s “three-year value” from the date of the startup draft.
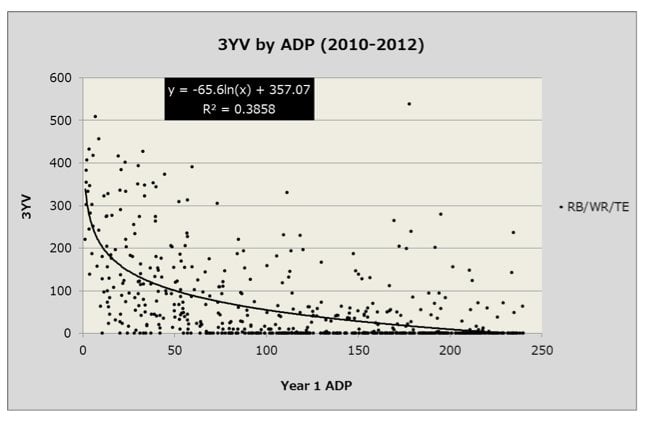
Now, I don’t actually value players on a three-year window, but I recognize it as likely the most common approach (and a pretty good one). Moreover, unlike my preferred approach, the three-year window doesn’t rely on anything fuzzy like future trade value. It’s about concrete fantasy production – the kind that wins titles. Here’s the graph of every player’s value, complete with a logarithmic best fit curve:
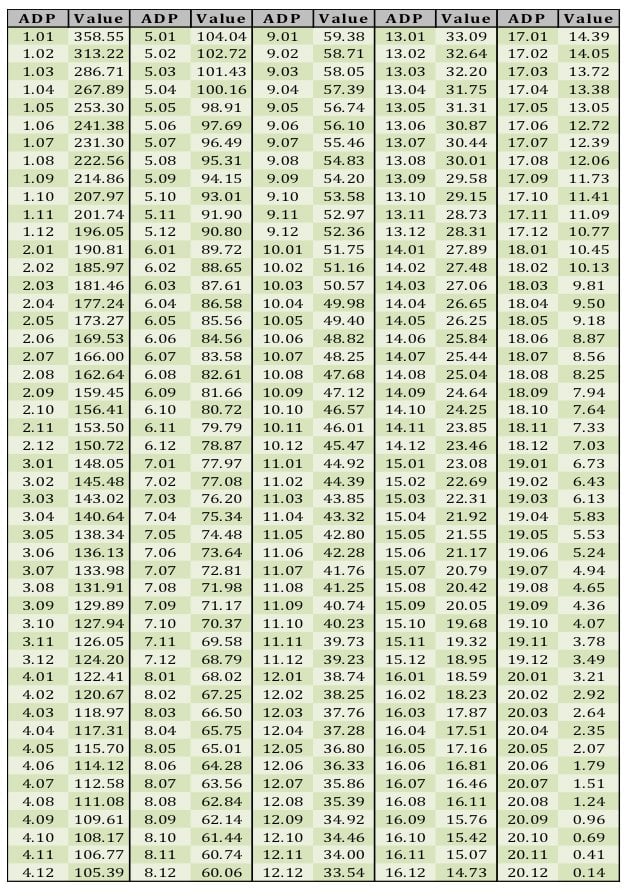
There’s your startup pick trade calculator right there! But maybe I should explain it a bit more. The best-fit curve tells us roughly how much value a player taken at any particular draft spot will have in our lineup for the next three years. For example, the 1.01 is expected to produce about 357 points above baseline over the next three years, while the 3.01 is expected to produce about 148 points above baseline and the 13.01 is expected to produce just 23 points above baseline over the same period. Of course, the formula is far from certain, but the fit isn’t too bad, especially considering the impact luck, injuries, and situation have over a three-year window.
Anyhow, enough examples. Here’s the chart:
[am4show have=’g1;’ guest_error=’sub_message’ user_error=’sub_message’ ]
This isn’t meant to perfectly capture the value of every pick in every year. For example, in 2015, you’d have a hard time getting someone to give you the 1.05 and 5.05 to move up to 1.01, but that’s because the top tier of players in 2015 is perceived to be flatter than normal.
After pick 240, the picks essentially become valueless. (Actually, I had to bump all the values up just a smidge so they didn’t become valueless sooner. That’s why, if you’re mathematically inclined, you’ll notice the best fit formula doesn’t produce exactly the chart’s values.) Of course, a very late startup pick isn’t really valueless, but it doesn’t have much more value than the open roster spot you’d save by trading it away. Indeed, most of the players drafted in the last few rounds are likely to end up on waivers before very long.
Because this chart treats late picks as valueless, you can use it to value most “unbalanced” (2-for-1 or 3-for-1) trades without much trouble. However, I would not recommend using it for any trade that is unbalanced by more than two picks. In other words, Don’t rely on these values to evaluate a 4-for-1 or 5-for-2 trade.
Future (Rookie) Picks
Trading during a startup draft doesn’t just mean trading startup picks. There’s also the important question of how to value future rookie picks. To be sure, future trade value is particularly important when buying or selling future picks, but here we’re going to focus strictly on expected production. (If you’re interested in future trade value, I strongly recommend reading Jeff Miller’s Rookie Draft Study and Ryan McDowell’s Rookie Investments.)
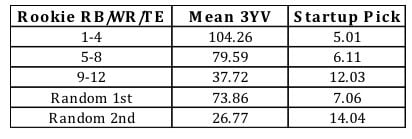
With that in mind, I put together a chart showing the three-year production value of rookie running backs, wide receivers, and tight ends based on startups from 2007 to 2012. The third column indicates what startup pick would be expected to return similar value. (Note, this chart excludes quarterbacks, which likely means it underestimates a pick’s expected value just a touch.)
This matches the conventional wisdom that an owner should be willing to trade his or her seventh-round startup pick for a random future first (especially when quarterbacks are added into the mix). Of course, an owner trading away a future first should have a better-than-random chance of making the playoffs, and rookies in the 9-12 range haven’t been nearly as valuable.
One could toy around with the odds of a team finishing at a certain place in the standings to evaluate the value of a future pick. For example, if I think my team has a 20% chance of earning the 1.01-1.04 pick, a 40% chance of earning the 1.05-1.08, and a 40% chance of earning the 1.09-1.12, my future first’s expected 3YV is 67.78 (0.2*104.26 + 0.4*79.59 + 0.4*37.72), which is what I’d expect to get from the 8.01 pick in a startup. In general, I’m conservative about predicting my own team’s success, especially when valuing my future picks. As such, I’ll never assign my team more than a 50% chance of ending up with the 1.09-1.12 pick, and I always assign myself at least a 20% chance of “earning” a top-4 pick.
Conclusions
Between these two charts, you have the tools to make relatively informed decisions about trading in a startup draft. That said, don’t take the charts as gospel. Every draft is different, and a three-year window is not the only way to value players (or even the best one, at least for me). But if you want to know whether the trade you’re considering is in the right ball park, these charts make for a good check on your intuition.
[/am4show]
- Dynasty Capsule: Miami Dolphins - January 26, 2019
- Dynasty Capsule: Buffalo Bills - January 21, 2019
- Dynasty Capsule: Carolina Panthers - January 21, 2018


