Dynasty Fantasy Football Mailbag: Where Does Brock Bowers Fit in the Tight End Landscape?
Welcome back to the DLF Mailbag, the preeminent mailbag in all the dynasty fantasy football land. As a reminder, there are multiple ways to pose your burning questions! I’ll be soliciting weekly feedback via X/Twitter (look for a new pinned tweet each Monday), and you can also reach out using our Discord channel, or the old-fashioned way (via our online webform).
I have nothing terribly clever to open with this week, as we once again find ourselves in a mini off-season doldrum following a frenetic opening to free agency. Instead, I’ll utilize this opportunity to cross-promote my recent “rankings explained” piece, which details who I perceive to be the top 120 assets in a 1QB setting. Within you can find roughly 3,000 words that should hopefully give you some insight into my process, as well as inform the “why?” behind how I answer these questions every week.
Let’s get to it!
From the online webform…
We’re in the (Tight) Endgame Now
How high would you take Brock Bowers in a 12-team, 2PPR tight-end premium, superflex league rookie draft? I feel like he’s already a top-seven pick, but with players at the position getting two points per reception is it crazy to take him at pick 1.03 when I’m set at quarterback? – Jonathan in Pittsburgh
While noting nothing is ever certain, most if not all the NFL Draft pundits foresee the first four picks including three quarterbacks and wide receiver Marvin Harrison Jr. Georgia tight end Brock Bowers also appears likely to go in the first half of the first round, with a top-ten selection included in the realm of possibility. So when it comes to Jonathan’s decision here, he’ll undoubtedly be choosing amongst players possessing peak draft capital. This is all to say we don’t have an immediate differentiator following the (likely) selection of Caleb Williams at pick 1.01.
Given this, I’ll instead pivot to one of my favorite places – the numbers! We know that in any given week in a 12-team superflex league, there can be up to 24 signal callers populating starting lineups. However, this league also comes with a flexible lineup setting, where up to five Flex players are chosen following one running back, wide receiver and tight end apiece. Given the shallow depth at the position, it’s hard to imagine more than 20-30 tight ends starting on a weekly basis, but it’s notable nonetheless as we attempt to contrast the position with the quarterbacks.
Continuing, in order to try and glean some additional information on positional value, I compared the scoring between the two positions over the past three years, as shown in the table below. In order to get a fuller picture I looked at both individual data points and averages, looking at the #1, #6, #12, #18, and #24 finishers at each position.
| Position | 2021 | 2022 | 2023 | Average Points |
| QB1 | 476.7 | 486.3 | 473.7 | 478.9 |
| QB6 | 391.1 | 365.1 | 364.4 | 373.5 |
| QB12 | 343.0 | 333.1 | 336.5 | 337.5 |
| QB18 | 291.0 | 259.2 | 281.8 | 277.3 |
| QB24 | 247.0 | 221.0 | 191.1 | 219.7 |
| TE1 | 404.1 | 426.3 | 321.3 | 383.9 |
| TE6 | 244.6 | 224.0 | 268.2 | 245.6 |
| TE12 | 227.0 | 195.5 | 190.3 | 204.3 |
| TE18 | 176.4 | 153.5 | 184.1 | 171.3 |
| TE24 | 128.5 | 138.4 | 155.5 | 140.8 |
A few things are immediately clear. First, and likely to no one’s surprise even with the enhanced tight end scoring, quarterbacks rule the roost. Even comparing their worst data point (2023) to the best tight end data point (2022), the point differential is nearly two game’s worth of scoring. Again, not surprising, but good to confirm.
Secondly, the quarterbacks were significantly more consistent than their tight end counterparts, especially amongst the QB1-12 ranks. To that point, the 2021 QB6 stands as the only real outlier, with about an additional game’s worth of scoring. Otherwise the scoring is remarkably steady.
Looking at the tight ends, there is over a 100-point difference in the overall TE1 in 2022 (Travis Kelce) versus 2023 (Sam LaPorta). The range at TE6 is 44.2 points, and at TE12 is 37.3 points. Anecdotally this seems about right – tight end is a position predicated on a couple of stars, and then filling in the gaps accordingly. Still, the signal to noise is notable, and is shown again below in graphical format.
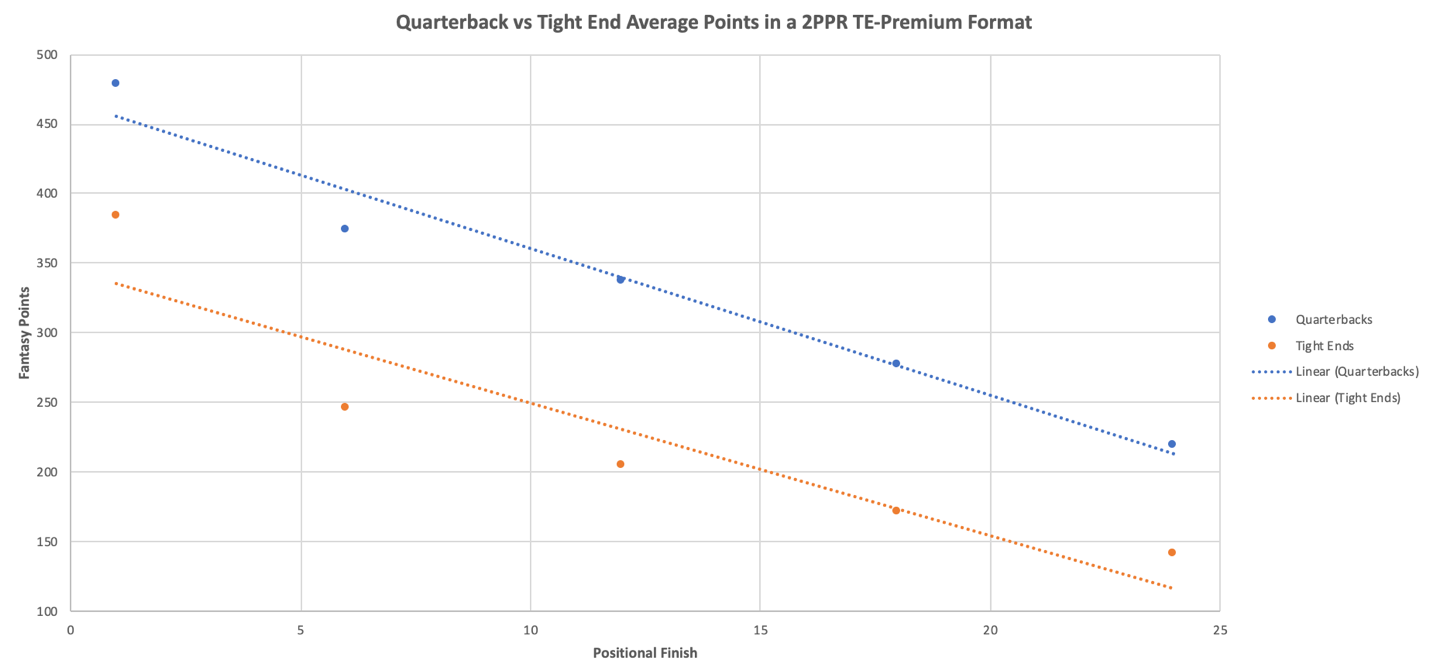
Truthfully the trendlines aren’t terribly different, which is likely helped by the effect of averaging out the yearly numbers. But even given this, the quarterback curve fits better, and the outliers are closer to the general trend as compared to the tight ends. In both positions, it seems evident that having the top positional player has a demonstrable effect.
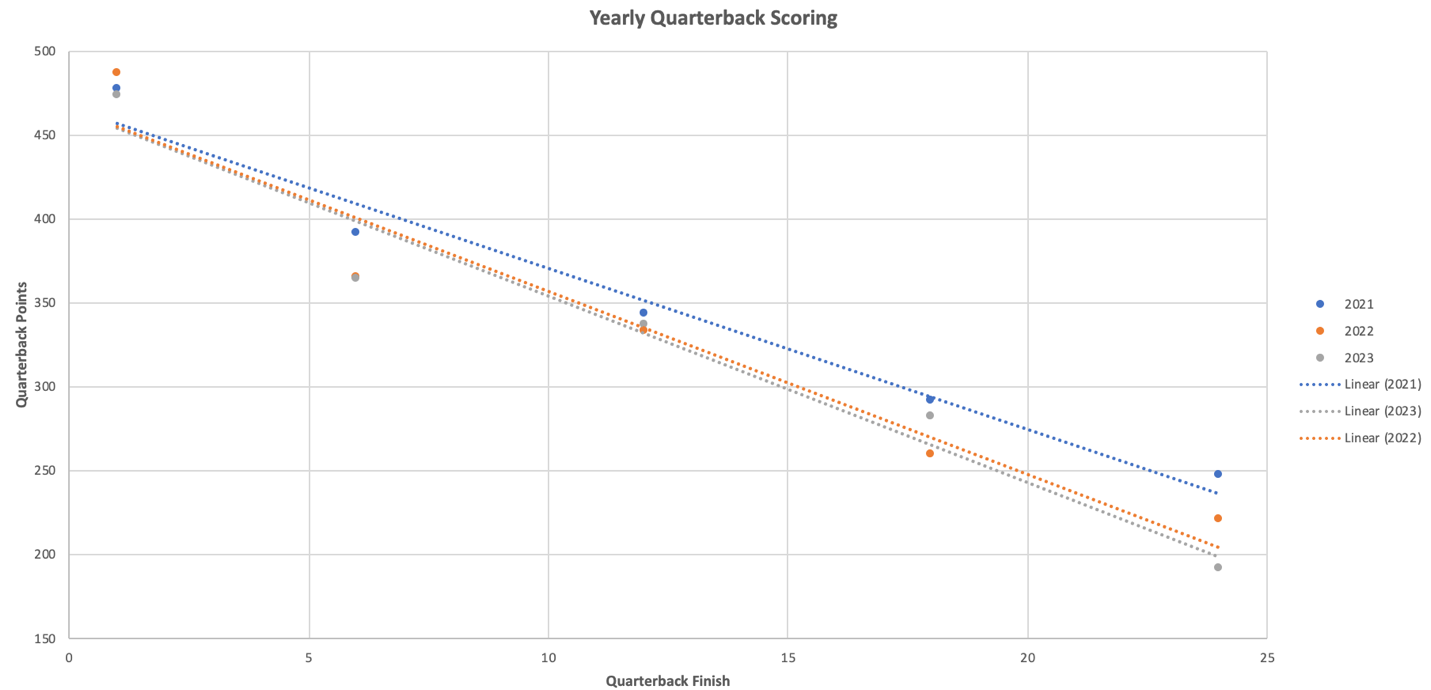
If we remove the effect of averaging and simply look at each position on a yearly basis, it becomes even more evident that the quarterbacks exhibit a larger trend. It still pays to have an elite player, and there is a noticeable drop-off from the trend at QB6, but this is a bit cleaner, with yearly numbers a bit stickier.
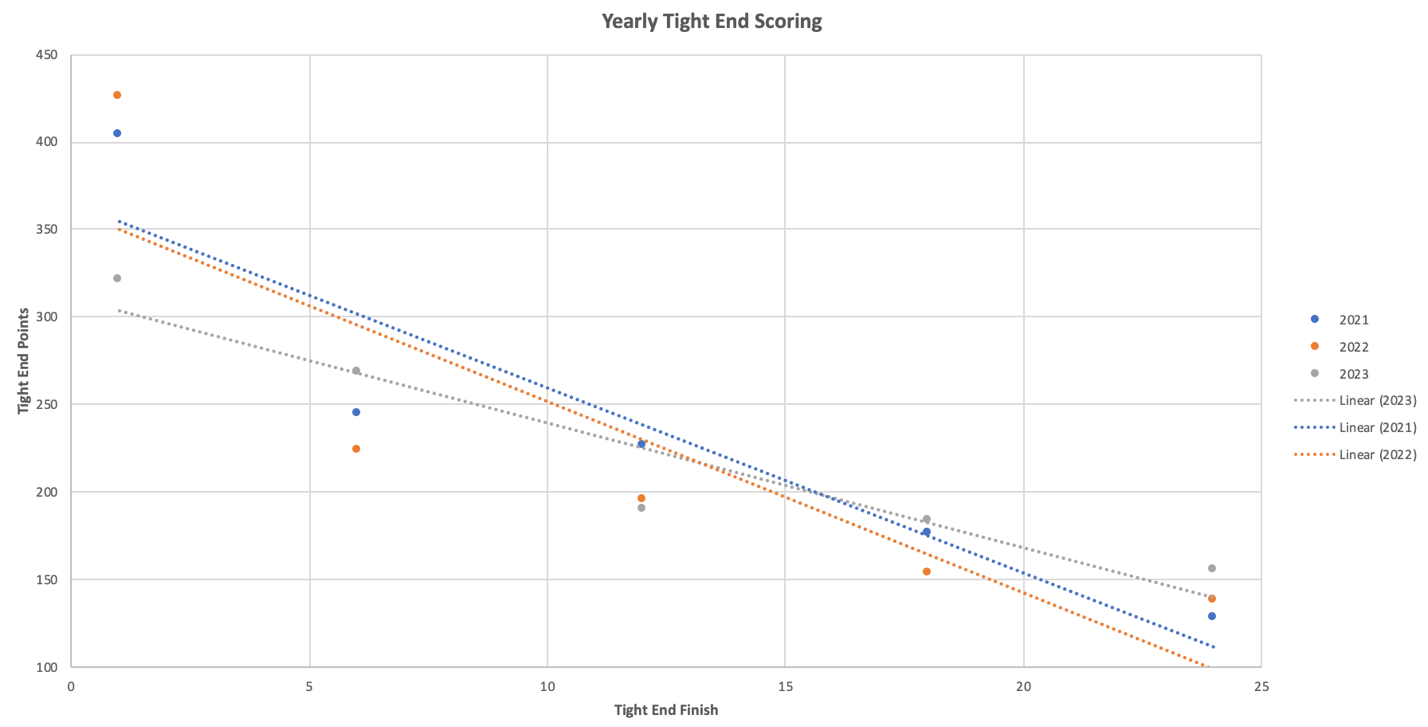
Performing the same exercise for the tight ends yields utter chaos. Particularly we see what happens to the shape of the curve when the top-tier guys don’t have truly elite seasons, as was the case in 2023. There is more of a flattening through TE6, followed by an underwhelming TE12 before the trend picks back up. When the TE1 does have a truly elite season, such as in 2021 and 2022, the difference between TE1 and TE6 is stark, and even the TE12 remains lower than the general trend. While interpretations may differ, what I believe we’re seeing is the larger magnitude of variance at tight end versus quarterback.
“Okay Eric, thanks for all that lovely data and those super-cool looking graphs…but so what?”
So, this is where you need to ask yourself the question – what do you believe Bowers’ upside is? If you truly believe he has overall TE1 potential, then he absolutely could have more value than Drake Maye or Jayden Daniels, or even Harrison. And to the other side of this coin, where do you see Maye and Daniels fitting in? If you believe they have that QB1-type of upside, that will still carry significant value, even with the heightened tight end scoring. But if you see more QB6-12 (or lower) upside, that curve flattens out fairly quickly and you might not be getting a game-changer.
I can’t answer that question for you. What I can say is I would absolutely be comfortable taking a player like Bowers, given his pedigree and anticipated draft capital, at pick 1.03 in a 2PPR format. Even in non-TE premium superflex formats, Kyle Pitts was going as early as 1.02 in certain leagues. While I recognize Pitts had a near-impeccable profile, Bowers might even be better. So overall, I wouldn’t view it as a reach, and the data supports chasing upside at tight end versus quarterback.
To conclude, let’s see what DLF’s Trade Analyzer spits out in comparing LaPorta to Patrick Mahomes, who is considered the overall QB1 by ADP. Note that it’s not an inherent 1:1 as the input here is only 1.5 PPR for tight ends, but it should still present a useful point of comparison.

Not surprisingly, Mahomes comes out on top. He’s more of a proven commodity than LaPorta, and likely presents as a safer asset. But again, we’re not comparing Mahomes to LaPorta, we’re comparing the likelihood that any of the 2024 rookies can represent such values moving forward. If Bowers seems likelier than any of the non-Caleb Williams quarterbacks to hitting that ceiling, it will have been a pick well spent.
- Dynasty Fantasy Football Mailbag: Justin Jefferson Or A Bundle Of Draft Picks? - April 23, 2024
- Dynasty Fantasy Football Mailbag: Is Kendre Miller Valued Unfairly? - April 17, 2024
- Forgotten Dynasty Veterans: Bottom Tier - April 9, 2024


