Then and Now: Tight Ends
“As the present now will later be past, the order is rapidly fadin’. And the first one now will later be last, for the times they are a changin’.”
– Bob Dylan
 What a difference a year can make. Only seven short weeks into the season, the NFL has already been awash in a sea of change including such events as the Kansas City Chiefs starting off the year as the only unbeaten team, the previously moribund Cleveland Browns outperforming division rival Pittsburgh, and prior NFC heavyweight Atlanta already losing more games than they did all of 2012. Not shockingly, this restructuring has impacted multiple players in the fantasy landscape as well.
Put another way, we set our pre-season expectations largely based off of a year’s worth of evidence from last season. We observed these trends in order to help clarify the outlooks of many players of interest, but now have a reasonable amount of current data in hand. So – what’s changed?
This short series sets out to answer that very question. This four-part breakdown will look at the top ten players at each position from 2012, and compare how they’re performing so far in 2013. From there we can decide if it’s time to reset our expectations in order to predict the potential results for the remainder of the season.
In order to do so, it’s time to bust out some statistics, and by now it’s no secret to the DLF masses that I’m a huge proponent of efficiency metrics. Instead of explaining this affinity yet again, I’ll just refer you here, here, here, here and here. Simply put, in my opinion it’s the best way to not only compare apples to apples, but to essentially pluck them from the identical branch of the same metaphorical tree.
In that spirit, key efficiency metrics will be used in order to judge each player’s progression (or regression) in the past year. I’ll also include rationale as to why things could be going the way they are, as well as insight towards the future. Let’s conclude with the tight ends!
Before we dive into the data, here’s a list of abbreviations and explanations for the key terms used:
Fantasy Points Per Game (PPG) – Each player’s weekly output according to standard WCOFF PPR scoring.
Targets Per Game (TPG) – A weekly summation of each player’s opportunities.
Touchdowns Per Game (TDPG) – The number of receiving touchdowns divided by the total number of games played.
Points Per Target (PPT) – The number of PPR fantasy points divided by the total number of targets.
Yards Per Target (YPT) – The figurative “degree of difficulty” of making catches. YPT combines the yards-per-catch and catch percentage statistics, and can be calculated by dividing the total yards by the number of targets.
Percent Change to the Quarterback’s Points Per Passing Attempt (%CPPA) – I’ve previously defined a quarterback’s points per passing attempt (PPA) as “a quarterback’s total fantasy points from passing (rushing points subtracted) are divided by his total passing attempts.” %CPPA is the percent difference between a quarterback’s PPA when he only targets the receiver in question versus his overall PPA. It provides insight into whether or not the receiver elevates the quarterback’s play, regardless of how bad the quarterback in question is playing.
Percent Changes (% Change) – This shows the differences for each metric between 2012 and 2013.
Let’s get started! (Editor’s note: All 2013 statistics include only the first six weeks of the season)
Note: This study has omitted Rob Gronkowski (2012 TE5) and Dennis Pitta (2012 TE8), as they haven’t yet played this season. Owen Daniels (2012 TE9) was also excluded as he has recently been placed on the short-term injured reserve.
Jimmy Graham, TE NO
|
Year |
Rank |
PPG |
TPG |
TDPG |
PPT |
YPT |
%CPPA |
|
2012 |
1 |
15.8 |
9.0 |
0.6 |
1.76 |
7.27 |
-2.0 |
|
2013 |
1 |
22.1 |
9.8 |
1.0 |
2.24 |
10.05 |
40.1 |
|
% Change |
– |
39.9 |
8.9 |
66.7 |
27.3 |
38.2 |
2105.0 |
Then and Now: Even after getting shut out by the Patriots in week six, Graham remains a whopping 13.8% better than the next closest player at the position (Jordan Cameron). In fact, he’s been so good that he’s currently a top-10 overall PPR scorer, and the only non-quarterback ahead of him in the pecking order is Chiefs’ running back Jamaal Charles. So given that, the numbers in the bottom row of the table above should come as no surprise – Graham has been simply sublime, dwarfing the 2012 numbers that saw him finish as, you guessed it, the number one overall player at the position. Targeted more, scoring more, and playing more efficiently, Graham has a legitimate case as fantasy 2013 MVP.
Future Prognosis: There’s no reason to expect Graham to slow down. He’s a positional mismatch on an offense led by a future Hall of Fame quarterback. If you’re an owner, just sit back and enjoy the ride.
Tony Gonzalez, TE ATL
|
Year |
Rank |
PPG |
TPG |
TDPG |
PPT |
YPT |
%CPPA |
|
2012 |
2 |
14.6 |
7.8 |
0.5 |
1.89 |
7.50 |
6.9 |
|
2013 |
6* |
17.0 |
9.4 |
0.6 |
1.81 |
7.21 |
9.6 |
|
% Change |
– |
16.4 |
20.5 |
20.0 |
-4.2 |
-3.9 |
39.1 |
* denotes the player has already had his bye week
Then and Now: The ageless wonder is back and just as good as ever. Now 37 years old, Gonzalez has managed to improve upon a superb 2012 season, seeing a greater volume of targets while maintaining similar efficiency. It can be argued that with receiver Julio Jones down for the count, Gonzalez now stands as the lone bright spot on a struggling offense. He should continue to be heavily targeted, ensuring that his farewell tour is a good one.
Future Prognosis: Injuries have decimated the Atlanta offense, and Gonzalez will continue to benefit. It’s not unreasonable to expect double-digit targets per game for the remainder of the season.
Jason Witten, TE DAL
|
Year |
Rank |
PPG |
TPG |
TDPG |
PPT |
YPT |
%CPPA |
|
2012 |
3 |
14.5 |
9.2 |
0.19 |
1.58 |
7.07 |
-21.1 |
|
2013 |
8 |
13.8 |
8.0 |
0.50 |
1.73 |
7.08 |
-6.4 |
|
% Change |
– |
-4.8 |
-13.0 |
163.2 |
9.5 |
0.1 |
69.7 |
Then and Now: Witten has been his usual consistent self in 2013, and the lower ranking is more indicative of a newfound bevy of talent at the position than anything else. While he’s seen fewer targets, the historically end-zone deficient Witten has been scoring at a significantly higher rate, leading to an increase in the other efficiency metrics. Simply put, Witten has been as reliable as ever.
Future Prognosis: Due to injuries, Witten and receiver Dez Bryant will be leading the Dallas charge for the next few weeks at a minimum. With an increase in targets, Witten should ultimately end the year as a top five positional play.
Heath Miller, TE PIT
|
Year |
Rank |
PPG |
TPG |
TDPG |
PPT |
YPT |
%CPPA |
|
2012 |
4 |
13.4 |
6.7 |
0.53 |
1.99 |
8.08 |
21.2 |
|
2013 |
30* |
11.3 |
6.3 |
0.00 |
1.78 |
9.95 |
-3.5 |
|
% Change |
– |
-15.7 |
-6.0 |
-100.0 |
-10.6 |
23.1 |
-116.5 |
*denotes the player has missed games due to injury
Then and Now: Long underutilized, Miller broke out in 2012 under new offensive coordinator Todd Haley before tearing multiple ligaments in his knee in a week 16 tilt with the Bengals. It was then posited that as Miller was on the wrong side of 30, this could be the type of injury that would curtail his career. Well, in his three games back all Miller has done is play more efficiently than he did all of 2012. Don’t let the negative percent changes fool you – those are due to the fact he hasn’t yet scored a touchdown. Miller is making the most of his targets between the 20’s, and it’s only a matter of time before he begins to find the end zone again.
Future Prognosis: In the span of three games, Miller’s receiving yardage has gone from 35 to 70 to 84, and he’s averaged five receptions per game during that same period. Now playing virtually every snap, Miller offers mid-level TE1 value the rest of the way.
Brandon Myers, TE NYG
|
Year |
Rank |
PPG |
TPG |
TDPG |
PPT |
YPT |
%CPPA |
|
2012 |
6 |
11.5 |
6.6 |
0.25 |
1.75 |
7.68 |
4.9 |
|
2013 |
23 |
7.5 |
5.3 |
0.17 |
1.40 |
6.50 |
-15.6 |
|
% Change |
– |
-34.8 |
-19.7 |
-32.0 |
-20.0 |
-15.4 |
-418.4 |
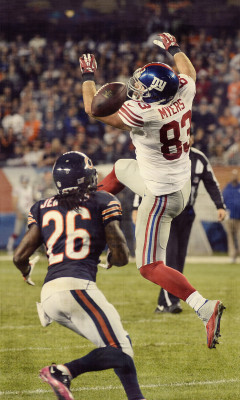
Then and Now: Unlike with Miller, there’s no way to explain away Myers’ gross statistical reduction. In essence, he just hasn’t been used the same way as he was in 2012, when he acted as quarterback Carson Palmer’s main check-down option, as well as a noted garbage time hero. In New York, Myers is merely the fourth man on the target totem pole, and when he does catch the ball he doesn’t do much with it. Considering his dramatic dip in %CPPA, perhaps it’s a good thing Eli Manning has been avoiding him.
Future Prognosis: The Giants are a mess on offense and despite constantly playing from behind, Manning hasn’t been able to elevate the play of those around him. Myers is best left on fantasy benches.
Greg Olsen, TE CAR
|
Year |
Rank |
PPG |
TPG |
TDPG |
PPT |
YPT |
%CPPA |
|
2012 |
7 |
11.5 |
6.5 |
0.31 |
1.76 |
8.11 |
7.9 |
|
2013 |
12* |
11.6 |
7.2 |
0.20 |
1.62 |
8.11 |
-14.4 |
|
% Change |
– |
0.9 |
10.8 |
-35.5 |
-8.0 |
0.0 |
-282.3 |
* denotes the player has already had his bye week
Then and Now: With the exception of a decrease in his rate of scoring, Olsen is basically the same guy he was in 2012. Truthfully the most disappointing aspect of his 2013 season is that even though quarterback Cam Newton has elevated his game, Olsen hasn’t kept pace (note the %CPPA values). Even given that, Olsen is still the team’s leading pass catcher, and one of Newton’s favorite targets.
Future Prognosis: Barring some huge kind of paradigm shift in the Carolina offense, Olsen should continue to fulfill the same role he has over the past few years. He remains a consistent, if uninspiring low-end TE1.
Jermaine Gresham, TE CIN
|
Year |
Rank |
PPG |
TPG |
TDPG |
PPT |
YPT |
%CPPA |
|
2012 |
10 |
10.5 |
5.9 |
0.31 |
1.78 |
7.84 |
9.8 |
|
2013 |
22 |
7.5 |
5.3 |
0.00 |
1.41 |
6.56 |
-35.7 |
|
% Change |
– |
-28.6 |
-10.2 |
-100.0 |
-20.8 |
-16.3 |
-464.3 |
Then and Now: With apologies to Karl Safchick, Gresham hasn’t answered the bell in 2013. While his targets haven’t drastically decreased from 2012, he just hasn’t done nearly as much with them. Gresham isn’t churning out yardage at the same rate, isn’t scoring, and is making an already bad Andy Dalton look even worse.
Future Prognosis: AJ Green is the man in Cincy, and predicting the other beneficiaries in this offense has been a weekly crapshoot. As the Bengals’ other pass catchers such as Mo Sanu, Marvin Jones, Tyler Eifert and Gio Bernard are all fighting for a piece of the pie, Gresham is an option best left avoided.
Kyle Rudolph, TE MIN
|
Year |
Rank |
PPG |
TPG |
TDPG |
PPT |
YPT |
%CPPA |
|
2012 |
11 |
9.8 |
5.8 |
0.56 |
1.68 |
5.30 |
43.9 |
|
2013 |
15* |
10.6 |
6.2 |
0.40 |
1.71 |
6.45 |
24.4 |
|
% Change |
– |
8.2 |
6.9 |
-28.6 |
1.8 |
21.7 |
-44.4 |
* denotes the player has already had his bye week
Then and Now: Even with a near 30% drop-off in his rate of touchdown scoring, Rudolph has emerged as a better player in 2013. He’s coupled a higher catch percentage with a slightly increased yards-per-catch statistic, leading to a dramatic increase in the YPT metric. Perhaps more importantly, Rudolph has yet to be shut out of any game, recording at least two receptions in every game so far this season.
Future Prognosis: Even if the upgrade is merely marginal, Josh Freeman’s ascension to the starting quarterback spot should help Rudolph out. If he can regain his previous red zone form, we could be looking at a top ten positional option when all is said and done.
Martellus Bennett, TE CHI
|
Year |
Rank |
PPG |
TPG |
TDPG |
PPT |
YPT |
%CPPA |
|
2012 |
12 |
9.2 |
5.6 |
0.31 |
1.64 |
6.96 |
1.4 |
|
2013 |
7 |
14.0 |
7.3 |
0.50 |
1.91 |
7.93 |
12.6 |
|
% Change |
– |
52.2 |
30.4 |
61.3 |
16.5 |
13.9 |
800.0 |
Then and Now: Thus far in the 2013 season, Bennett has essentially operated as a poor man’s Jimmy Graham. By that, I’m referencing the fact that like his New Orleans counterpart, Bennett has seen improved numbers across the board. Flourishing in the new Chicago offense, Bennett has proven himself to be integral to the weekly game plan, and also a threat in the red zone. Perhaps more importantly, his prowess in the blocking game ensures he’ll continue to function as an every down player.
Future Prognosis: Still relatively short on starting experience, there’s no reason to think Bennett won’t continue to improve. Though he’ll remain behind Brandon Marshall in the pecking order, Bennett has carved out a nice niche as a mid-range TE1.
Antonio Gates, TE SD
|
Year |
Rank |
PPG |
TPG |
TDPG |
PPT |
YPT |
%CPPA |
|
2012 |
13 |
9.7 |
5.3 |
0.47 |
1.81 |
6.73 |
27.0 |
|
2013 |
5 |
15.8 |
8.2 |
0.33 |
1.93 |
9.51 |
-3.6 |
|
% Change |
– |
62.9 |
54.7 |
-29.8 |
6.6 |
41.3 |
-113.3 |
Then and Now: I’m thrilled to end this mini-series on a high note. Much like with Gonzalez above, the venerable Gates refuses to succumb to the icy grip of Father Time. Even with a reduction in scoring, Gates’ efficiency metrics are up, coinciding with a non-trivial bump in volume. Don’t worry about the reduced %CPPA – quarterback Philip Rivers has been playing out of his mind so far this year.
Future Prognosis: After struggling with injuries the past few years, Gates appears healthy and as spry as he has since he was younger. So even though the Chargers boast other talented options at receiver, expect Gates to continue to lead the charge for a resurgent San Diego offense.
Follow me on Twitter @EDH_27
- Dynasty Fantasy Football Mailbag: Justin Jefferson Or A Bundle Of Draft Picks? - April 23, 2024
- Dynasty Fantasy Football Mailbag: Is Kendre Miller Valued Unfairly? - April 17, 2024
- Forgotten Dynasty Veterans: Bottom Tier - April 9, 2024


