True Points – A New Efficiency Metric for Running Backs
 I know it seems like I’m beating a dead horse, but when I assess a football player’s fantasy prowess, I like to look deeper than what raw statistics have to offer. With 32 different offenses in the NFL, it’s a veritable certainty that players will be utilized in different fashions, including both scheme and usage. As such, it’s folly to attempt to directly compare them to one another and assume you’ll derive some robust means of differentiation. In my opinion, it’s just not that simple.
To afford a universal means of comparison, I’ve found that efficiency metrics work best – how well does the player in question perform on a per-attempt basis? Previously I’ve utilized such metrics to evaluate quarterbacks (points per passing attempt), wide receivers (points per target, yards per target and adjusted PPA) and running backs (points per touch). These types of metrics serve to level the playing field, so to speak, and provide a true measure of players’ fantasy proficiency.
In regards to that last point about analyzing ball carriers, however, I think we can do better. Points-per-touch is a great metric to gauge a running back’s overall fantasy performance, but it carries with it two inherent drawbacks: reliance upon touchdowns and receptions (assuming a PPR setting). In a fantasy vacuum there’s nothing wrong with including the points derived from scoring and catching the ball, but one has to ask the question – does it really tell you anything about a running back’s skill?
Let’s first consider touchdowns. Sure, there will always be players like Adrian Peterson and Arian Foster who are locks for double-digit scores and most all of the goal-line opportunities. For the rest of the running back population, however, scoring chances are generally more unpredictable. In my opinion, you don’t want to rely on your running back’s fantasy points coming from touchdowns.
Next are receptions, which inject an even more egregious bias into a player’s fantasy stat-line (again, assuming PPR scoring). Catching the ball is a skill, no doubt, but are all receptions created equal? Whether it’s a 60-yard catch-and-run or a quick screen where the player is thrown for a loss, the same one point is added to a player’s fantasy score. This lack of differentiation doesn’t do anything to reflect upon a player’s actual skill.
With that in mind, I wanted a metric to eliminate the factors of chance (touchdowns) and inequitable point distribution (receptions). Simply put, I want to know how good a running back is with the ball in his hand and how that relates to his rate of fantasy scoring. The new “True Points” metric does just that.
The equation to achieve a running back’s True Point total is fairly simple – take his total PPR fantasy points and subtract out the points scored from touchdowns and receptions (note: only the point-per-reception is removed, not the points for receiving yardage). Next, take the resultant total and divide it by a running back’s total touches. The remaining number is the “true” summation of the running back’s rate of scoring.
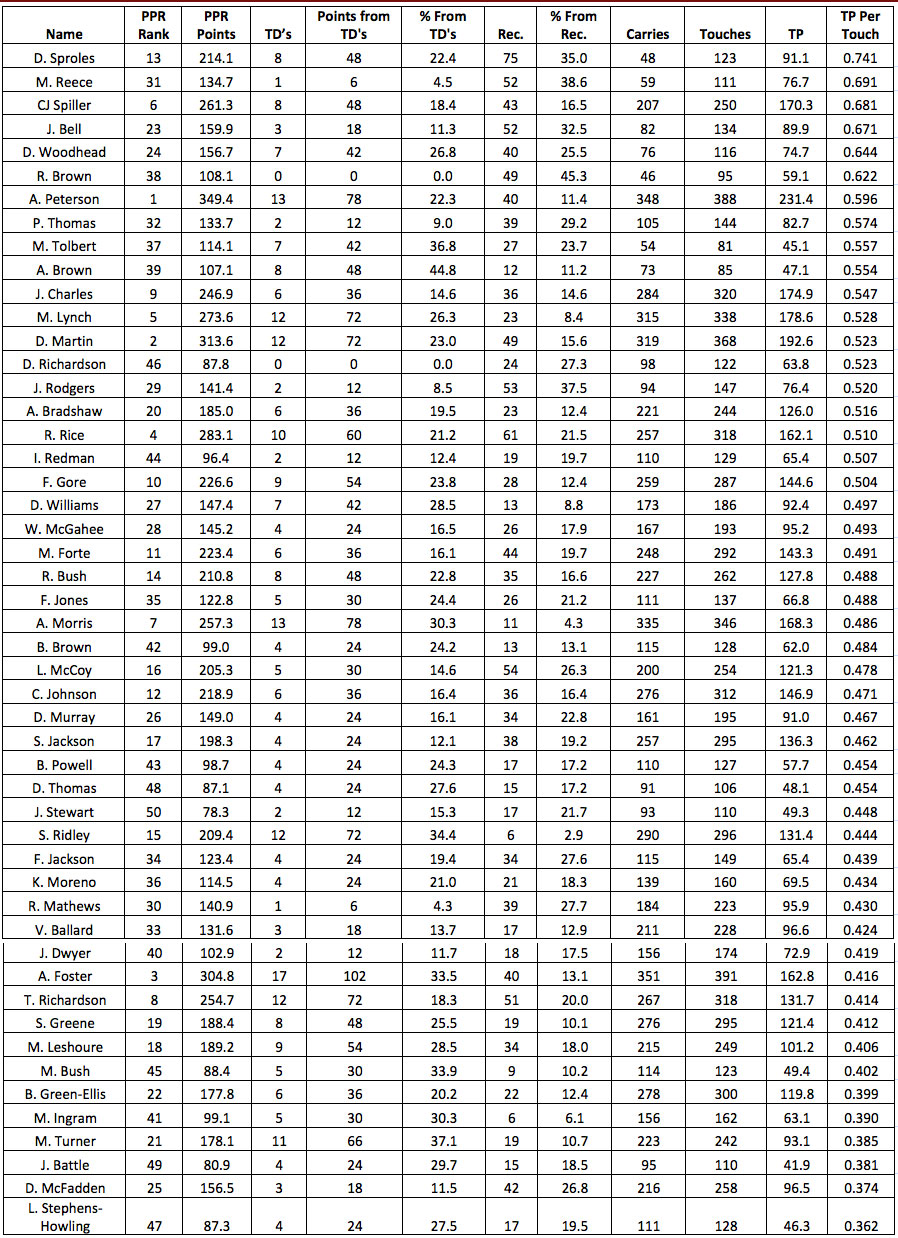
Jumping right into it, I calculated the True Point (TP) per-touch totals for the Top 50 PPR running backs in 2012, and this is shown in the table below in terms of descending values (rightmost column). Also included are each running back’s PPR rank, as well as the percentages of fantasy points each player gained from touchdowns and receptions.
Digging Deeper
It’s not surprising to see several pass-catching running backs towards the top of the list. Even if the point-per-reception is removed, receptions typically generate higher yardage than carries, hence an improved rate of True Point scoring. This begs the next question – is it fair to directly compare the True Point values of someone like Darren Sproles, who only had 123 total touches, to a player like Peterson who had 388? Put differently, shouldn’t a player’s True Point efficiency be compared to those derived from running backs with similar workloads?
In an attempt to further differentiate the top 50 ball carriers with as much totality and finality as possible, I decided to group them into four different categories based on usage. These four groups are as follows: running backs with 300+ touches, running backs with 200 – 299 touches, running backs with 125 – 199 touches and running backs with < 125 touches. Let’s start with the bell cows.
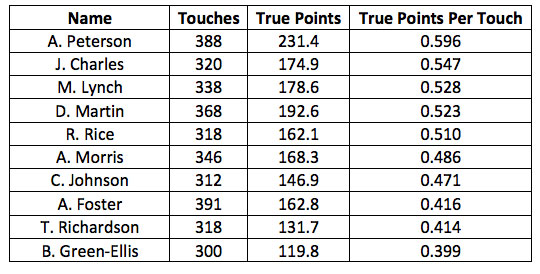
Below is the True Point data for every ball carrier that had at least 300 touches:
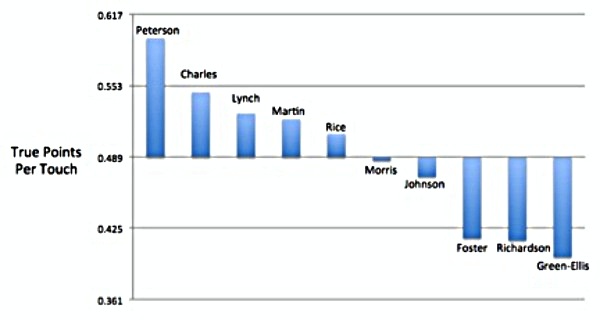
The ten players shown above combined for an average of 0.489 True Points per touch, with a standard deviation of 0.064. As a reminder, standard deviation is defined as a quantity calculated to indicate the extent of variation for a group as a whole. In other words, relatively speaking, how far apart are the numbers from one another?
This is better illustrated in the graph below. Note that the origin is the average True Point per touch value of 0.489, and each tick-mark on the Y-axis denotes an increase or decrease of a single standard deviation, equivalent to 0.064 True Points per touch. In my opinion, this graphical analysis makes it easier to see how well the running backs are doing relative to both the average, as well as one another:
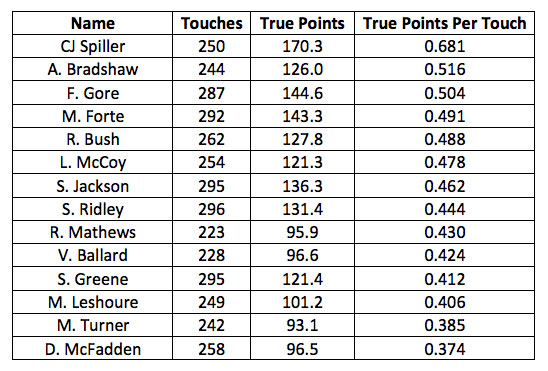
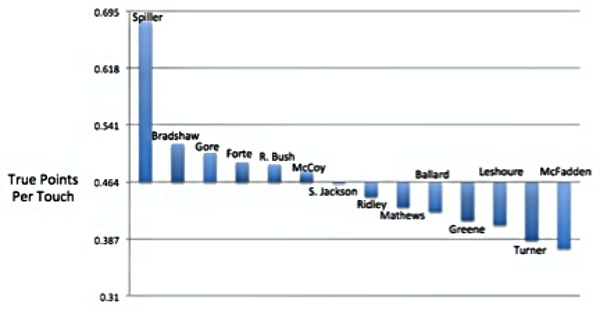
Next, consider the data for the running backs that had between 200 – 299 touches:
The average True Point per touch value for the players above was calculated to be 0.464, with a standard deviation of 0.077. The graphical analysis is shown below:
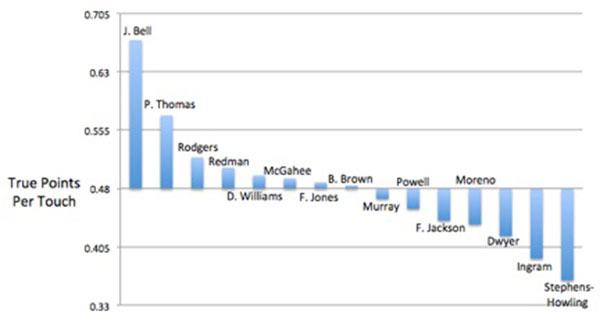
The running backs with 125 – 199 total touches were then considered:
The True Point per touch average for this grouping was found to be 0.480, with a standard deviation of 0.075, and is illustrated graphically below:
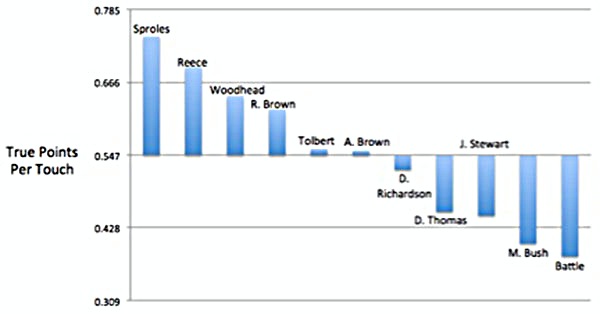
Finally, the data for the ball carriers with fewer than 125 touches is presented below:
The average for this set of players was found to be 0.547 True Points per touch, with a standard deviation of 0.119 – the data is shown pictorially below:
Discussion
The reason I included the standard deviations was because it better helped paint the picture of which running backs were performing divergently better (or worse) than their compatriots within each group. As such, I want to briefly highlight every player who performed at a rate of at least one standard deviation better (or worse) than his group’s average.
Adrian Peterson, MIN – This should come as no surprise, as Peterson set a career best with 6.0 yards per carry. Despite losing the production generated by his 13 touchdowns, AP’s True Point rate was nearly two full standard deviations above the average. Even if you consider all 50 ball carriers, the only running back ahead of Peterson who came even relatively close to his workload was CJ Spiller, with 250 touches. Even if for some crazy reason the touchdowns don’t come, the fantasy points still will.
Jamaal Charles, KC – Okay, this is cheating a little bit as Charles’ True Point average fell just one standard deviation short of being above the average. Nevertheless, I’m including him to prove the point he’s electric with the ball in his hands regardless of touchdowns and receptions. With new head coach Andy Reid in town, expect the latter to stack on top of Charles’ inherent talents, affording a potentially lethal PPR back.
Arian Foster, HOU – The story of Foster’s 2012 season can be summed up in two words: volume and touchdowns. His True Point rate was truly atrocious, which could spell trouble if he winds up being limited by injuries. If I were a Foster owner, I’d quickly become a Foster seller.
Trent Richardson, CLE – Lost in T-Rich’s top-ten PPR finish is the fact he didn’t actually play all that well, relying heavily on touchdowns and receptions. Still young, and now unencumbered by the rib and knee injuries that sapped his effectiveness in 2012, I expect his True Point value to rise this year. However, should he fail to impress yet again, it could be an ominous sign for his long-term value.
BenJarvus Green-Ellis, CIN – It’s no surprise this touchdown-dependent plodder is pulling up the rear. Anything but elusive in the open field, The Law Firm’s time as a fantasy asset is soon coming to an end.
CJ Spiller, BUF – As far as I’m concerned, Spiller’s rate of True Point scoring is the most impressive on the list. His value of 0.681 True Points per touch was third amongst all running backs, and was nearly three full standard deviations above the average in his group! He’s absolutely electric in space, and with an increase workload and potential goal-line duties, Spiller could challenge for the title of highest scoring PPR running back in 2013.
Michael Turner, FA – See Green-Ellis, BenJarvus. It’s not surprising Turner is still a free agent.
Darren McFadden, OAK – In his worst season as a pro, McFadden’s True Point value was dead last amongst players in his group. With a dearth of talent in the Black Hole, a schematic shift back to the power run game still might not cure what ails him. Owners should brace for another down year and pray that Run-DMC finds a new team come 2014.
Joique Bell, DET – During his limited time on the field last year, Bell ran circles around fellow Lion Mikel Leshoure en route to being the most efficient ball carrier in his group, with a True Point value over two standard deviations above the average. Even with Reggie Bush in town, Bell has proven he can make the most of his opportunities. Should Bush go down, we could be looking at an under-the-radar, high-end RB2.
Pierre Thomas, NO – Seemingly the forgotten man in his backfield, Thomas just keeps churning out both yards and fantasy points at a high rate. If he can stave off the largely unimpressive Mark Ingram, Thomas should offer FLEX value at a minimal cost.
Jonathan Dwyer and LaRod Stephens-Howling, PIT – Though someone needs to replace the recently injured Le’Veon Bell, neither Dwyer nor LSH can be counted upon to do the job, as both compiled True Point totals about a standard deviation below their group’s average. Hopefully, you can do better.
Mark Ingram, NO – To put it succinctly, he’s fast approaching “bust” status. Easily the least efficient member of his backfield committee, Ingram’s True Point value falls near the bottom of his group. Once again, I’m refusing to buy the off-season hype – if he’s kept out of the end zone, he’s nearly useless in your lineup.
Darren Sproles, NO – This brings us to the last member of the Saints’ backfield. Despite being 30 years old, Sproles remains entrenched as a fixture in the New Orleans passing game. As such, he’s more than likely to perform better on a per-touch basis, and that’s exactly what happened. Sure, he only touched the ball 123 times, but Sproles led the entire study in his rate of scoring True Points. As long as he’s in the Big Easy, Sproles will continue to churn out points at a high rate.
Marcel Reece, OAK – Many will likely be surprised at Reece’s inclusion on this list, but his rate of scoring True Points was over a full standard deviation above his peers. If McFadden goes down again, Reece could be a sneaky bet to yet again pick up the slack.
Michael Bush, CHI and Jackie Battle, TEN – If they’re not scoring, they’re not producing.
Everyone Else – I didn’t write about all 50 ball carriers, so make sure to check out how they fared, both “on an island” and relative to their group-mates.
Conclusion
Though I’m well aware advanced metrics aren’t for everyone, I firmly believe fantasy football can ultimately boil down to finding every subtle advantage possible. As such, I find it beneficial to dig deeper than what’s on the statistical surface of whatever fantasy-relevant questions we might have. When it comes to gauging how well our running backs are performing, I’m of the opinion that we need to delve even deeper yet.
With very few exceptions, it’s challenging to predict the likelihood of replicability when it comes to statistics such as touchdowns and receptions. Because of that, we don’t want them to artificially adulterate the numbers we use, thereby distorting our viewpoints. As such, it’s important to know if the running backs on our rosters have the ability to stay afloat even if the worst-case scenarios arise.
The new True Points metric achieves this goal. In my opinion, it’s the best way to determine a ball carrier’s viability based solely on what he does when in possession of the ball, not on any type of “fluke factor.” Moreover, when used to differentiate between players with similar workloads, it’s an excellent way to achieve a basis of comparison, subsequently helping to guide our personnel choices. After all, without an unbiased means of evaluation, how can you be expected to be “true” to your team?
Follow me on Twitter @EDH_27
- Dynasty Fantasy Football Mailbag: Jordan Love and Jordan Addison - April 22, 2025
- Forgotten Dynasty Veterans: Bottom Tier - April 21, 2025
- Dynasty Fantasy Football Mailbag: Malik Nabers and Isiah Pacheco - April 15, 2025


