They Might Be Giants
Editor’s Note: As you may already know, DLF provides a Premium Content package to assist you in further dominating your leagues. This article is an example of what you get with our content package and is provided as a special sneak preview. To sign up for Premium Content Package and get access to over 450 exclusive articles and a whole host of tools, just click here.
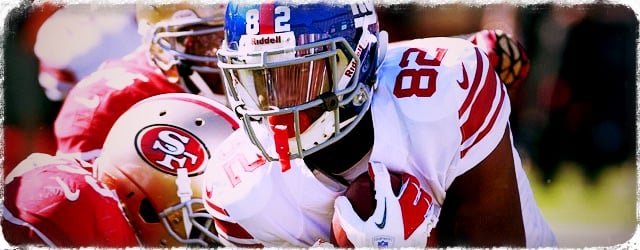
Don’t let the title fool you; the intent of this article is neither to cover the merits of 90’s alternative rock, nor to debate the naming controversy of Istanbul versus Constantinople. The initial premise was to stake my claim for the Giants’ Rueben Randle as fantasy’s next breakout receiver, but as tends to happen with these types of analyses, things soon snowballed. This once straightforward piece on the former LSU Tiger soon became an examination of the relevant majority (see below for explanation) of the 2012 rookie wide receivers. In short, the goal shifted from an individual spotlight to a large-scale assessment of the feasibility of utilizing past precedent to predict the futures of the 2012 class, using literally as much statistical data as possible. For the data used, just click here.
Put another way, I wanted to consider a highly inclusive set of prior rookie receiver figures and trend-spot to determine the qualities possessed by different tiers of pass catchers. Did the elite receivers do something different in their year-one campaigns to separate them from the pack, and so on down the fantasy food chain? Were there signs that certain players were destined for stardom (or in other cases, infamy) after just one season? Can we establish a player’s trajectory based solely off one year of data? To answer these questions, I used a robust set of advanced measures, notably utilizing by my personal thematic preference – efficiency.
As I’ve stated before, I believe efficiency metrics are the best way to remove players from the individual pedestals thrust under them by the differing scopes of their respective offenses. By breaking the numbers down into universal units, a degree of uniformity can be achieved, thereby removing the shackles in which raw numbers attempt to place us. Already, I’ve used this logic to differentiate quarterback play in 2012, as well as state my cases for both the Chiefs’ Dwayne Bowe and the Panthers’ Jonathan Stewart.
The three efficiency metrics I used for this study are as follows:
1. Fantasy Points Per Target (PPT) – In essence, this statistic shows how a receiver’s combination of receptions, receiving yards and touchdowns translated to fantasy score sheets. When the aggregate of a player’s fantasy output is divided by the number of targets he received, it shows the true measure of how effective he was on a per attempt basis.
2. Yards Per Target (Yards/Target) – I wanted a way to gauge both pass-catching efficiency, as well as the figurative degree of difficulty in completing the reception. Yards per target can be utilized to do just that, as the calculated value directly correlates to both the “catch percentage” and “yards per catch” statistics. Basically, this metric answers the question, “How good is a receiver at catching the football?”
3. Percent Change to the Quarterback’s Points Per Attempt (% Change PPA) – I introduced the concept of PPA in the 2012 quarterback efficiency rankings linked above. This metric describes how many fantasy points a signal caller scores per attempt (fantasy points from passing divided by pass attempts), but this number can effectively be applied to pass catchers as well. If we calculate a quarterback’s PPA when he targets just one receiver, we can see if the player in question helps or hurts the quarterback’s overall numbers. In other words, does the receiver bring out the best or worst in his signal caller? Even if poor quarterback play hampers the PPT and yards/target metrics, “% change PPA” still stands as an effective relative barometer.
With the methodology in place, I needed a viable data set large enough to paint a broad picture and also account for potential outliers. The numbers needed to fit the following criteria:
1. The player data used came only from the wide receiver position.
2. The data was only from each player’s rookie season.
3. The data came from the timeframe of 2006 through 2011. Since the “target” statistic wasn’t used prior to 2006, determining values for the efficiency metrics proved unattainable for earlier seasons. Last year’s numbers weren’t pooled with the general data population, as they related to the players in question.
4. The data utilized came from players who had at least 30 targets in their rookie seasons. Accounting for the potential of a missed game, this would lead to an average of two targets per game, which is enough to determine a trend. Smaller sample sizes show larger degrees of variability, and were subsequently dismissed.
The metrics were then calculated for players meeting each of the above conditions, and that data is shown below.
Rookie Receiver Data 2006 – 2011
The players were grouped into four categories: WR1, WR2, WR3 and “other.” These designations arose from the receivers’ ratings as they relate to some combination of proven ability, potential and ADP. In other words, if a player has shown he can function as a WR1, is drafted as a WR1 or has shown the potential to be a WR1, he’s labeled, shockingly, as a WR1, and so on down the list. The vast majority of these cases are cut and dry, with very few liberties taken (ex. Kenny Britt, who was well on his way to an elite season in 2011 before an ACL injury – this potential alone earned him WR1 status).
Let’s start with the data for the WR1’s. Individual values are shown for each player, and the averages are calculated at the bottom of each column:
|
Name |
Year |
PPT |
Yards/Target |
% Change PPA |
|
Marques Colston |
2006 |
1.93 |
9.0 |
28.1 |
|
Greg Jennings |
2006 |
1.20 |
6.0 |
0.0 |
|
Brandon Marshall |
2006 |
1.70 |
8.4 |
31.3 |
|
Dwayne Bowe |
2007 |
1.71 |
8.5 |
50.0 |
|
Calvin Johnson |
2007 |
1.55 |
8.0 |
23.9 |
|
Sidney Rice |
2007 |
1.78 |
7.5 |
58.1 |
|
Jordy Nelson |
2008 |
1.70 |
7.6 |
-1.8 |
|
Percy Harvin |
2009 |
1.92 |
8.7 |
7.7 |
|
Michael Crabtree |
2009 |
1.42 |
7.3 |
-6.1 |
|
Hakeem Nicks |
2009 |
2.20 |
10.7 |
43.3 |
|
Kenny Britt |
2009 |
1.73 |
9.3 |
37.0 |
|
Mike Wallace |
2009 |
2.16 |
10.5 |
38.7 |
|
Dez Bryant |
2010 |
1.90 |
7.8 |
26.3 |
|
Demaryius Thomas |
2010 |
1.60 |
7.3 |
5.6 |
|
AJ Green |
2011 |
1.90 |
9.2 |
42.9 |
|
Julio Jones |
2011 |
2.16 |
10.2 |
51.8 |
|
Randall Cobb |
2011 |
2.23 |
12.1 |
-13.1 |
|
Average |
– |
1.81 |
8.7 |
24.9 |
*Standard WCOFF PPR scoring is used for the entirety of this analysis
Next up are the WR2-caliber players:
|
Name |
PPT |
Yards/Target |
% Change PPA |
|
Santonio Holmes |
1.69 |
9.7 |
9.4 |
|
James Jones |
1.58 |
8.5 |
-10.3 |
|
Laurent Robinson |
1.28 |
6.4 |
-11.6 |
|
Eddie Royal |
1.70 |
7.6 |
1.9 |
|
DeSean Jackson |
1.37 |
7.5 |
-6.4 |
|
Austin Collie |
1.89 |
7.5 |
15.0 |
|
Jeremy Maclin |
1.72 |
8.6 |
3.4 |
|
Brian Hartline |
1.94 |
9.0 |
59.5 |
|
Mike Williams |
1.76 |
7.5 |
26.3 |
|
Danario Alexander |
1.53 |
8.3 |
-21.2 |
|
Denarius Moore |
1.90 |
8.1 |
26.4 |
|
Torrey Smith |
1.89 |
8.9 |
54.2 |
|
Average |
1.69 |
8.1 |
12.1 |
Below is the data for the WR3 group:
|
Name |
PPT |
Yards/Target |
% Change PPA |
|
Anthony Gonzalez |
2.17 |
11.1 |
30.0 |
|
Davone Bess |
1.54 |
7.4 |
-20.8 |
|
Donnie Avery |
1.33 |
6.5 |
18.9 |
|
Harry Douglas |
1.69 |
8.9 |
5.7 |
|
Mike Thomas |
1.74 |
7.3 |
-6.5 |
|
Johnny Knox |
1.60 |
6.6 |
11.5 |
|
Jordan Shipley |
1.76 |
8.1 |
11.5 |
|
Emmanuel Sanders |
1.55 |
7.5 |
-5.3 |
|
Jacoby Ford |
2.06 |
8.7 |
7.4 |
|
Andre Roberts |
1.36 |
6.3 |
33.3 |
|
Greg Little |
1.21 |
5.9 |
-10.0 |
|
Doug Baldwin |
1.80 |
9.3 |
44.4 |
|
Jeremy Kerley |
1.47 |
6.7 |
-17.6 |
|
Vincent Brown |
1.60 |
8.2 |
5.2 |
|
Darrius Heyward-Bey |
0.73 |
3.1 |
-31.6 |
|
Average |
1.57 |
7.4 |
5.1 |
Finally, here are the “Other Guys,” sans Mark Wahlberg and Will Ferrell:
|
Name |
PPT |
Yards/Target |
% Change PPA |
|
Derek Hagan |
1.33 |
6.0 |
5.1 |
|
Ted Ginn |
1.24 |
5.9 |
13.9 |
|
Craig Davis |
1.32 |
5.5 |
-23.5 |
|
Josh Morgan |
1.63 |
7.4 |
30.0 |
|
Chaz Schilens |
1.55 |
7.1 |
50.0 |
|
Julian Edelman |
1.47 |
6.6 |
-28.1 |
|
Brandon Gibson |
1.08 |
5.0 |
-11.4 |
|
Mohammed Massaquoi |
1.20 |
6.6 |
28.6 |
|
Brandon LaFell |
1.26 |
6.1 |
2.9 |
|
David Gettis |
1.58 |
7.6 |
60.0 |
|
Blair White |
1.78 |
6.2 |
17.9 |
|
Arrelious Benn |
2.11 |
10.4 |
28.1 |
|
Dexter McCluster |
1.41 |
5.4 |
-33.9 |
|
Golden Tate |
1.13 |
5.8 |
-32.6 |
|
Titus Young |
1.72 |
7.1 |
1.6 |
|
Jon Baldwin |
1.01 |
4.9 |
-25.6 |
|
Average |
1.43 |
6.5 |
5.2 |
Discussion
Summarized, the numbers are as follows:
|
|
PPT |
Yards/Target |
% Change PPA |
|
WR1 |
1.81 |
8.7 |
24.9 |
|
WR2 |
1.69 |
8.1 |
12.1 |
|
WR3 |
1.57 |
7.4 |
5.1 |
|
Other |
1.43 |
6.5 |
5.2 |
Frankly, the results are staggering. On average, players who eventually rise to WR1-status do show flashes of greatness during their rookie seasons. Their PPT and yards/target averages are 7% greater than that of the WR2 tier, and the percent change in PPA is a whopping 50% greater. To me, that’s the key point.
Players such as Brandon Marshall, Dwayne Bowe, Calvin Johnson, Sidney Rice and Kenny Britt fell below the WR1 averages for PPT and yards/target, but consider how much better they made their subpar quarterbacks look. In fact, only three players led to a decrease in efficiency from their signal callers – Jordy Nelson, Michael Crabtree and Randall Cobb. Nelson wasn’t far off the pace set by Packers’ quarterback Aaron Rodgers, Crabtree famously held out of all of training camp (and a decent portion of the regular season) and Cobb was, at least partially, a “victim” of an MVP-caliber aerial assault from Rodgers, once again. All told, on average the 17 WR1-level receivers made their quarterbacks 25% more efficient.
Moving down the list, the WR2 tier, not shockingly, had the next highest values for all three metrics. Their ceilings were definitively lower in regards to both PPT and yards/target, and there was a greater variance in how they affected their quarterbacks’ PPA values. On the whole, this group impacted their signal callers in a positive manner, but not nearly the level of the elite.
Both the WR3 and “other” groups fell even further, ranging from barely start-able to bench fodder. It’s not surprising to see several high profile busts in the final group, including Ted Ginn, Josh Morgan, Brandon LaFell, Titus Young and Jon Baldwin. Once again, fantasy appears to align with reality, even dating back to the receivers’ inception in the league.
The 2012 Class
With these distinctions in hand, we can now apply the data to the class of 2012. Below are the efficiency values for last season’s rookie crop, as well as which “level” each metric falls at. The average of the three metrics will lead to a future tier designation, shown in the rightmost “Conclusion” column:
|
Name |
PPT |
Level |
Yards/Target |
Level |
% Change PPA |
Level |
Conclusion |
|
TY Hilton |
2.01 |
WR1 |
9.6 |
WR1 |
58.0 |
WR1 |
WR1 |
|
Ryan Broyles |
2.03 |
WR1 |
9.7 |
WR1 |
55.3 |
WR1 |
WR1 |
|
Rueben Randle |
2.09 |
WR1 |
9.3 |
WR1 |
50.0 |
WR1 |
WR1 |
|
Jarius Wright |
1.84 |
WR1 |
8.6 |
WR1 |
44.4 |
WR1 |
WR1 |
|
Josh Gordon |
1.74 |
WR2 |
8.8 |
WR1 |
47.7 |
WR1 |
WR1 |
|
Chris Givens |
1.64 |
WR3 |
8.7 |
WR1 |
20.4 |
WR1 |
WR2 |
|
Alshon Jeffery |
1.64 |
WR3 |
7.6 |
WR3 |
23.5 |
WR1 |
WR2 |
|
Rod Streater |
1.56 |
WR3 |
7.9 |
WR2 |
14.3 |
WR2 |
WR2 |
|
Michael Floyd |
1.32 |
Other |
6.5 |
Other |
20.0 |
WR1 |
WR3 |
|
Stephen Hill |
1.37 |
Other |
5.4 |
Other |
20.9 |
WR1 |
WR3 |
|
Justin Blackmon |
1.38 |
Other |
6.6 |
Other |
4.3 |
WR3 |
Other |
|
Marvin Jones |
1.53 |
WR3 |
6.3 |
Other |
-20.0 |
Other |
Other |
|
Kendall Wright |
1.45 |
Other |
6.0 |
Other |
-2.2 |
Other |
Other |
|
TJ Graham |
1.20 |
Other |
5.6 |
Other |
-32.7 |
Other |
Other |
|
Juron Criner |
1.12 |
Other |
4.6 |
Other |
-28.6 |
Other |
Other |
Five players clearly led the pack – TY Hilton, Ryan Broyles, Rueben Randle, Jarius Wright and Josh Gordon. Each displayed high-end numbers for all three metrics, and averaged to make their signal callers look a whopping 51% more efficient. Their PPT and yards/target results are especially impressive given that the Colts, Lions, Giants, Vikings and Browns all exhibited relatively underwhelming quarterback play.
The WR2 tier contains a trio of efficient, under the radar prospects in Chris Givens, Alshon Jeffery and Rod Streater. Save for PPT, Givens actually displayed WR1-caliber metrics, operating as the Rams’ top receiving threat – locked into a starting role on the outside, he’s a smart bet for continued production even despite the additions of Tavon Austin and Jared Cook. Jeffery and Streater also both showed flashes despite mediocre quarterback play, albeit in a smaller sample size for the Bears’ rookie.
The real surprises fell towards the bottom of the list. Even though Stephen Hill possesses the type of size/speed combo that makes NFL executives drool, his yards/target and PPT were some of the worst in the group. Michael Floyd slides in as a potential WR3, but he at least finished the season strong and brought out the best in the quagmire that was Arizona’s quarterback play. When it comes to the other two first round picks, however, they have some explaining to do.
Despite a heavy volume season, the Jaguars’ Justin Blackmon exhibited subpar play across the statistical landscape. His PPT and yards/target values are reminiscent of the “other guys,” but more importantly, he failed to make his quarterbacks any better. It’s true that the combination of Blaine Gabbert and Chad Henne failed to impress (to put it mildly), but Blackmon didn’t help them. According to the numbers, he’s a highly overrated prospect, despite being a top-five selection in the 2012 draft.
Similarly, Kendall Wright actually made his Tennessee signal callers look worse (yes, it’s possible). His negative value for “% change in PPA” was the fourth lowest of the group, and his PPT and yards/target also left much to be desired. For a player who averaged 15.4 yards per catch during his senior season at Baylor, it’s especially disappointing that he couldn’t translate that success into his rookie year.
Rounding out the group of bottom dwellers are Marvin Jones, TJ Graham and Juron Criner. None showed any kind of extraordinary talent in 2012, and they all face uphill battles for fantasy relevance. If you’re on the fence with your roster cuts, these could be the guys with whom you cut bait.
Lingering Questions
1. Is the sample size a problem?
While I still believe 30 or more targets is enough data for inclusion in this study, only eight of the 15 2012 rookies had more than 50 targets. Digging deeper, three of the five players in the 2012 WR1 tier (Randle, Broyles and Wright) each had only between 32 and 36 attempts. This contrasts with the prior WR1 data, where every player save for Randall Cobb, Jordy Nelson and Demaryius Thomas had at least 50 targets in their respective rookie seasons. Regardless, the above 2012 rookies’ numbers remain sublime.
2. Should a player’s role on his team matter?
With the exception of Blackmon and Kendall Wright, none of the 2012 rookies functioned as their teams’ top threats. Is there an advantage to be gained from seeing less defensive focus? To counter this point, the only prior player in the WR1 tier who acted as his team’s target leader was AJ Green. This appears to be a non-issue.
3. Is there a bias towards players who score more touchdowns?
Simply put, no. Only five players saw more than 25% of their fantasy points come from touchdowns – Sidney Rice, Josh Morgan, Mike Williams, Blair White and Rueben Randle. No player had any type of aberrational touchdown-scoring prowess, thereby skewing the data.
4. What about the players who didn’t fit the criteria?
In order to eliminate variability due to small sample size, players with little rookie involvement were not included in the study. However, there are always players (i.e. Eric Decker, Stevie Johnson, Cecil Shorts III, etc.) who seemingly come out of nowhere to make a big fantasy impact. Some receivers are just more unpredictable than others – that’s the nature of the NFL beast.
5. What the heck happened to Arrelious Benn?
Just look at the guy’s numbers. Though he’s popularly viewed as a bust, he could be a sneaky end-of-bench type on deep rosters. Now fully healthy, you could do worse in terms of fliers than the former second round pick.
Conclusion
From 2006 through 2011, 60 rookie wide receivers were chronicled and their statistics were analyzed in terms of three key efficiency metrics. When the results were averaged, trends were noted in regards to how their respective careers ultimately diverged. On average, players who eventually fit the WR1-tier exhibited better numbers in terms of PPT, yards/target and “% change in PPA” than players in lower tiers, and so on down the list. The combinatorial efforts provided by the sum of the data appear to effectively serve as a predictor for future rookies.
When the averages were applied to the 2012 rookie receivers, it was observed that TY Hilton, Ryan Broyles, Josh Gordon, Jarius Wright and Rueben Randle appear to be on track for high-level production in the future. Conversely, “household” names such as Michael Floyd, Justin Blackmon and Kendall Wright seem to be overvalued by dynasty footballers, failing to show efficiency reminiscent of fantasy’s elite. This likely comes as a surprise, especially given their respective draft statuses.
Though no predictive measure can ever really be written in stone, trend spotting is of vital importance to dynasty owners. Numbers alone have their limitations, but when a large enough sample size is applied, the risk of blind statistical adherence is lessened. Given the scope of the criteria and results above, I firmly believe there’s more than enough evidence here to help identify fantasy’s future receiving “giants.”
[ad1]
Follow me on Twitter @EDH_27
- Dynasty Fantasy Football Mailbag: Justin Jefferson Or A Bundle Of Draft Picks? - April 23, 2024
- Dynasty Fantasy Football Mailbag: Is Kendre Miller Valued Unfairly? - April 17, 2024
- Forgotten Dynasty Veterans: Bottom Tier - April 9, 2024


