Dynasty GAAP Memo: 2024 Free Agent Running Backs and the Christian Kirk Model

If you’ve read my work before, you know I write in the form of “accounting memos”. For anyone who has not been exposed, the format is very standard. Each memo will start with the “purpose”. Next, it will outline the applicable “guidance” or accounting literature utilized and supply background. Last will be the analysis and conclusion. The goal is to state the issue and quickly address it. My write-ups will follow this same logic. To summarize, welcome to “Good at Analyzing Players” or “GAAP,” a play on “Generally Accepted Accounting Principles.”
Purpose
To evaluate free pending 2024 free agent running backs utilizing the ‘Christian Kirk Model’.
Background
During the 2021 off-season, Christian Kirk was awarded one of the most lucrative wide receiver contracts in NFL history. After being selected in the second round of the 2018 NFL Draft, Kirk had just come off his rookie contract with the Cardinals and had amassed 77 catches for 982 yards and five touchdowns in his last year before hitting free agency. While this certainly merited a raise from his rookie contract, the amount of the contract was shocking and left a lot of people around the NFL scratching their heads.
At the time of signing, Kirk’s four-year, $72M contract (with incentives up to $84M) put him as the third highest paid WR in the NFL – not bad for a receiver who had never eclipsed 1,000 yards. This contract had impacts across the NFL and is often credited for the explosion we have seen recently with WR contracts.
Two years into his contract, Kirk has lived up to its value. In 2022, he finished as the fantasy WR11 in PPR leagues with 84 catches, 1,108 yards, and 8 TDs. In 2023, he was again on pace to finish as a top 24 PPR WR with over 1,100 yards before his injury in week 13. As we approach free agency, Kirk is a good reminder. Often teams in free agency swing and miss. However, if you follow the funds (or contracts), teams will tell you what they are trying to do, and you can potentially identify buying opportunities. If consensus is mocking a team overpaying a player, you might send a few offers as the media (and dynasty managers) overact.
This week’s memo will dive into this theory, which I have coined the “Christian Kirk Model”, and project it upon the free agency running backs. A follow-up memo will then consider the wide receiver group.
Resources:
- Sleeper: Great interface for looking up historical statistics
- DLF Dynasty Rankings: Best dynasty rankings in the industry
- DLF Average Draft Position (“ADP”) Data: Best resource to gauge current player value. Based on real dynasty startups.
Analysis
In accounting, some financial assets are difficult to value. Businesses often must establish fair values for the assets that they carry on their books. Due to this, the Financial Accounting Standards Board (governing body of accounting) has derived “asset levels.” The intent of these levels is to define the requirements for fair value measurements. Each level has different requirements. See each level defined below discussed below:
- Level 1 Assets – liquid financial assets and liabilities, such as stocks or bonds, that experience regular market pricing. For instance, stock prices are readily available via the stock market.
- Level 2 Assets – financial assets and liabilities that do not have regular market pricing. Level 2 assets must be valued using market data obtained from external, independent sources. The data used can include quoted prices for similar assets and liabilities in active markets, prices for identical or similar assets and liabilities in inactive markets, or models with observable inputs. These include default rates, interest rates, and yield curves.
- Level 3 Assets – financial assets and liabilities considered to be the most illiquid and hardest to value. They are not traded frequently, so it is difficult to give them a reliable and accurate market price. Examples of Level 3 assets include mortgage-backed securities (MBS), private equity shares, complex derivatives, foreign stocks, and distressed debt.
In dynasty, a player’s value is predicated on asset types from all three levels. Elements like past production and age would be considered ‘level 1’ assets. These elements are readily available and observable. We also leverage rankings and trade calculators to quantify a player’s value. These come from industry sites like DLF and would be considered a ‘level 2’ asset. Finally. level three assets are what introduce the “Christian Kirk Model” mentioned above.
Spotrac is a great website that I utilize all the time to look up contract details. However, for select players, the site derives a fair market value for pending free agents. This model is based on the player’s historical production, age, and other inputs (Games Played %, Rushing Yards, Rushing Touchdowns, Receptions, etc.) These factors are input into a linear regression model along with statistical comparisons to derive a fair market value for the player along with contract length. Pretty neat! This is a notable example of how to value a “level 3” asset.
This memo will evaluate pending free agent running backs utilizing this concept.
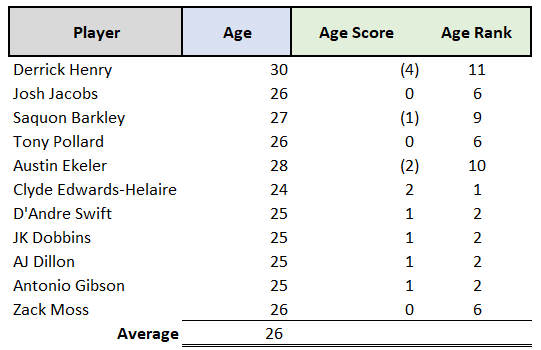
Level 1 Asset: Age
The table below takes the sample population, calculates the average, and then compares the player’s age to the calculated average and ranks them. For instance, Derrick Henry is 30, which is four years older than the 26-year-old average. This would rank him as last in the population considered.
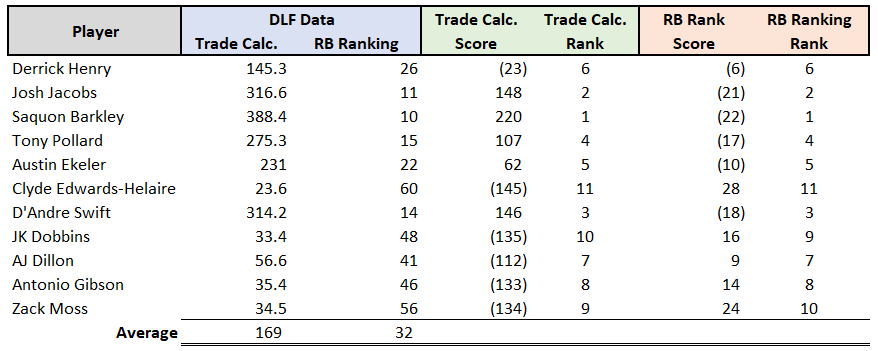
Level 2 Asset: DLF RB Rank and Trade Calculator Value
Similar to the table above, this table calculates the average DLF RB rank as well as the Trade calculator value. This is then compared against the average and ranked.
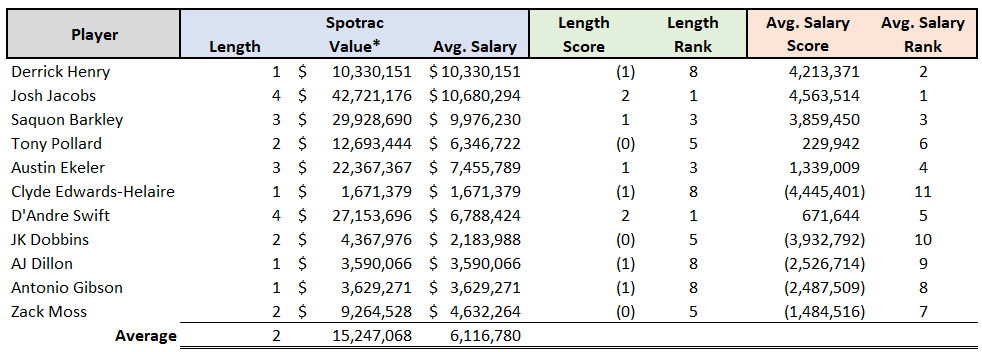
Level 3 Asset: Forecasted Spotrac Average Salary and Projected Contract Length
This table considers the projected average salary for each player as well as the contract length, and compares it to the average and ranks accordingly. The thought here is that a bigger salary and longer contract could be indicative of a team’s confidence in the player, similar to Kirk in 2021.
Conclusion
The table below aggregates the rankings from the level 1, level 2, and level 3 asset rankings above to derive the completed model. As a reminder, these are ranks so, lower is better.
I laid out a few observations below:
- Level 1 (Age) – Antonio Gibson actually pops off the page here. He is still only 25 years old and is tied for the second youngest in the population. He has elite advanced metrics with a 99th percentile speed score to go along with two RB1 finishes and pass-catching chops. I bet he could be had for a third in most leagues.
- Level 2 (Trade Calculator and RB Ranking per DLF) – The name that pops out as a buy is D’Andre Swift. His overall score is the second lowest (i.e., second best) but has the third highest value per DLF. If I could pivot off Josh Jacobs or Saquon Barkley for Swift-plus, I would. He is also tied for second youngest in the population under his level 1 assessment.
- Level 3 (Spotrac Avg. Salary and Contract Length) – For average salary, I am buying Derrick Henry. I know some people believe he slowed in 2023. However, I think his massive frame will allow him to perform well into his 30s. If I were a contender, I would happily send a mid/late second for him. Regarding the contract length, Swift and Jacobs project for the longest contracts. Meaning, Spotrac forecasts the NFL to see them as more long-term starters. As I have discussed before, I do pursue stability, especially in the RB room.
The model above is to serve as a reminder that contract length and salary should affect a player’s dynasty value. I always love free agency because we get to not only see where our favorite players will be playing, but also how the NFL market values them.
“If [trading up for Josh Allen] didn’t work out, I wouldn’t be here anyway. If it does work out, then who gives a (bleep)?”
- Dynasty GAAP Memo: Running Back Maturity Approach and Second-Year RBs - February 20, 2025
- Dynasty GAAP Memo: Post-Mortem Rookie Re-Draft - December 12, 2024
- Dynasty GAAP Memo: Buying The WR Dip Or Falling Knife? - November 14, 2024


