Truth About Running Backs: NFC North
This is the next in a series of articles that attempt to shine a light on how various teams really do use their backs and what we can surmise about them going forward. Today we focus on the NFC South.
The division was a bit of a scuffle last season as two teams went to the playoffs and the others both had their days in the sun. Let’s see which of the four teams were impressive on the ground.
Chicago Bears
The Bears, under Matt Nagy, have had probably the most starkly defined backfield for the past two seasons. The first chart shows their overall usage by down and play type for 2018 and 2019:

This is uncannily similar. Aside from fourth down (a tiny number of plays), you can clearly see that the two seasons were extremely similar in the volume and distribution that both backs received.
The Bears have fielded a dedicated receiving back in Tarik Cohen and a dedicated rushing back in Jordan Howard and now David Montgomery for two seasons straight under coach Nagy.
The next chart shows their carry/targets split for 2019:
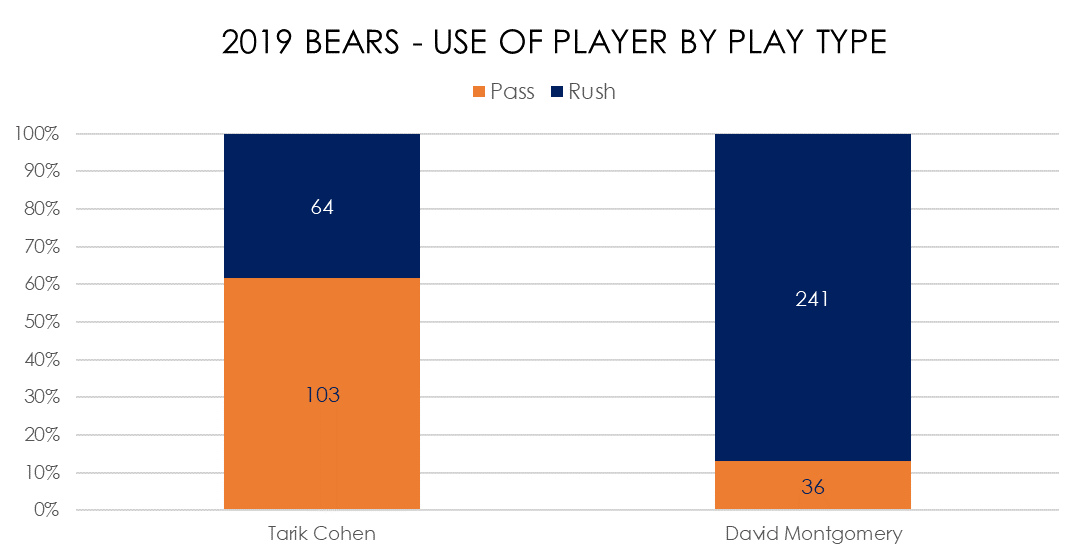
Clearly Tarik Cohen is used more as a receiver and David Montgomery has slid into the early-down rushing back role that Jordan Howard filled. Some people thought that the fact the Bears drafted Montgomery relatively early meant they planned to use him as a featured back. This appears to be nonsense. Yet more evidence that NFL coaches use backs in set roles rather than acquire talent and build their offense around it.
Detroit Lions
A year ago, Kerryon Johnson was a hot topic. Many commentators thought he was about to walk into a bell-cow role. Because he was hurt and missed much of the season this belief has not been totally dispelled. But rest assured it is not true. Matt Patricia is very much a disciple of Bill Belichick (not to mention much of the rest of the Lions’ brain trust) and has behaved accordingly so far. The first chart shows usage by down in 2019:
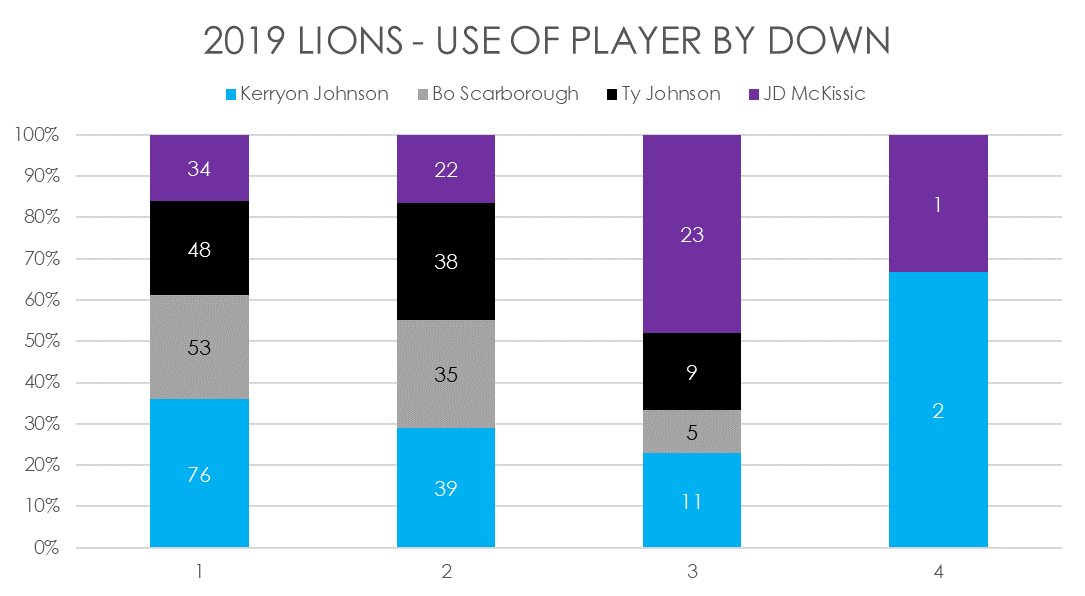
This seems fairly confusing as four backs played significant amounts of time. But look a little closer and the truth starts to appear. As you would expect from a Patriots-inspired offense, there is a clear early-down rusher role on this team. It’s just that it was shared across players. Kerryon Johnson, Bo Scarborough and Ty Johnson all owned the role at times in the season with J.D. McKissic the main third-down/receiving back.
This only shows half the story though. The next chart shows the carry/target split for all four backs:
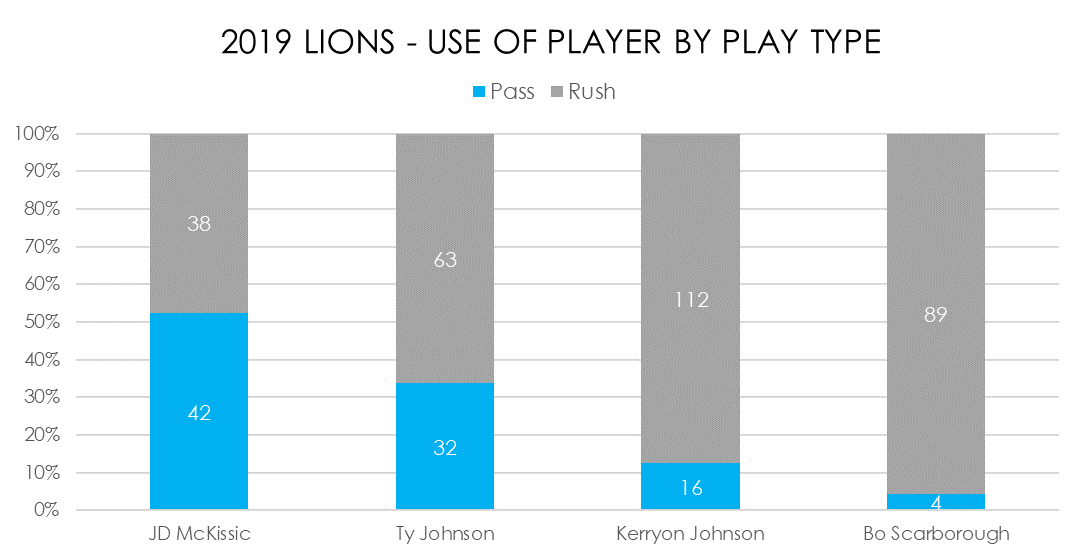
As you would expect, McKissic had a relatively even split (he played the James White role last season) while Kerryon Johnson and Bo Scarborough were very heavily slanted towards rushing. Ty Johnson was in the middle and filled something close to Rex Burkhead’s role in New England.
Johnson is a talented young player but his role as a Lion seems to be very similar to Sony Michel’s.
Green Bay Packers
No Packers running back conversation gets far beyond Aaron Jones at the moment. He had a spectacular season and his touchdown scoring, in particular, was hugely impressive. But as many have pointed out, we should expect a drop in 2020 production. The first chart shows the overall carry/target split by week for the team for the year:
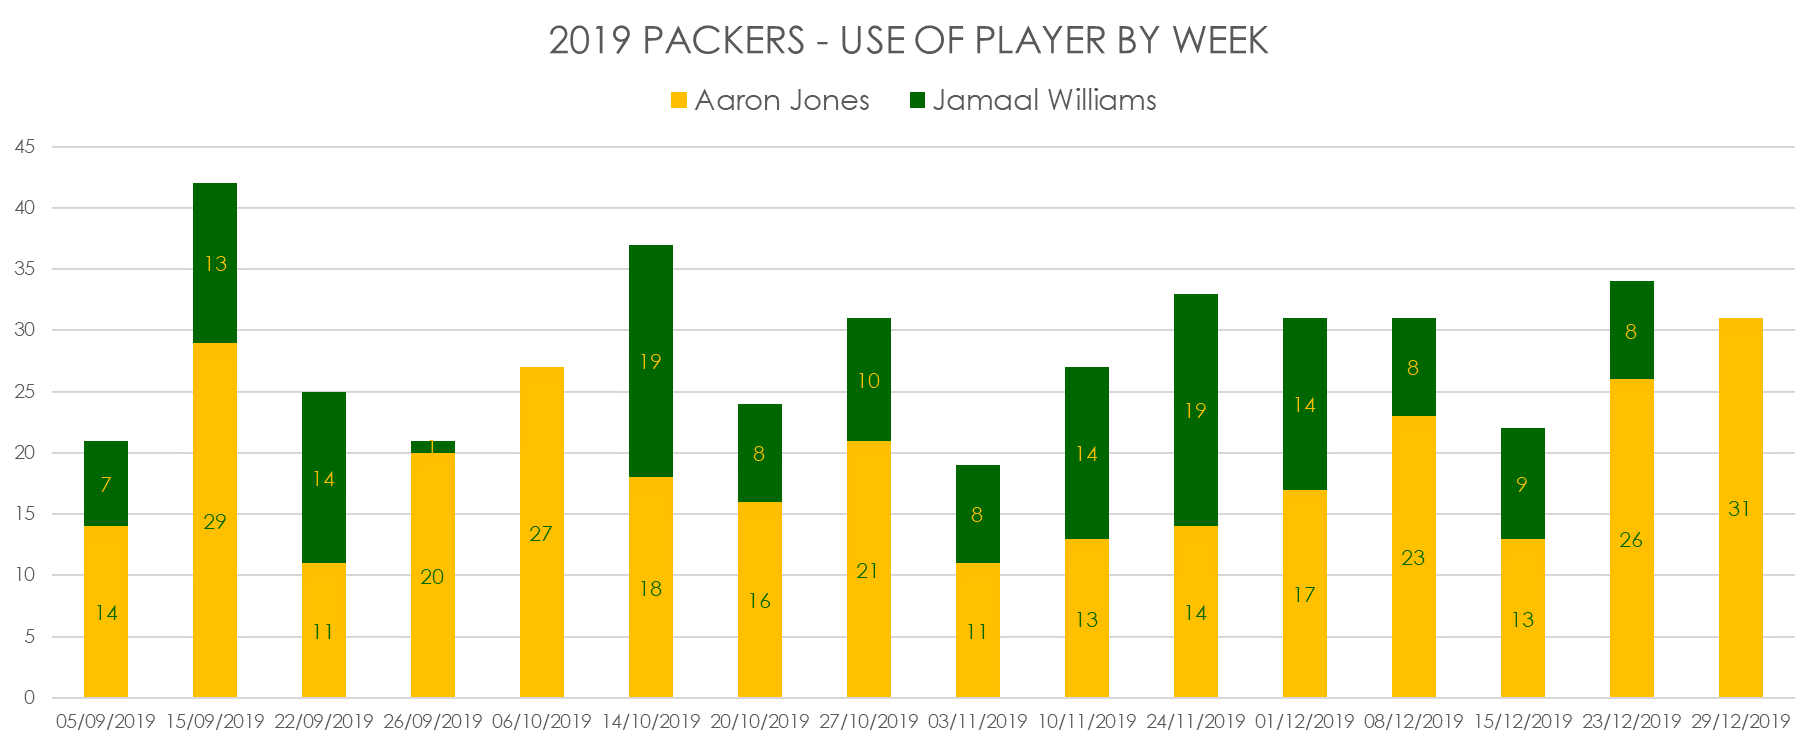
It seems clear that actually for large portions of the season the Packers were splitting volume fairly equally between Jones and Jamaal Williams. It certainly was not the case that Jones was the undisputed number one back and Williams the backup.
Which asks the question “so how come Jones was so much more productive?”. The next chart shows the amount of yardage gained by each player split by distance:
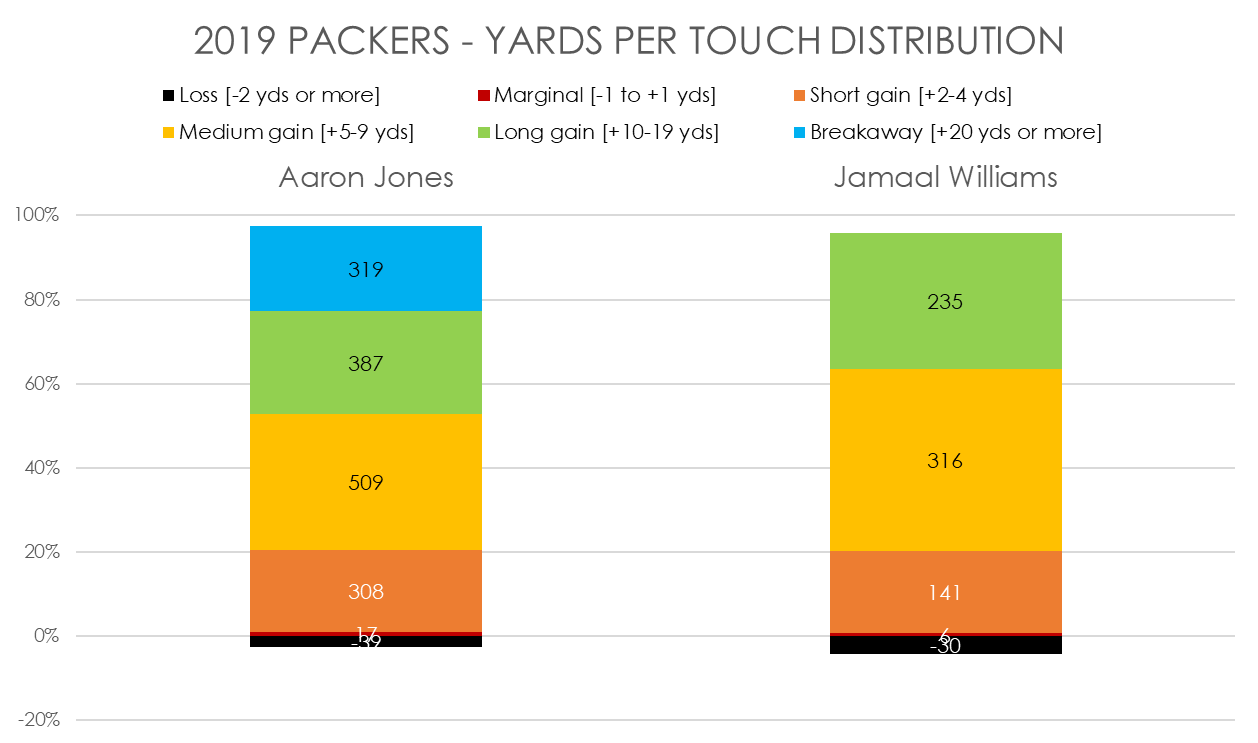
Wow. Jones managed to gain over 20% of his yards on breakaway plays (20 yards or more) whereas Williams failed to create any plays at all of that distance. Jones was a big-play threat whereas Williams was much more of a plodder.
The other difference was the rate at which they scored. The following chart shows their ratio of touches to scoring compared to all RBs for 2019:
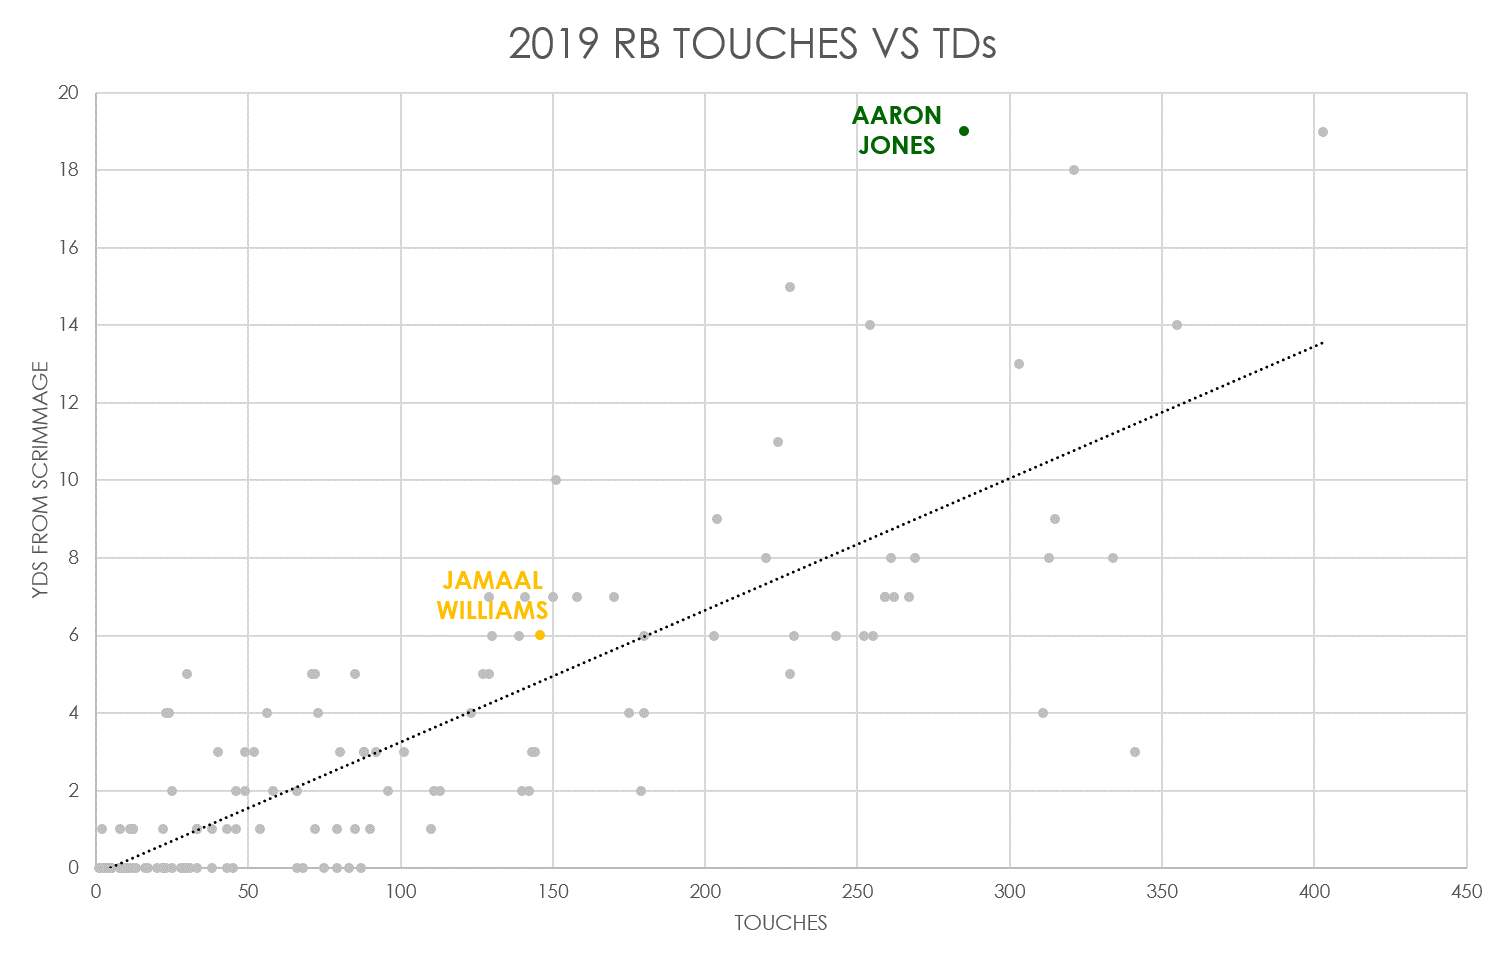
Jones had the craziest TD rate of all backs in 2019 (except for maybe Leonard Fournette in the opposite corner) whilst Williams was close to average. TD rate is not sticky across seasons so (as you’ve surely heard before) Jones’ TD production should be expected to take a major hit in 2020.
Minnesota Vikings
The Vikings running game was as impressive as anyone would have expected with zone scheme guru Gary Kubiak in the building. Kevin Stefanski also impressed enough to earn himself a head coach job after the season. Everyone knows they used a lot of Kubiak’s patented one-cut, outside zone plays and Dalvin Cook had a fantastic season. But there were also some interesting wrinkles. The first chart shows total carries/targets split by down for the two main backs:
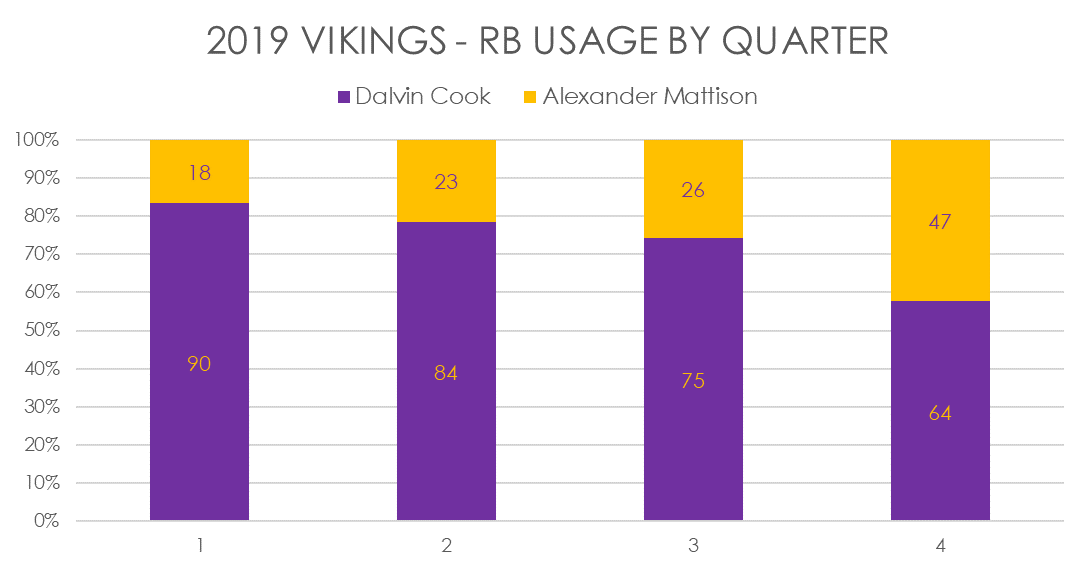
There was a clear progression here. The Vikings seemed to try to use Alexander Mattison later in games. This seems eminently sensible given Cook’s injury history and how much he was being used early in games (Cook was ninth in RB touches this season).
This fuels the thought that Mattison was not simply Cooks’ stand-in, but it was pretty close to that. They did have subtly different roles and you can see it on this chart:
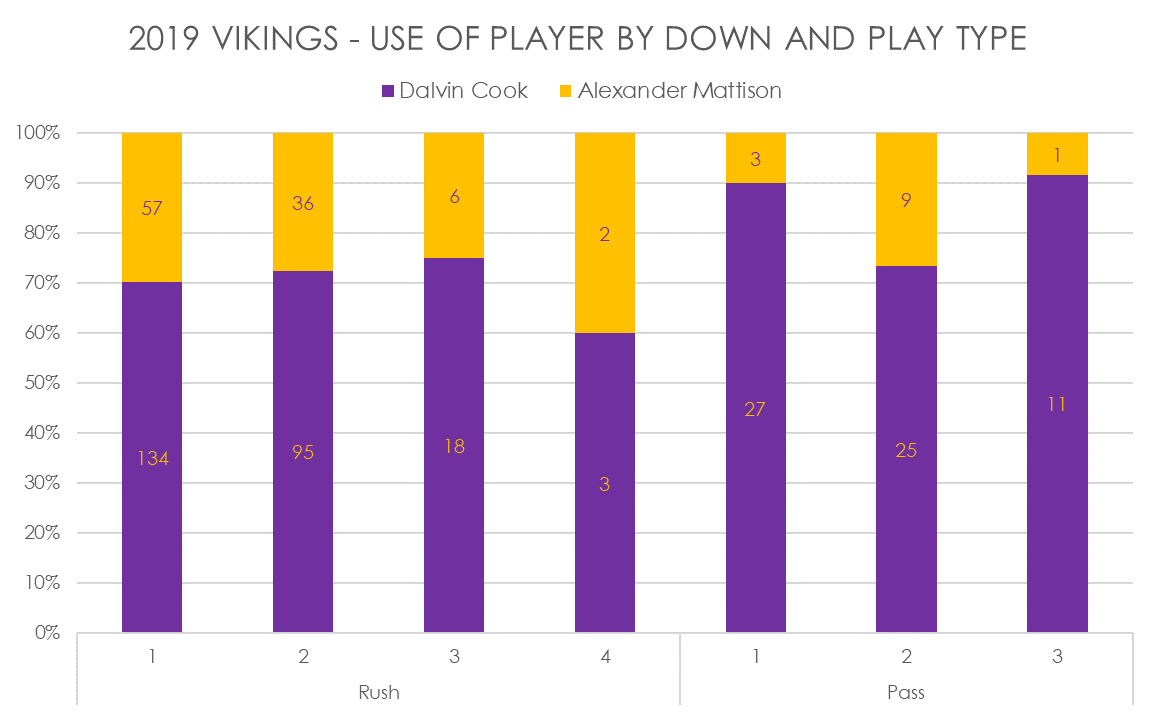
You can see that although Mattison had over 100 touches he managed just 14 targets. The ratio between the backs was very different on rushing and passing plays.
This can be explained in two ways:
- The Vikings did not trust Mattison as much as a receiver.
- The Vikings used Mattison more when they were winning – which meant he played in obvious running situations.
Both make sense and both are likely true to some extent. For our purposes here it doesn’t really matter – we just know that on current usage Mattison is more of a carrier than a target.
Now you’ve got a little bit more information on how some of the backs in the NFC West were used in 2019 and you can use that information to make better decisions about how they’ll be used in the future.
Thanks for reading.
- Ten IDP Fantasy Football Stats You Need to Know after Week 16 - December 29, 2023
- Ten IDP Fantasy Football Stats You Need to Know after Week 15 - December 22, 2023
- Ten IDP Fantasy Football Stats You Need to Know after Week 14 - December 14, 2023


