Truth About Running Backs: AFC North
This series shines a light on how various teams really do use their backs and what we can surmise about them going forwards. Today we focus on the blood’n’guts, hard-nosed AFC North.
Baltimore Ravens
Before we start it’s worth noting that this article deals only with running backs. Lamar Jackson’s record-breaking rushing production is excluded. You can still see its shadow here (many of his rushes occurred on plays where otherwise running backs would be utilized more), but that’s all.
First, here’s a look at distribution of usage by type of play and down:
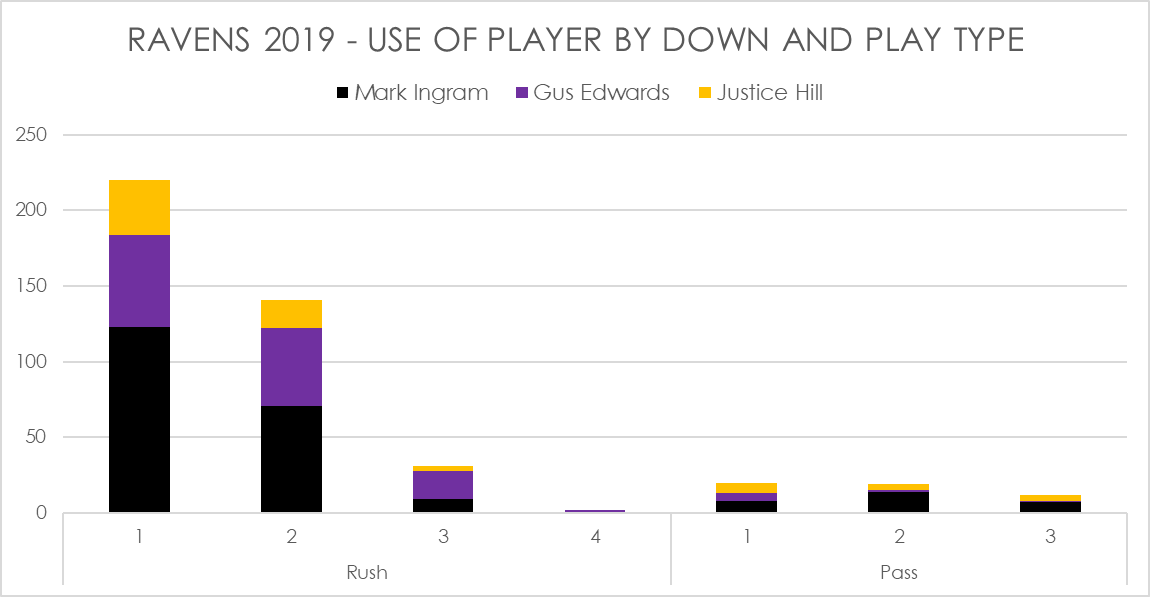
The first thing you’ll see is how little the Ravens threw the ball to their backs. They had the lowest number of running back targets in the regular season.
This is one of those places that Jackson and the unique Ravens offense shows up – he runs the ball on many plays where other teams would check down to a back.
You can see in the next chart the impact that has. All Ravens backs have a high rush-to-target ratio:
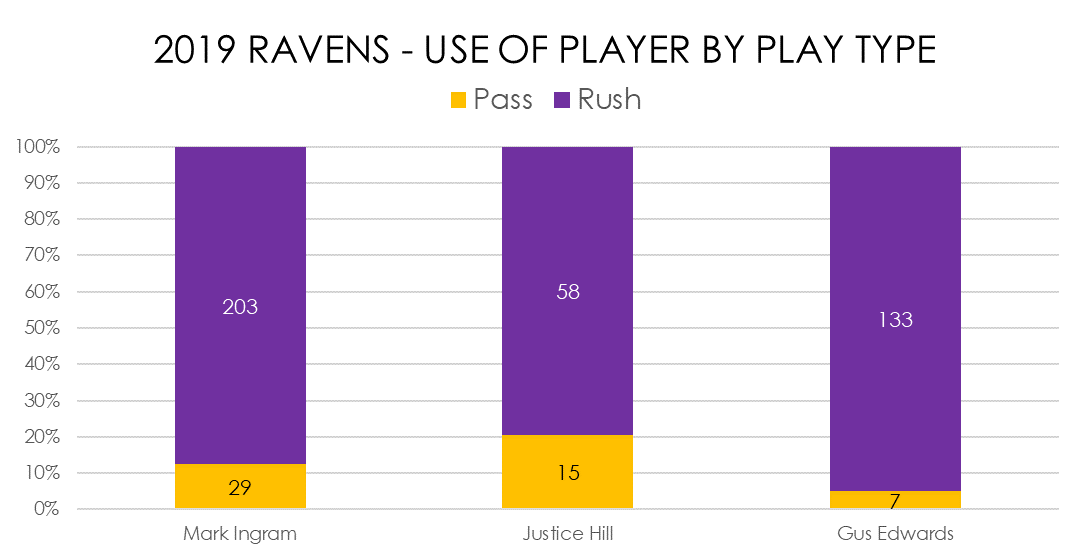
Even with such an unusual team offense included, it’s noteworthy how little Gus Edwards was used as a receiver. It seems pretty clear the coaching staff don’t see him as a passing-game weapon at all.
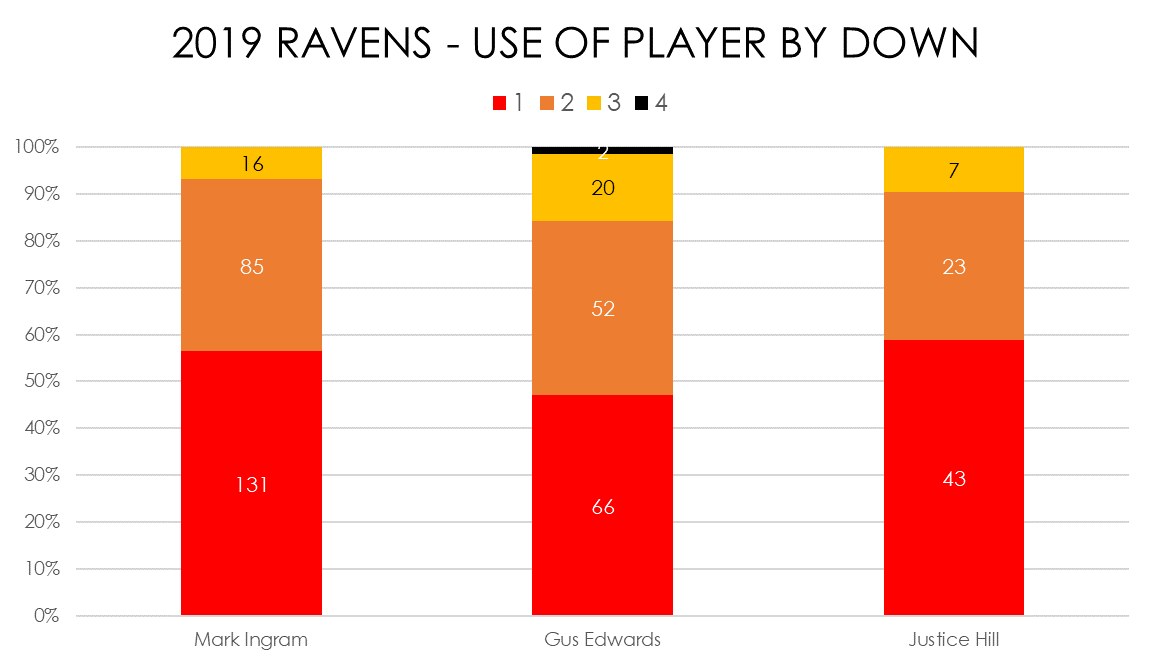
Interestingly though, that doesn’t mesh with his use by down. Edwards actually saw a higher percentage of his carries/targets on third down than the other two backs. That is quite a feat for a player who was barely targeted.
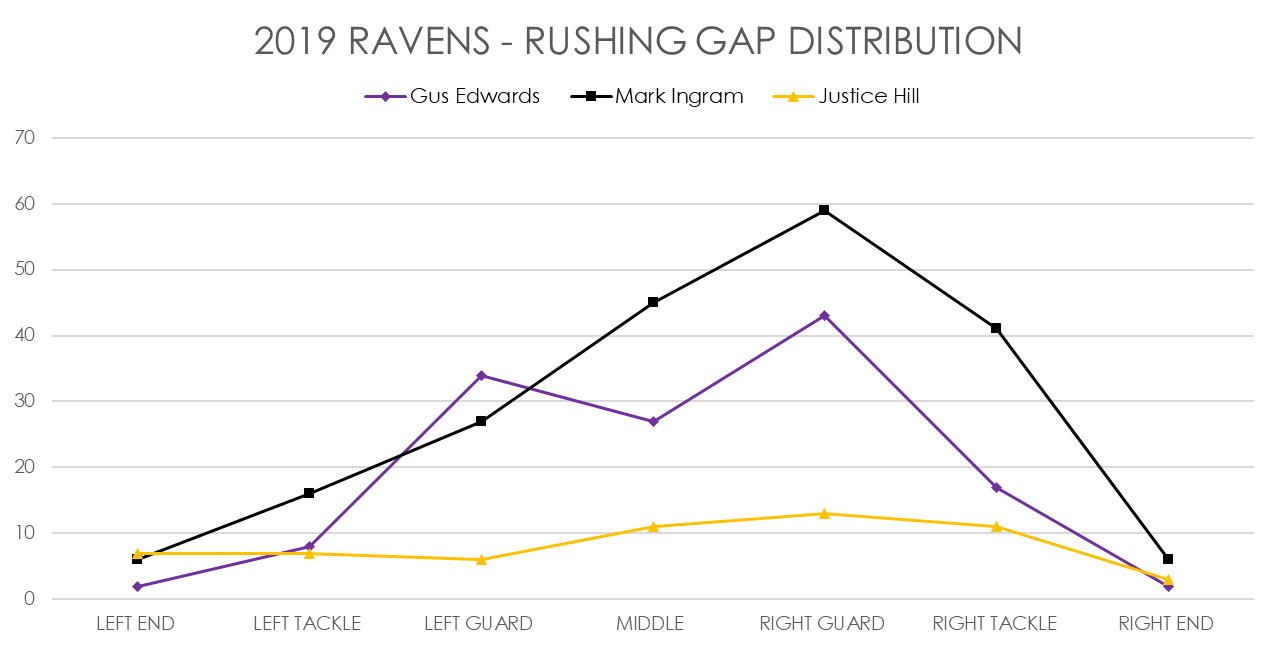
The next chart shows which gap each running back ran through.
This is especially interesting for the Ravens because they were one of the least standard teams. Almost every NFL team’s rushing game is channeled primarily through the A gaps, but the Ravens loved running off right guard in 2019. This makes perfect sense when you think that gap was off star guard Marshal Yanda, but less so when it was also being blocked by Orlando Brown Jr.
Cincinnati Bengals
The Bengals were an atrocious team in 2019, which is why they hold the first overall pick. Joe Mixon and the running game seem to have been tarnished relatively little with that. It seems a lot of people just didn’t watch much of the Bengals’ running game last season. Let’s have a look and see what we can learn.
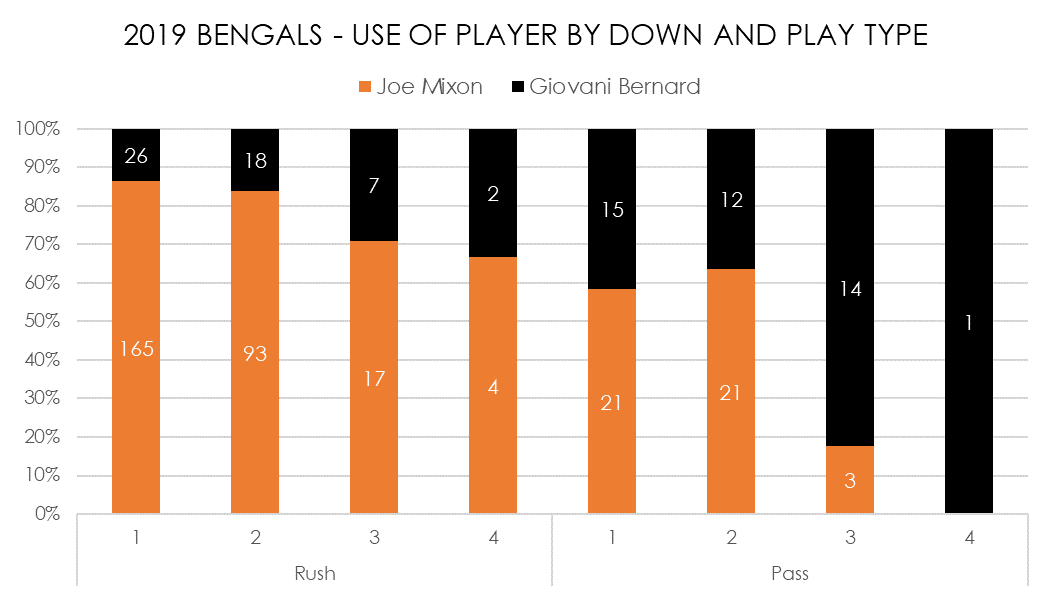
This shows overall usage. As you’d expect it was quite a clear split. Mixon had the lion’s share of carries but lost a few more on third down (not that the Bengals had much opportunity to run on third down). He handled most of the receiving work on early downs, too, but Giovani Bernard was clearly preferred as a third down target. This seems obvious, but Mixon has a reputation as a workhorse, bellcow-type back. The lack of willingness to trust him as a third down target belies that perception.
The following chart shows usage by down irrespective of pass/rush split:
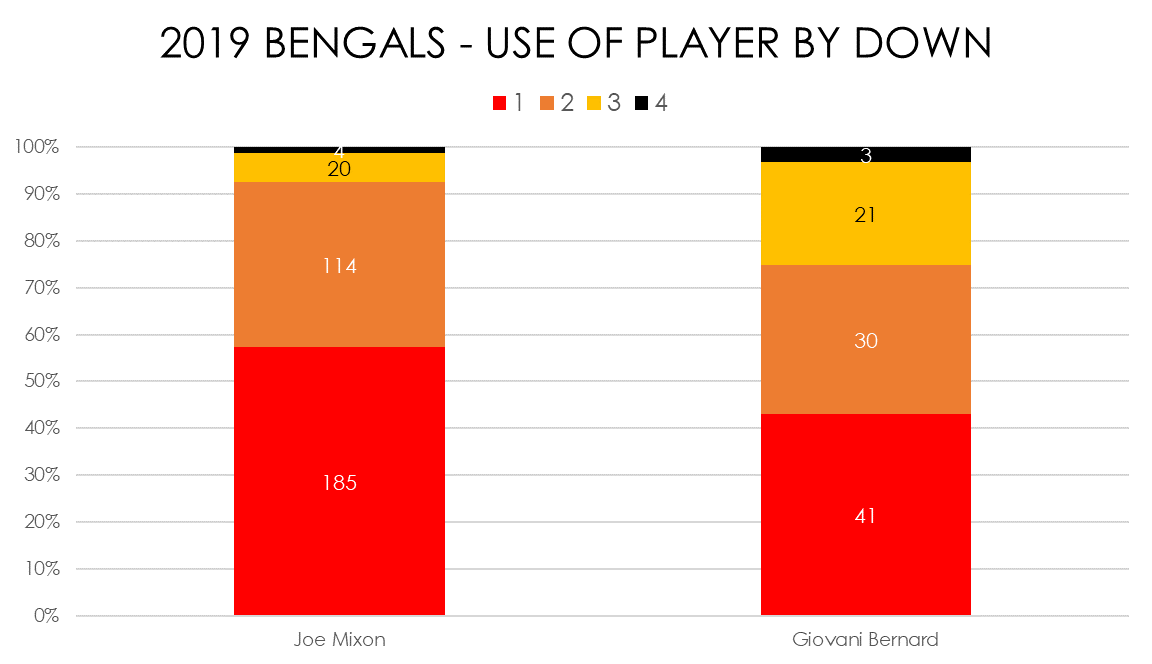
Of Mixon’s combined carries/targets, over 90% of them were on early downs. That’s similar to Derrick Henry, Adrian Peterson, Bo Scarbrough, Sony Michel, Jordan Howard, Latavius Murray and Josh Jacobs, all of whom were firmly early down backs in 2019.
There is a possibility that Mixon turns into a do-it-all workhorse back with a heavy receiving workload, but it would be a departure from what he’s been used as under two coaching teams as a Bengal.
Cleveland Browns
The Browns were a fascinating case in 2019 for running back usage because Kareem Hunt was clearly a big part of the game plan and he was suspended for the first half of the season. As a result, the overall numbers are skewed, but not as much as many people think. Only the two main backs are included here, but the following chart shows combined carries and targets by week.
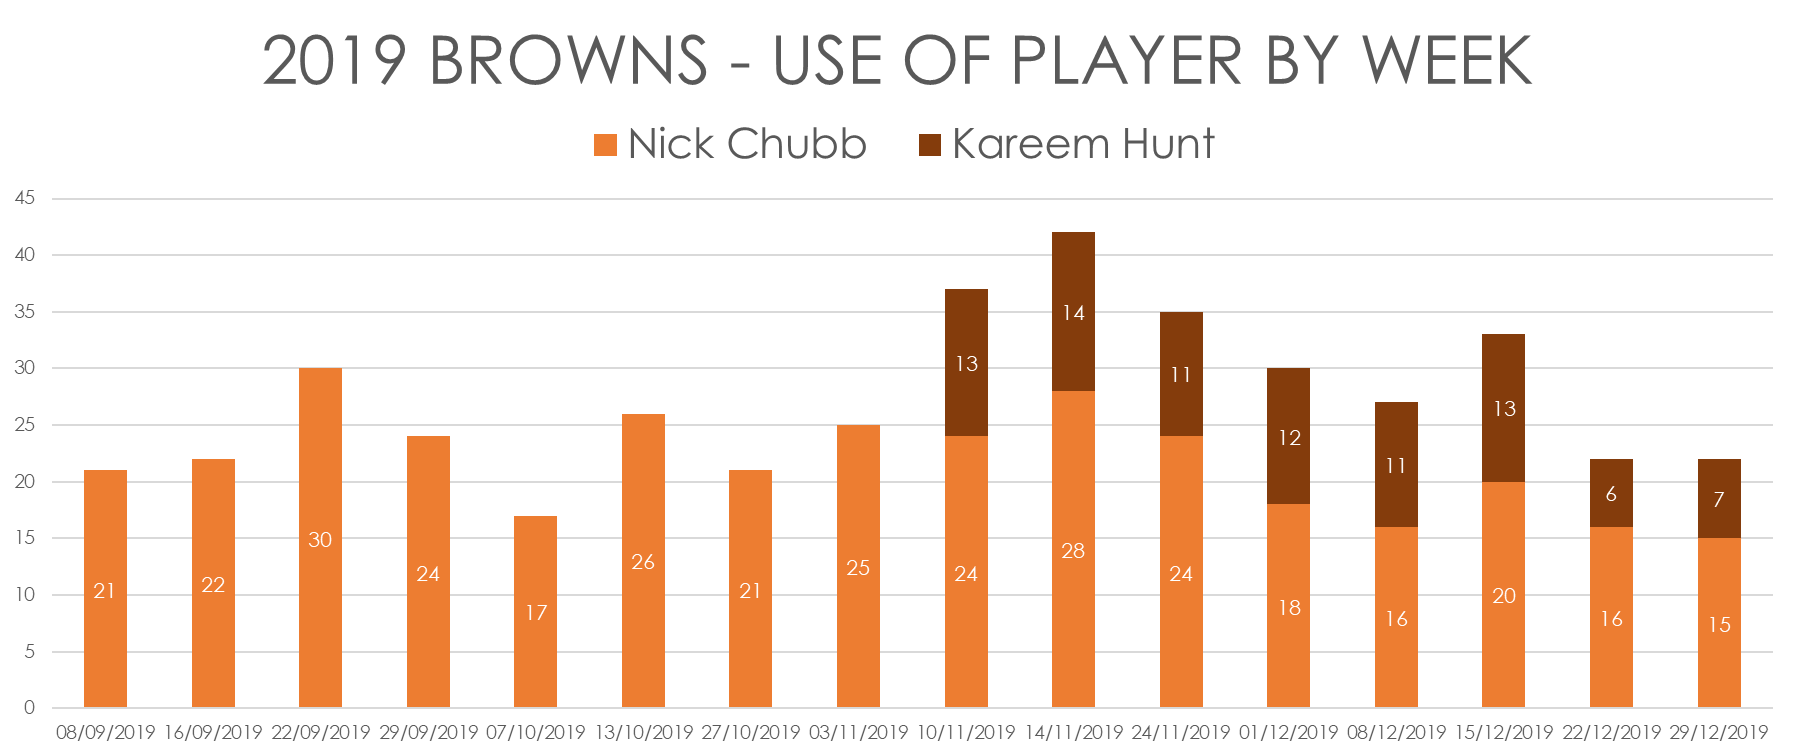
Before Hunt was available Nick Chubb averaged a little over 23 combined rushes/targets per game. When Hunt was available, that dropped to 20. He lost about 13% of his volume. That’s really not that big a drop. It certainly doesn’t mean Chubb cannot be a high-volume back with Hunt involved.
The next obvious question is how were they both used? Here’s a look at the rush/target split for both backs across the whole season:
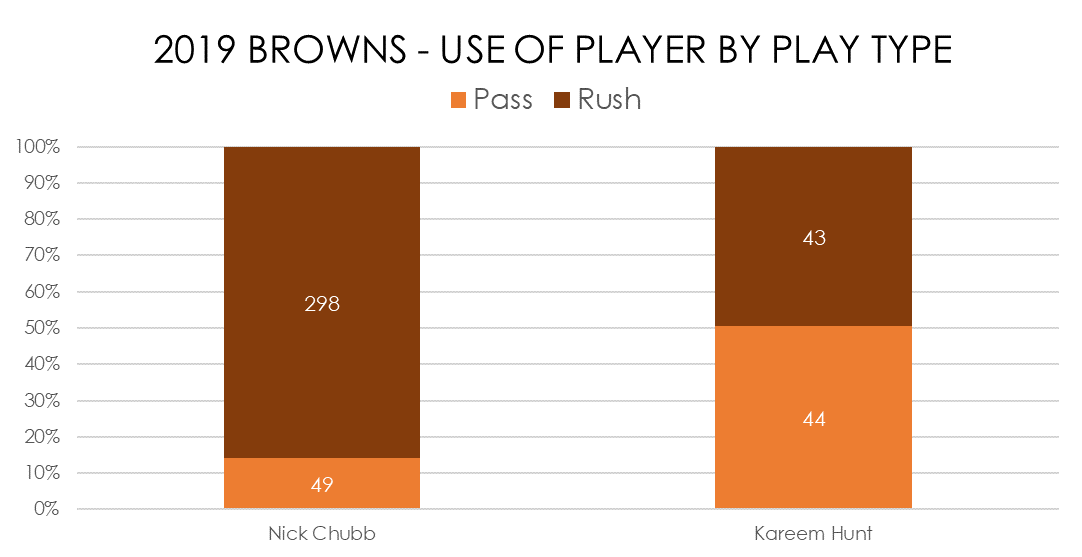
Chubb saw over 85% of his work as carries. Hunt was very close to being an even split. Here’s the same data for just the weeks after Hunt debuted:
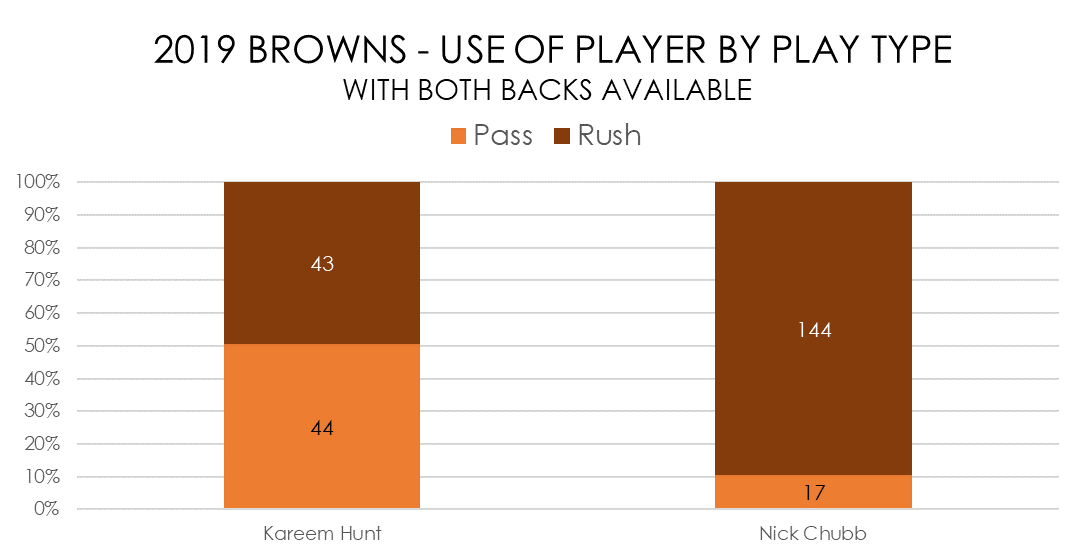
There was no significant shift in Chubb’s split here. The arrival of Hunt did cause a drop in Chubb’s usage, but it was not the death knell some anticipated.
One of the other myths that tends to hang around for teams with rushing/receiving running back splits is that the receiving back runs much more outside of the tackles. The following chart shows how many rushes both Chubb and Hunt carried into each gap:
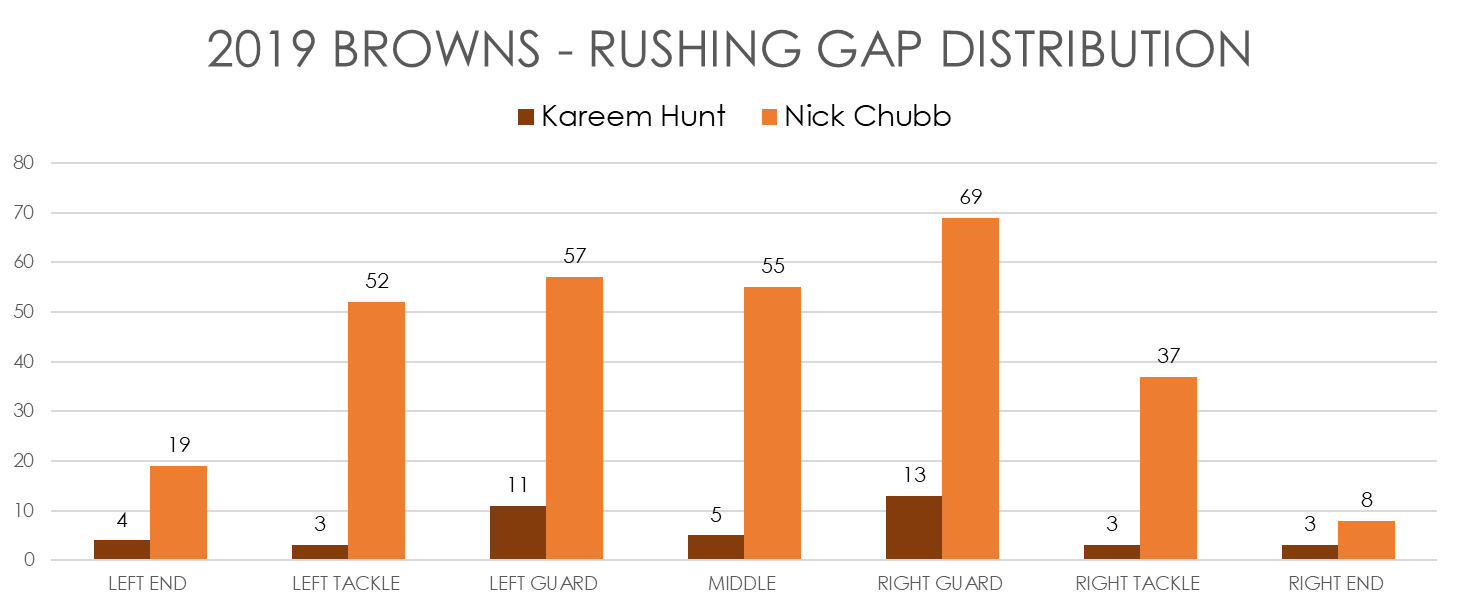
Chubb had 61 percent of his rushes inside (i.e., the A or B gaps), while Hunt had 69 percent.
Pittsburgh Steelers
Injury and indecision made the Steelers backfield a bit of a nightmare in 2019. Ben Roethlisberger’s injury caused the offense to simply destruct. The fact that the team remained somehow in contention for a play-off spot was a minor miracle.
The first chart shows basic distribution of usage:
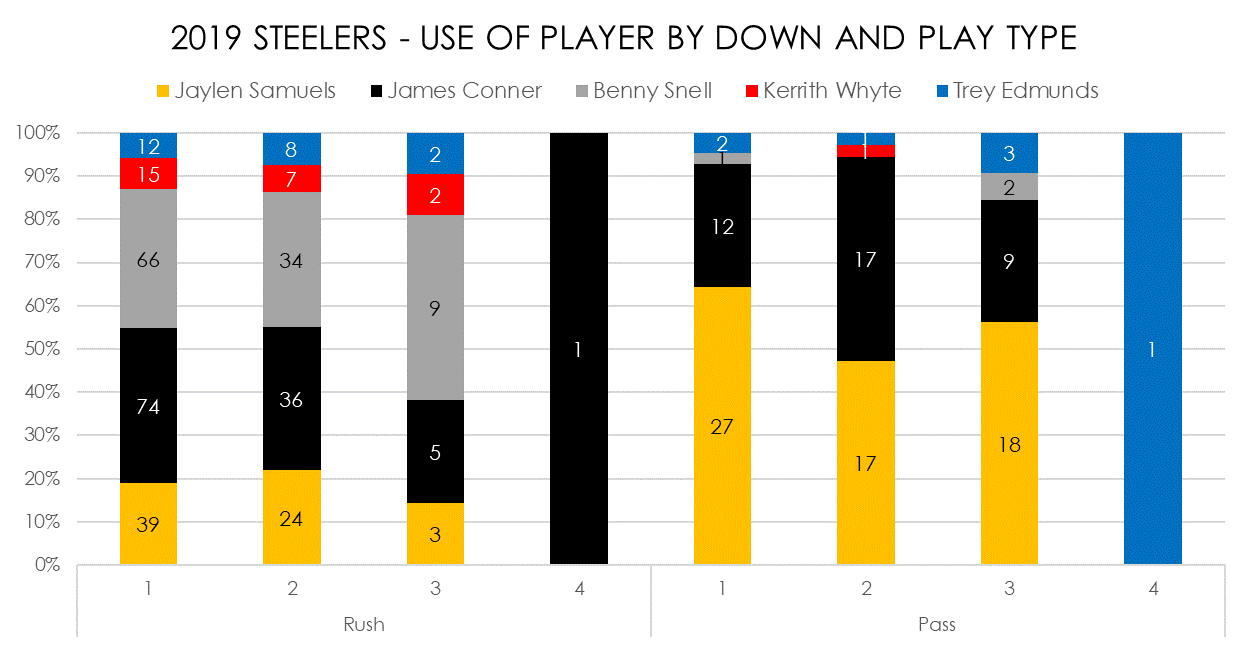
It shows some of the chaos that we saw from the Steelers this year with five different backs getting significant playing time. You can also instantly see that Jaylen Samuels was far more significant as a part of the receiving game than he was a rusher. Benny Snell was really the opposite. He did well rushing the ball but was barely targeted. The following chart shows that in a different way:
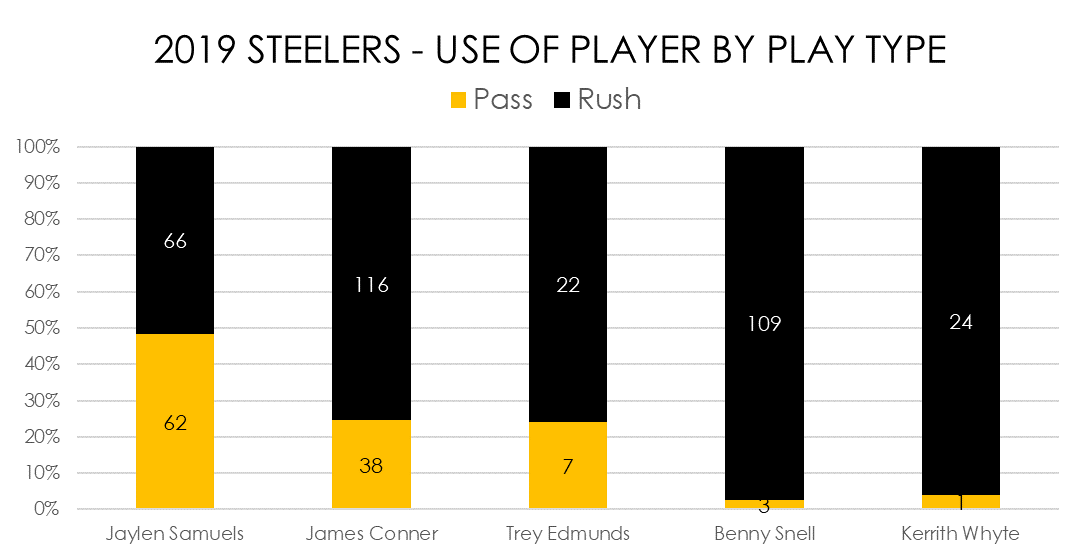
Samuels was clearly the most used as a receiver while Benny Snell and Kerrith Whyte just were not used in that phase. James Conner and Trey Edmunds were somewhere in the middle.
The last chart shows how many yards were accumulated on plays of varying length:
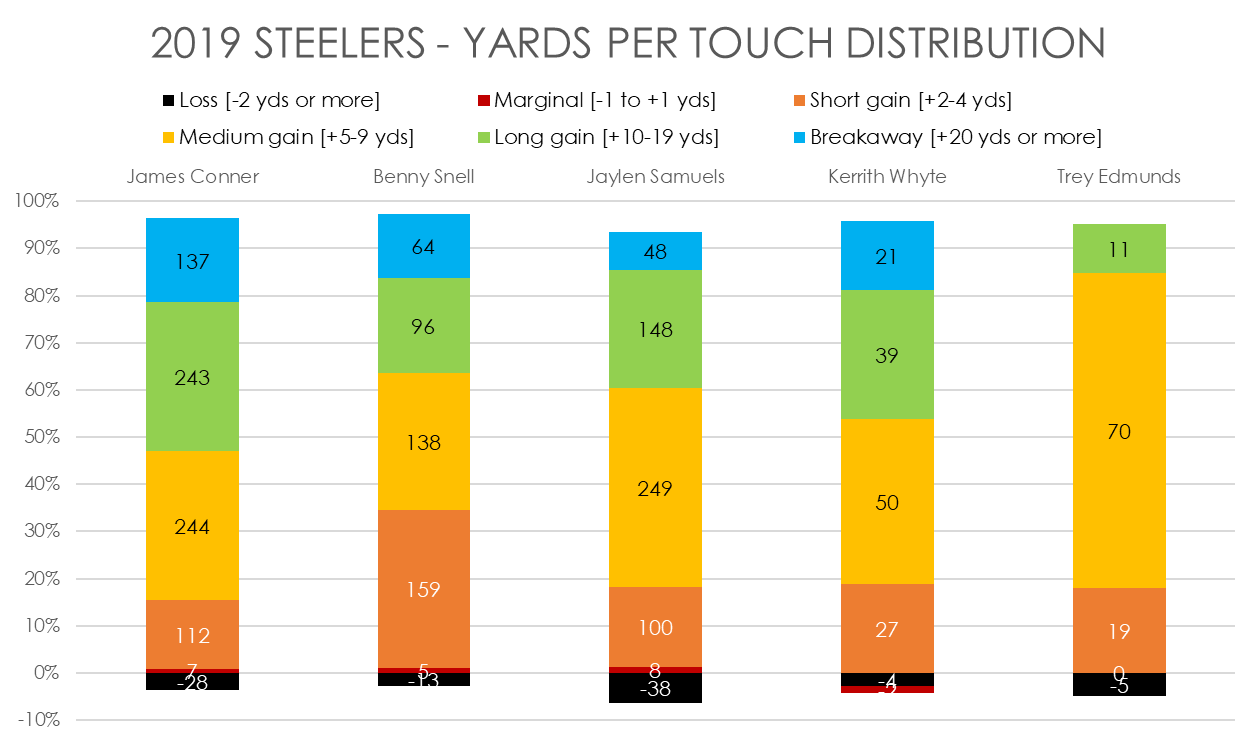
The interesting piece of information here is Snell’s short gains. Around a third of his total yards were gained on plays that only went two-four yards. This was a significantly higher proportion than any of the others. He got a lot of love for his play, but really was in many ways a pedestrian player.
Some of that is the overall poor offense, but that applied to the other players, too. Even Samuels managed more significant gains and he also had a nasty tendency to lose yards.
Now you’ve got a little bit more information on how some of the backs in the AFC North were used in 2019 and you can use that information to make better decisions about how they’ll be used in the future.
Good luck.
- Ten IDP Fantasy Football Stats You Need to Know after Week 16 - December 29, 2023
- Ten IDP Fantasy Football Stats You Need to Know after Week 15 - December 22, 2023
- Ten IDP Fantasy Football Stats You Need to Know after Week 14 - December 14, 2023


