Production Patterns: Past Draft Classes – 2014
The 2019 NFL draft is coming and in preparation for it, I’m breaking down past wide receiver draft classes looking for patterns in their production, starting with the 2012 class and finishing in 2017. We’ll then take what we’ve seen and compare it to the 2019 class. That will give us a six-year sample of what each wide receiver’s production looked like even before the Combine, and a good idea of how they did in the NFL. I’ll then breakdown the 2019 class.
Essentially what I’m trying to do is write out what a mathematical model – bit by bit. Because frankly, we prefer players to numbers.
This is the final section of our initial period back when young wide receivers were good and all was right with the world.
The first two parts broke down the 2012 and 2013 class and offered some initial comparisons between the best and worst prospects.
In this final part, I want to take a look at the production numbers we had for 2014 prospects before the Combine, before breaking down what we have found through all three together.
2014: The Mother Load
To date, just the first three rounds of the 2014 wide receiver draft class have accounted for five top-five seasons and 24 of the last 120 top-24 seasons. It has already outpaced 2012 and 2013, combined. 2014 was something different.
So, consider who broke out in 2012 and 2013, and what we knew about them before the Combine. Who looked good in 2014?
[am4show have=’g1;’ guest_error=’sub_message’ user_error=’sub_message’ ]
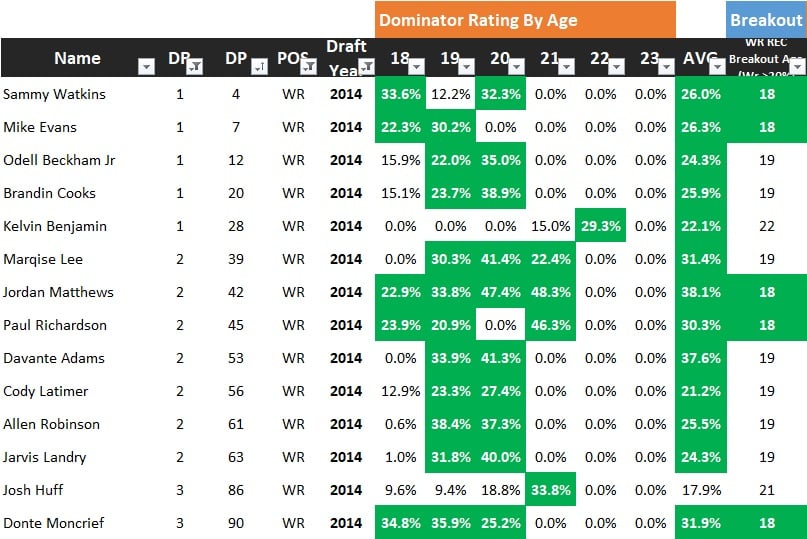
My first note is that Sammy Watkins, Mike Evans, Jordan Matthews, Paul Richardson, and Donte Moncrief all share the same breakout age as T.Y. Hilton, Robert Woods, Keenan Allen and DeAndre Hopkins from the past two classes.
Knowing what will happen for Sammy Watkins, his age-19 season looks suspicious. However, having looked further afield I’ve become convinced that this production dip tells us very much by itself. Odell Beckham and Brandin Cooks not breaking out at age 18 also makes me very determined not to overweight breakout age when ranking players. This has not always been the case. See, I’m learning too!
Both Beckham and Cooks had over 15% Dominator Ratings at age 18, so this could offer yet a softer threshold when breaking down other drafts.
Jordan Matthews’ rise (and fall to injury) works to dispel our general rules about breakout ages. However, I think it’s fair to say that his drop off is more injury related than talent. Much more importantly, we could we have been led astray from Davante Adams and Allen Robinson and even Jarvis Landry for… Paul Richardson if just using breakout age.
Donte Moncrief still mystifies me.
On the plus side, I think Kelvin Benjamin is clearly identifiable as riskier than most from this class.
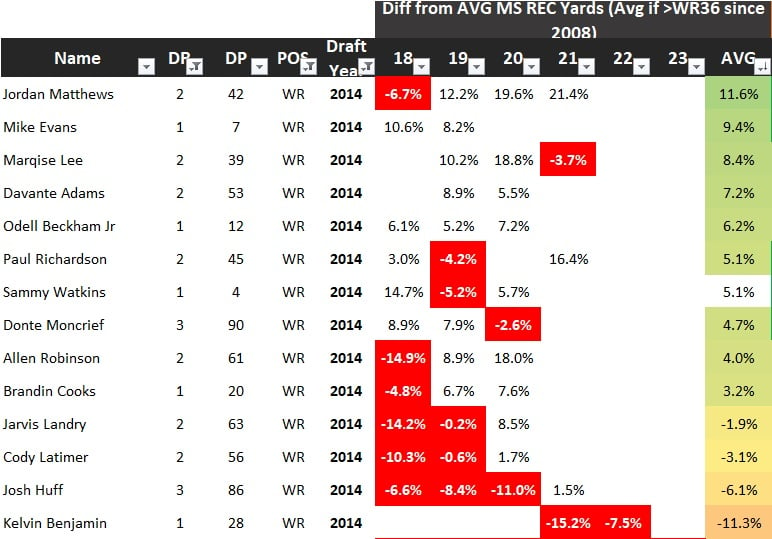
How did they do compared to the successful players?
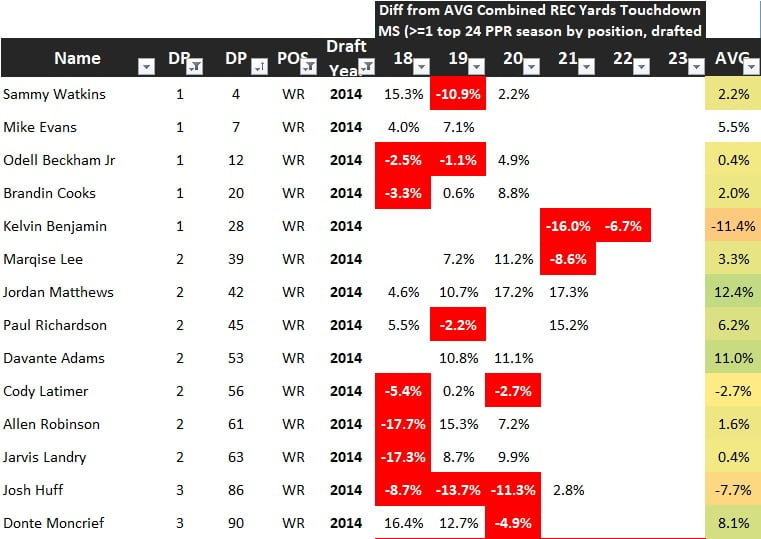
Hopefully, Davante Adams’ overall production could have helped single him out. It’s also true that he took three years to break 800 receiving yards in the NFL. So perhaps this is a good reason to keep holding onto a player with this high level of production.
If we remove the players who were below the level of successful players (averaged a negative number), the only misses that remain are Paul Richardson, Marqise Lee, and Donte Moncrief. To be fair, Moncrief has missed in context, but he did have a top-24 season. All three also had negative production compared to successful NFL wide receivers in their final year.
I’ve looked at these values a lot, and what I always end up coming away with is that they can help highlight a much more accurate group of players for hitting in the NFL. But they suck at ranking them.
This is also the problem with R^2 values of 28% and below. It’s clear it matters, but it’s also clear it can’t “solve” it for you. It’s a lot better at highlighting potential misses then the height of each hit.
In some way, the 2014 draft class is both a blessing and a curse. The number of great players from this class is wonderful, but so many of them together made it hard to identify anyone as the best.
However, there is one other thing I think we should look at now that we have three classes to compare.
The Randomness of Touchdowns
If there is one thing everyone can agree on its touchdowns both matter and are mostly random. True: certain players get more use in the red zone. But overall, the difficulty of catching a touchdown pass, or breaking a play over 20 years to find the paint, means that a lack of success is as much to do with defensive as it is offensive execution.
But that’s the NFL. College football is basically the Wild West and Vegas rolled into one when it comes to analytics. Yards per carry, touchdowns, offensive line ranks, we get up to all kinds of things when evaluating prospects.
As I’ve shown, it’s not without some cause. For one thing, there are few things that help us evaluate the chances of a prospect turning into a successful NFL player. So why would we ignore touchdowns? Still, it makes me worry when players like DeVante Parker (three years over 30% of his college team’s touchdowns) or Josh Doctson (three years with over 28% of his teams’ touchdowns), struggle in the NFL. That’s why I have based my prospect graphs on the percentage of receiving yards and not dominator scores.
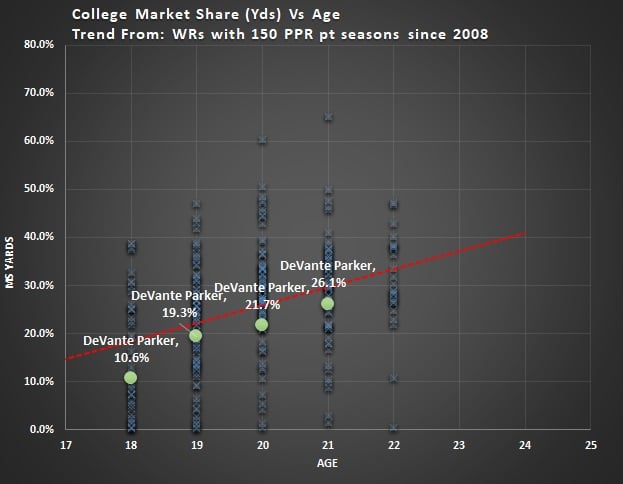
Does this help with the “WR wonder year” class? Yes. But here’s an asterisk for you. It doesn’t always help. I think all three ways of looking at a prospect’s production (Dominator, the difference from average, and percentage of yards only) provide the best picture when combined.
Just Yards: Where the Cream Rises
The 2012 and 2013 classes get a lot easier just looking at yards. If I select the same group (drafted in the first three rounds) and sort by average percentage of receiving yards, guess who rises to the top?
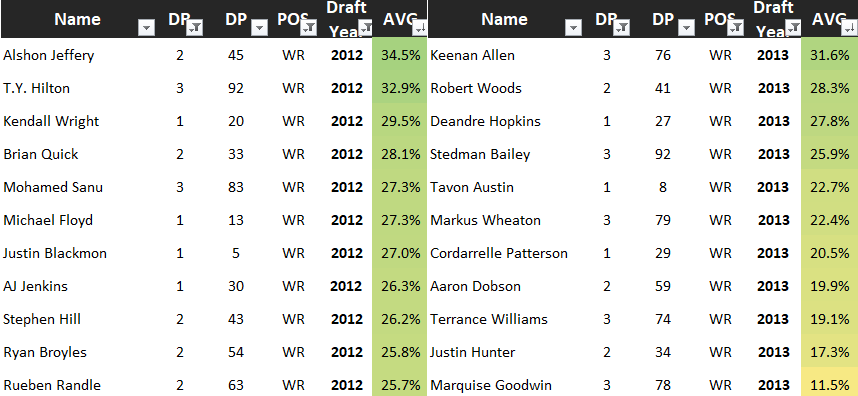
The 2014 class is a little worse but we’re starting to get a lot closer to half-decent ranks.
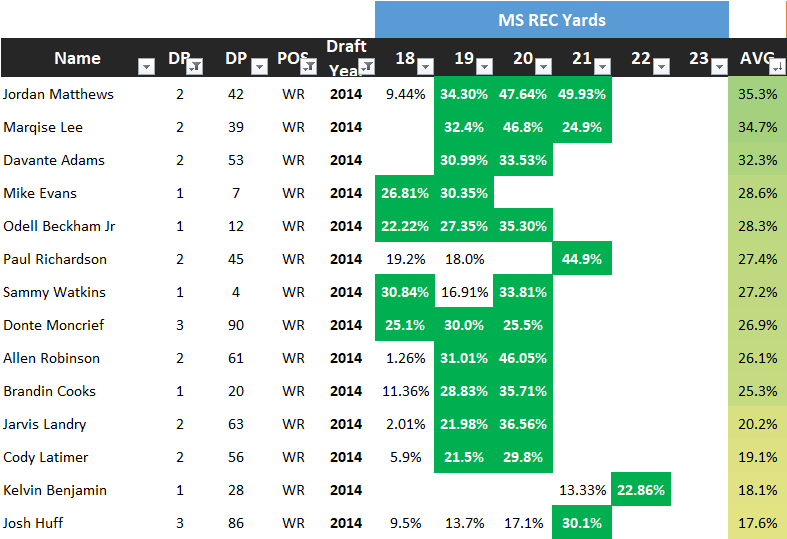
Again this pushes most of the “worst” picks down to the bottom of the group in all three classes.
In short, it’s still not ranking Beckham at one, but it’s putting him towards the top of the class in terms of likelihood (and doing a lot to tell us there are multiple players in this class who could hit in the NFL.
Patterns
Breaking out at age 18 is good. In fact, it seems to constantly indicate a higher liked of breaking out. But breaking out at age 19 or 20 does not mean you have a lower ceiling in the NFL. A breakout out after age 20 seems to be an indicator of someone who could struggle – at least early in their career.
Combined with Dominator rating and breakout age, looking at a player’s market share of yards can help to sort a class from most to least likely to do well in the NFL.
Playing to the age of 22 or older in college is a very loose “kinda sorta” pattern. Cooper Kupp is an easy outlier to this, off the top of my head.
Production is a lot better at highlighting potential misses than the height of each hit.
For Now
It’s worth remembering that none of these classes provide as much context as the combination of these two graphs.
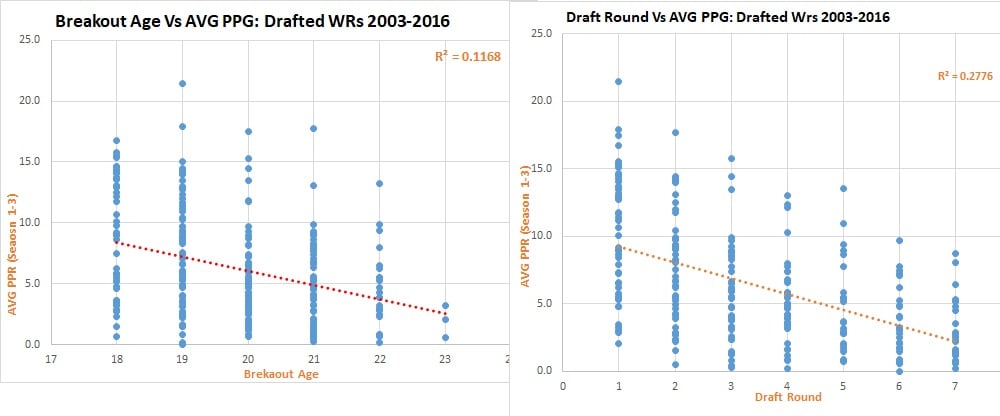
So let’s jump back in the time machine and take a look at the next three years in turn. Things are about to get a whole lot darker as we enter the “Wide Receiver Crash” of 2015 to 2017.
See you there. Thanks for checking out this series again!
[/am4show]
- Peter Howard: Dynasty Fantasy Football Superflex Rankings Explained - March 6, 2024
- Dynasty Target and Regression Trends: Week 15 - December 23, 2023
- Dynasty Target and Regression Trends: Week 14 - December 16, 2023


