Rookie Draft Study: Part Two, Pick Value

This is part two in a series covering dynasty rookie drafts, pick value and historical ADP. If you missed part one, we’d strongly recommend you check it out before continuing on with this article.
Before we get too deep into all this, it is important to understand how the value of rookie players works. One thing most people are certain of is that rookie picks, especially first rounders, are worth a lot. They are right – since March of 2014, every first round pick in every month’s mock data has been in the top 100.
Another common refrain is that the closer you get to your rookie draft, the more the value of picks inflates. There is some truth to this, but it isn’t entirely cut and dried. Picks 1.01-2.12 are relatively flat from February (when DLF starts tracking them) to April. The jump doesn’t occur until after the NFL Draft (more on this shortly). The third and fourth rounds are a different story.
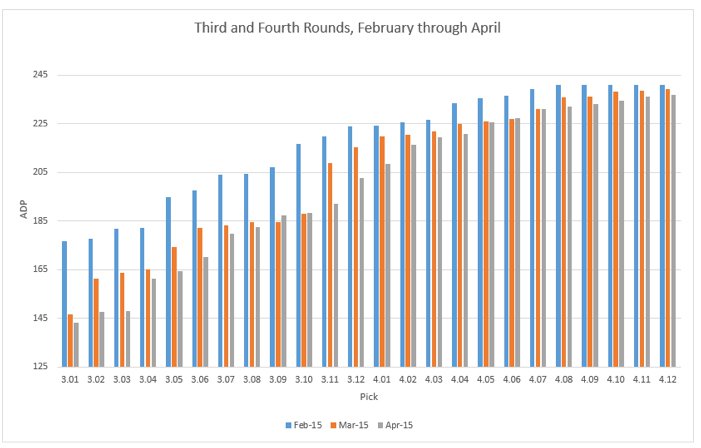
Especially from February to March we see a massive increase in the value of these later picks. With the combine occurring after our February mock drafts (but before we begin in March), the reason for the uptick is pretty obvious. As player evaluations flood in, the picks only get to be worth more and more.
Now let’s have a look at first round picks from before the NFL Draft (April) to after (May).
This graph covers both the 2013 and 2014 classes.
[am4show have=’g1;’ guest_error=’sub_message’ user_error=’sub_message’ ]
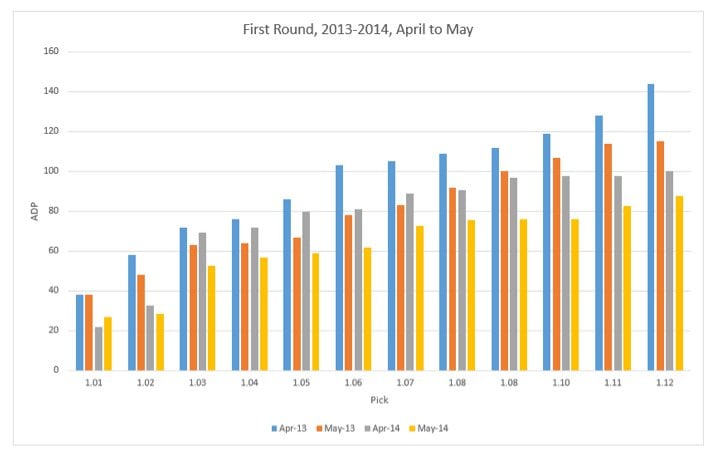
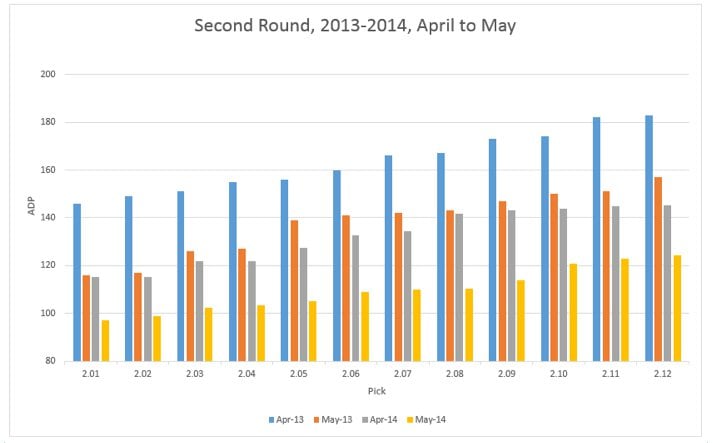
As you can plainly see, there is a near universal and rather significant jump following the draft. The three other rounds show more of the same.
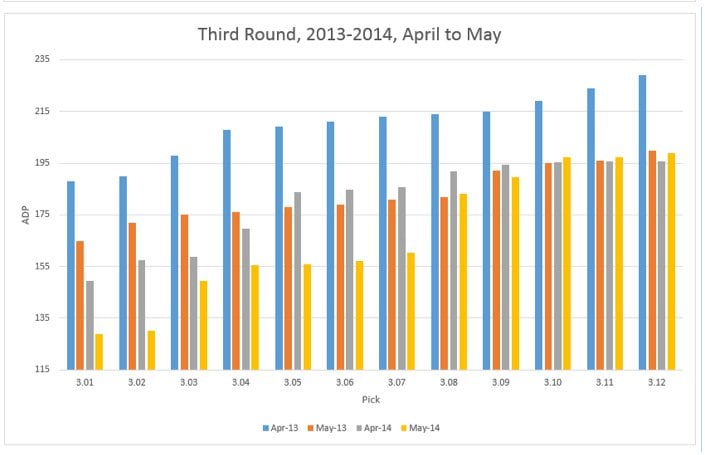
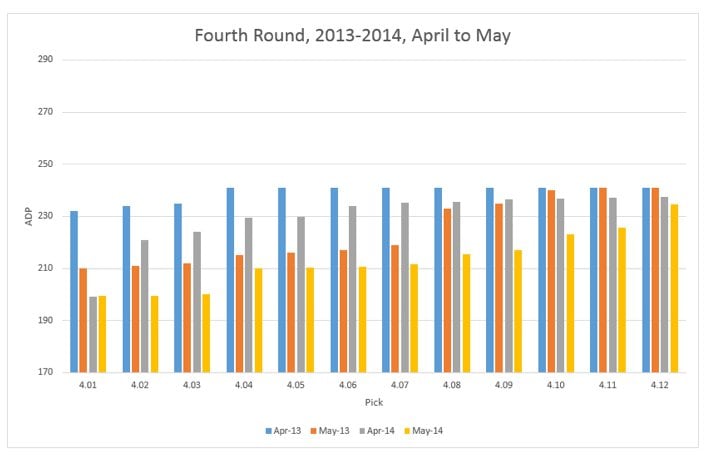
So, what about this information is actionable? Well, it doesn’t take a rocket genius brain surgeon scientist to realize the time to acquire third and fourth round picks is February (or before). Savvy owners looking to get young should put significant effort into turning over their roster immediately following the season.
It’s also pretty clear the best time to deal begins the Sunday after the conclusion of the NFL Draft. The only time I could see this going sour is if there is a 1.01 heads and shoulders above any other player and he ends up in an awful situation. (Imagine if this draft had no Todd Gurley or Kevin White and the Browns traded up for Amari Cooper.) But that’s a pretty specific situation I’d not lose too much sleep worrying about.
A quick aside – you may have noticed the 2014 picks almost all have a lower ADP than their 2013 counterparts. I attribute this to both the really deep 2014 class and a continually growing infatuation with youth among the dynasty community.
Now that we have an understanding of what happens before the picks are even made, let’s move on to what happens a year or two later.
If you read part one of this series you may remember I mentioned sophomore price vastly outpaces rookie production. The numbers show that more often than not rookie output matters very little for top-18 draft picks.
In the following chart, if the blue (2013 rookie) or orange (2014 rookie) bar is below zero, the ADP change from the players rookie season to their second season dropped. For example, the 2013 1.01 had a May 2013 ADP of 38. By May of 2014, the ADP had dropped to 12 for a total change of 26 spots. This may be a bit confusing if you look at a player being drafted earlier as rising up the draft board. Please also note if the bar is missing, that means the player went undrafted their second season.
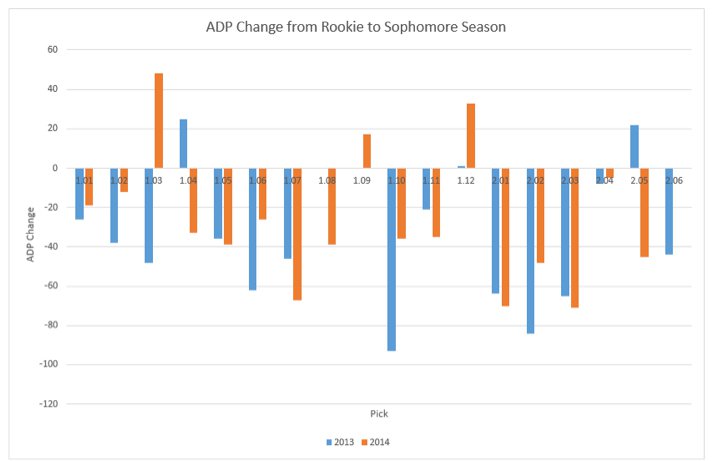
The data shows only nine of the last 36 top-18 picks have had a worse ADP following their rookie season. For comparison’s sake, 13 of the 61 non-rookies with a May 2015 ADP between 25 and 100 (which encompasses most of the top-18 rookies) had a better ADP in April 2015. That’s right, kids, a staggering 79% of veteran players in that group saw their ADP rise over the same stretch that 22% of rookies did.
Before you panic and sell all your veterans for rookies, I have one more thing to show you.
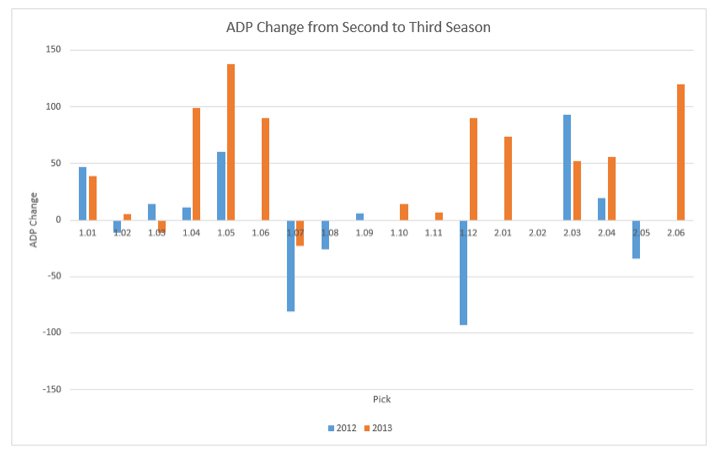
This is the same chart as before but because we don’t have post-second season ADP for the 2014 rookies yet, it covers 2012 and 2013 rookies instead. It is rather disconcerting to see an increase in 81% of ADP’s, a figure very similar to the veteran percentage I quoted above.
There are a handful of reasons for the year two to three and overall veteran increase in ADP. One main one is the incoming rookie class. Overnight there are 12-20 college kids setting up shop in the top-100. It also would make sense to see a handful of players drop due to age or lack of production. And finally, the better your ADP, the easier it is to slide down draft boards. Getting to the top is the easy part, staying there is what’s difficult, even for elite players.
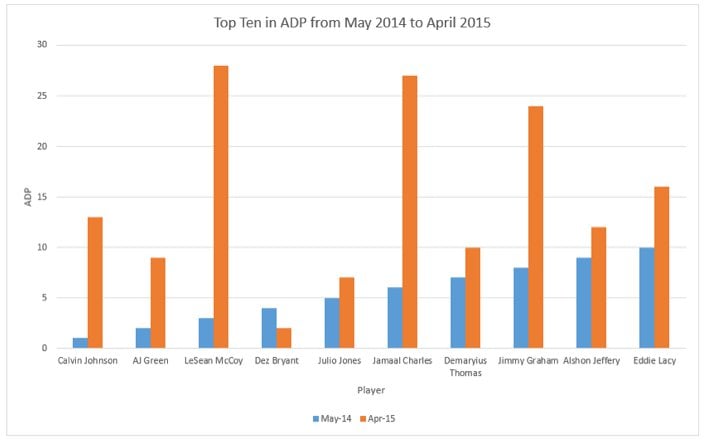
So what we have is a never ending cycle where rookies are drafted, depressing the ADP of vets. Then rookies become vets and the large majority of them see a significant increase in ADP as a result of their luster wearing off (we will talk in-depth about hit percentage on rookie picks in part three). This makes room for the next rookie class.
What is paramount in all of this is to understand that while all this is going on, the good veterans continue to produce regardless of what the new shiny toys do to their ADP. It’s very easy to get caught up in rookie fever and much of what I’ve presented here could easily feed into that. But the reason we see a huge fall-off from year two to three is the growing separation from those who can play to those who can’t, but still had two years to try and prove otherwise.
In addition to discussing hit rate in part three, we will be covering the value proposition of vets versus picks in part four. In the end, it will (hopefully) all tie together. But that’s a story for another day, like tomorrow.
[/am4show]
- How to Win Without Watching Football - July 22, 2021
- 2018 Summer Sleeper: Chicago Bears - July 9, 2018
- NFL Draft Aftermath: Winners and Losers from the AFC North - June 18, 2018


