New Dynasty Tool Tutorial: How to Use Percentage Fantasy Points
As part of DLF’s recent acquisition of FFStatistics, we are pleased to announce that the integration of tools has begun and they will soon be readily available to our premium subscribers. As each new resource is released, it will be accompanied by a “how-to” in order to familiarize our readers with the best way to utilize them for fantasy purposes. Next up is the Percentage Fantasy Points App.
Editors Note: Since this article was written a slight change has been made to the graphs in the app. They will display a little differently than presented here in the article, but the app still delivers the same valuable information. Enjoy!
What Is The Percentage Fantasy Points App?
The Percentage Fantasy Points App is designed to help you determine how a player (or multiple players) at each position goes about acquiring their fantasy points either by season or over the course of multiple seasons. The app makes it easy to analyze an individual player’s fantasy production or compare multiple players’ fantasy production to help make determinations that win you ‘ships.
The app presents fantasy points scored via rushing or passing/receiving by breaking them down into some easy categories we all know as fantasy managers. Those categories are:
- Yards Rushing
- Touchdowns Rushing
- Yards Receiving
- Touchdowns Receiving
- Receptions
- Passing Yards (QB only)
- Passing Touchdowns (QB only)
The tool displays these results in easy to interpret graphics, allowing users to quickly find desired results or lack thereof. The raw data can also be found on the app by scrolling down to find the Percentage Fantasy Points database – another very useful aspect of the newest weapon in the DLF Army’s arsenal.
Let’s learn how to use it because, remember: there is no off-season . . .
At A Glance
When first accessing the Percentage Fantasy Points App, you will see an area for inputting the desired players to analyze as well as filter by position, year, and rushing/receiving volume, an area where the player’s graphic results will be shown along with their statistical data below, and the player database at the bottom. Now we can begin.
Positional, Player, And Volume Input
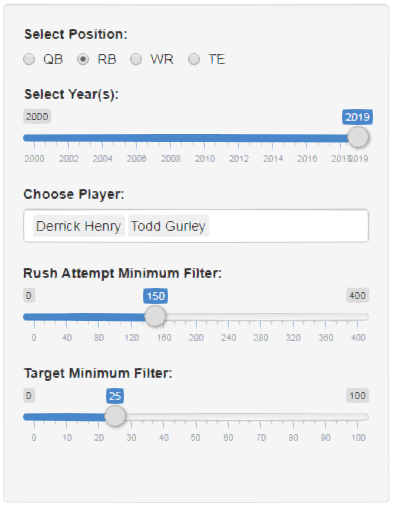
So when we begin, the first step you need to take is selecting the player(s) you are going to look at. Below you will find the part of the tool designed for this.
Selecting A Position
You can see at the top of the image, there are “Select Position” checkboxes with four options to select which position to look at. Either quarterback, running back, wide receiver, or tight end.
We are set up to look at running backs above, but below is what you would see if selecting either of the other three positions.
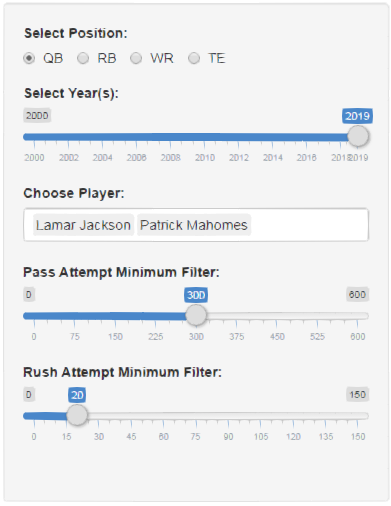
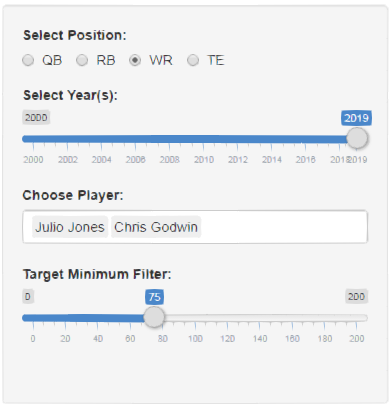
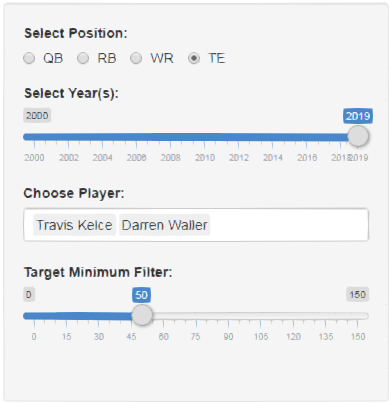
Selecting Year(s)
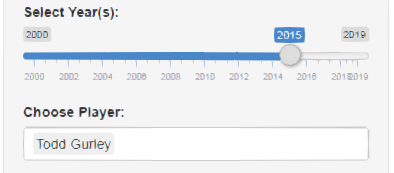
Back to the running backs. The next step in the process is to select which year you would like to look at by using the “Select Year(s)” slider. Slide the marker back and forth to find the desired year(s) to look at.
If you slide the marker further back than a player has been in the league it eliminates him from the “Choose Player” box as we see below and in turn, the following graphic and data in the next step.
Selecting A Player(s)
We will look at the 2019 season. The “Choose Player” (as mentioned above) is the next step.
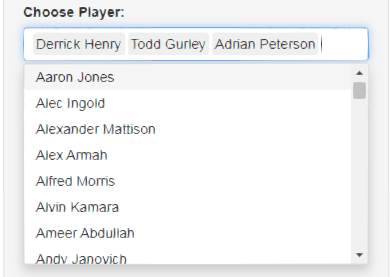
You can select players to analyze by simply clicking on the search box and doing one of two things. You can either scroll through the names alphabetically or start to type the player’s name (either first or last) and the tool will filter out the players that do not match as you progress letter-by-letter. Below we added Adrian Peterson to Derrick Henry and Todd Gurley.
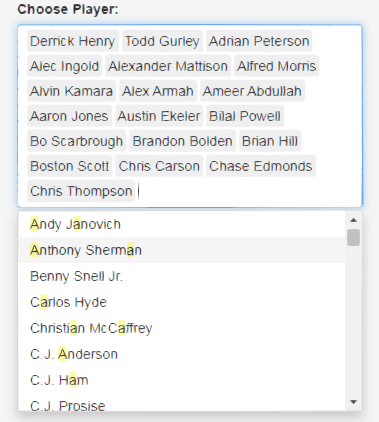
You can also select a large number of players as we see in the second image below.
Filtering The Volume
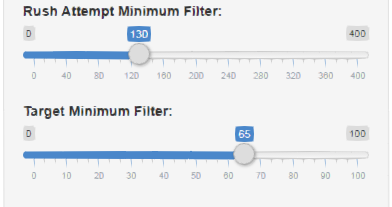
You can filter the desired volume minimums. Simply click and hold the marker at the end of the slider and slide right or left depending on the minimum volume required for your analysis.
If you have already selected the player(s) to look at, adjusting the volume filters that we see above will not directly affect the graphics and player data from your search results, but it will filter through the database that we find by scrolling down.
This is a very helpful feature of the Percentage Fantasy Points App, as you can either use this method to initially search for players with a desired rush attempt or target minimum or find players with similar or different thresholds you have selected. Said player(s) can then be added into the “Choose Player” search bar for graphical comparison.
We will cover more on the database later on, but for now let’s look at what all this has done for us in the next section of the tool.
Note: Rushing attempts minimum filter is in increments of ten for RBs and five for QBs. The target minimum sorts in increments of five for all positions, and the pass attempts filter sorts in increments of 25.
Analyzing Players With Graphic Display And Statistical Data
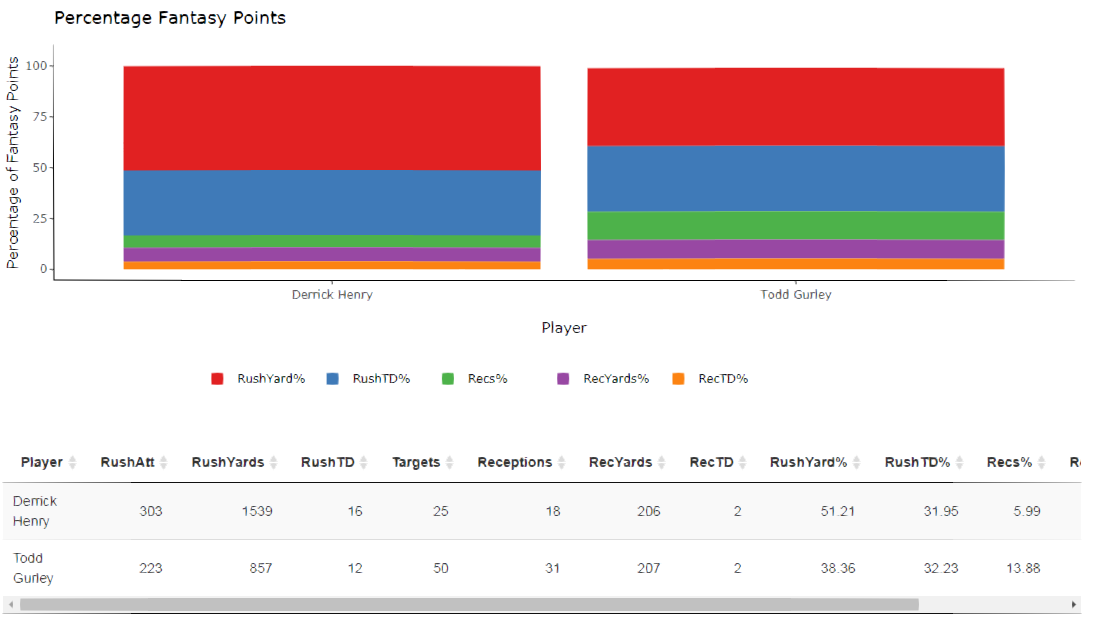
After you have successfully selected the player(s) you would like to analyze, you will be presented with results that look a like the graphs below.
As you can see, they are color-coded to easily differentiate between fantasy point scoring categories. The color guide is listed below, followed by the players’ statistical data. To see the full list of statistics and metrics in the player data, you may need to scroll to the right using the bar found below the actual data.
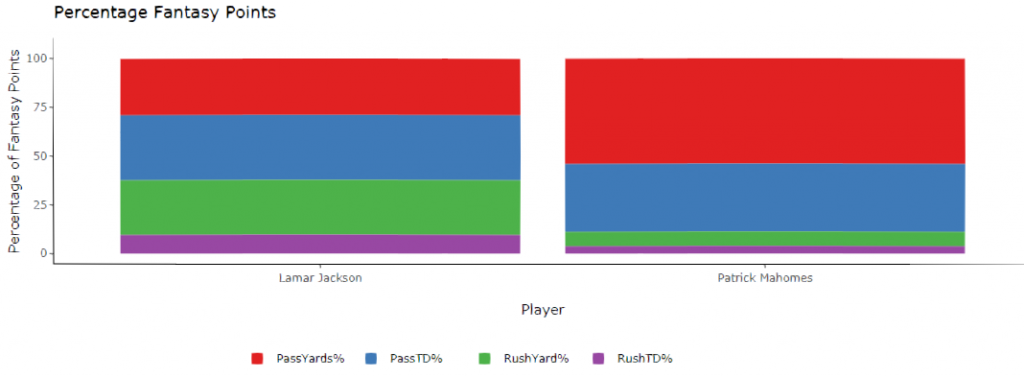
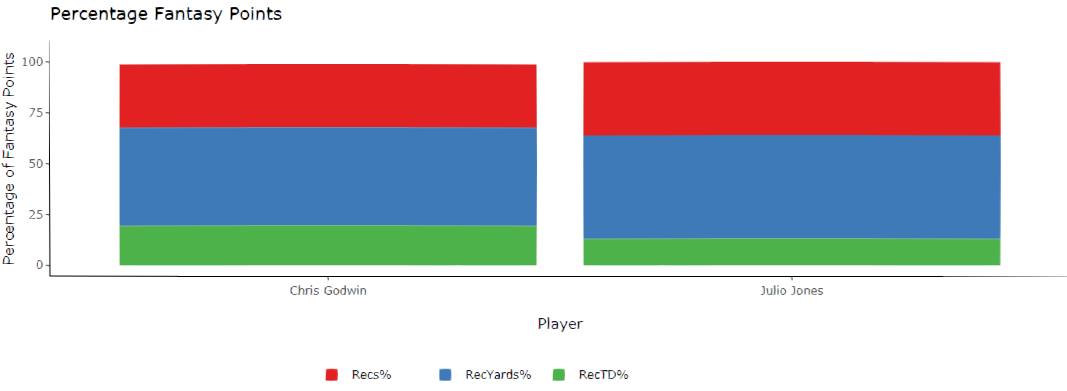
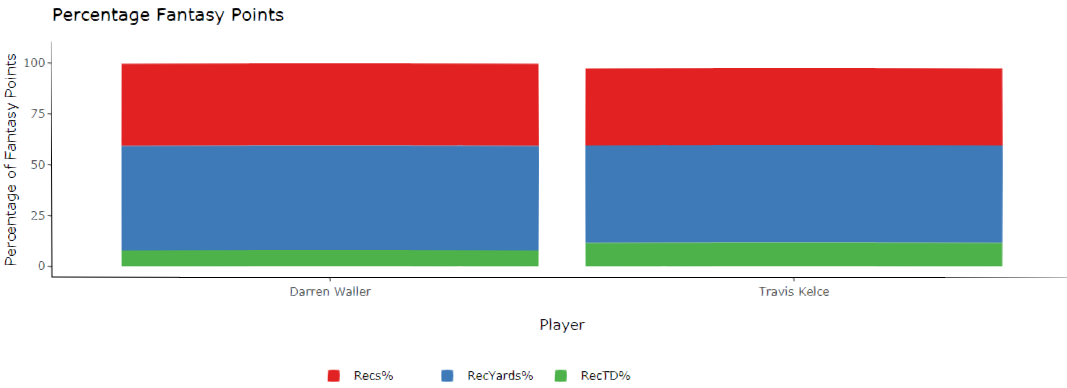
Here are examples of the graphical results you would see when selecting either of the other three positions.
Quarterback
Wide Receiver
Tight End
Analyzing The Results
So, now it is time to break down the results. When looking at the two running backs from the original search above (Henry and Gurley). You first will look at the graphic results. You can see below that Henry clearly had a much larger portion of his fantasy points via rushing yardage (match the color code to the graph), both players scored a similar percentage via rushing touchdowns, and Gurley scored via receiving work at a higher percentage and considerably larger percentage via receptions.
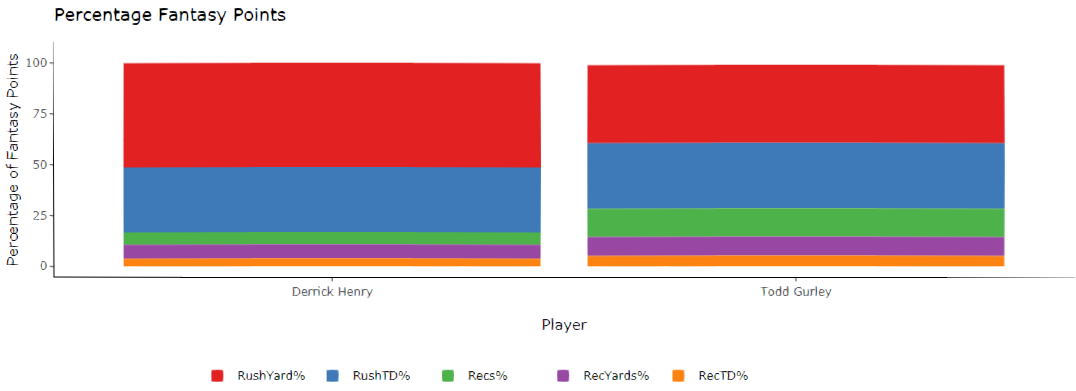
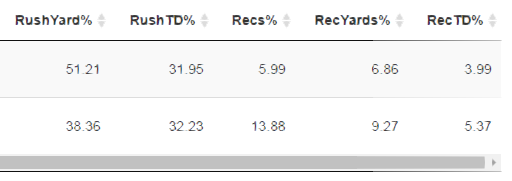
The exact percentages can be found in the player(s) statistical data below the graph.
Again we see that Gurley was clearly a more effective receiving threat in terms of his percentage of fantasy points earned. He was slightly better when it comes to percentage gained by scoring on the ground, but Henry dominated in terms of percentage of points gained with all the work done on the ground between the goal lines.
We have an idea of the player(s) effectiveness and efficiency in each of the different scoring categories, but we do not have the whole picture yet. Now we can look at the volume the player received and the results it produced.

Above we see that Henry received much more volume as a whole with 328 total opportunities (321 touches) compared to Gurley’s 273 total opportunities (254 touches). The extra volume (as well as other football-related factors) produced a much larger yardage total and a larger amount of touchdowns, despite Gurley scoring on a larger percentage of rushing touchdowns.
Even though Gurley was more effective on his volume via the percentage of receiving work, there is deception in the numbers. Each player had nearly identical results on their receiving work despite Gurley catching 13 more passes on 25 more targets. The 13 point PPR boost fails to really dent the production Henry was responsible for in 2019.
Have these players always been like this? Well if we look back over to the “Select Year(s)” search option, we can slide back a year and see what these players did last season or in any year of their career. Here are the results from setting the year to 2017, for example:
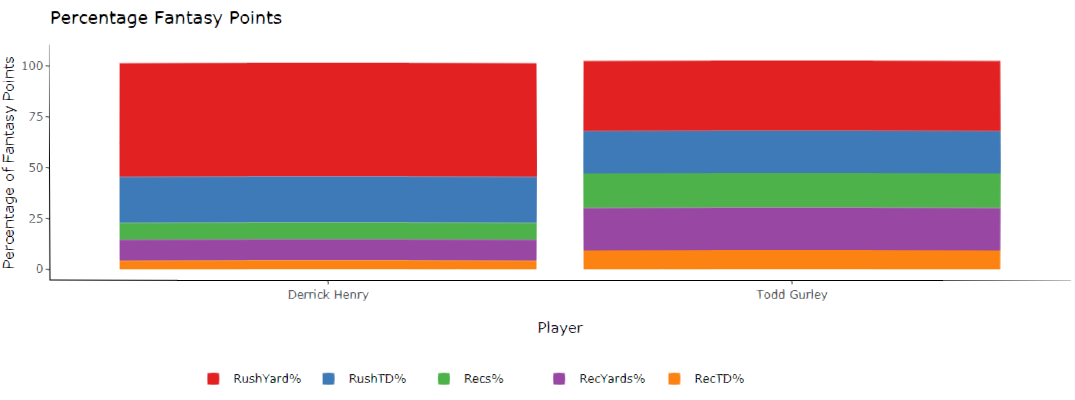
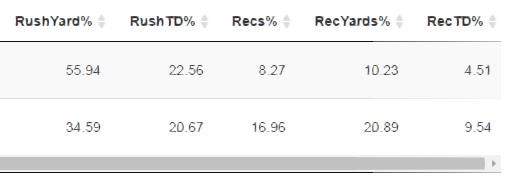
You can see in the two images above that both players are similar to their 2019 season in terms of percentage via rushing yards, and are even very similar in percentage via rushing touchdowns, although both categories are lower than their 2019 seasons. Gurley, though, was scoring points at much higher levels through the air than Henry. As we see in the volume and production numbers in the player data, Gurley out-produced Henry on every level and the former Georgia back dwarfed the former ‘Bama back in PPR scoring formats.
By looking at every year, you can start to get an idea of the path that each player is on, whether they are producing at a sustainable/unsustainable level, or an endless number of other takeaways to be interpreted from your search results.

Player Database
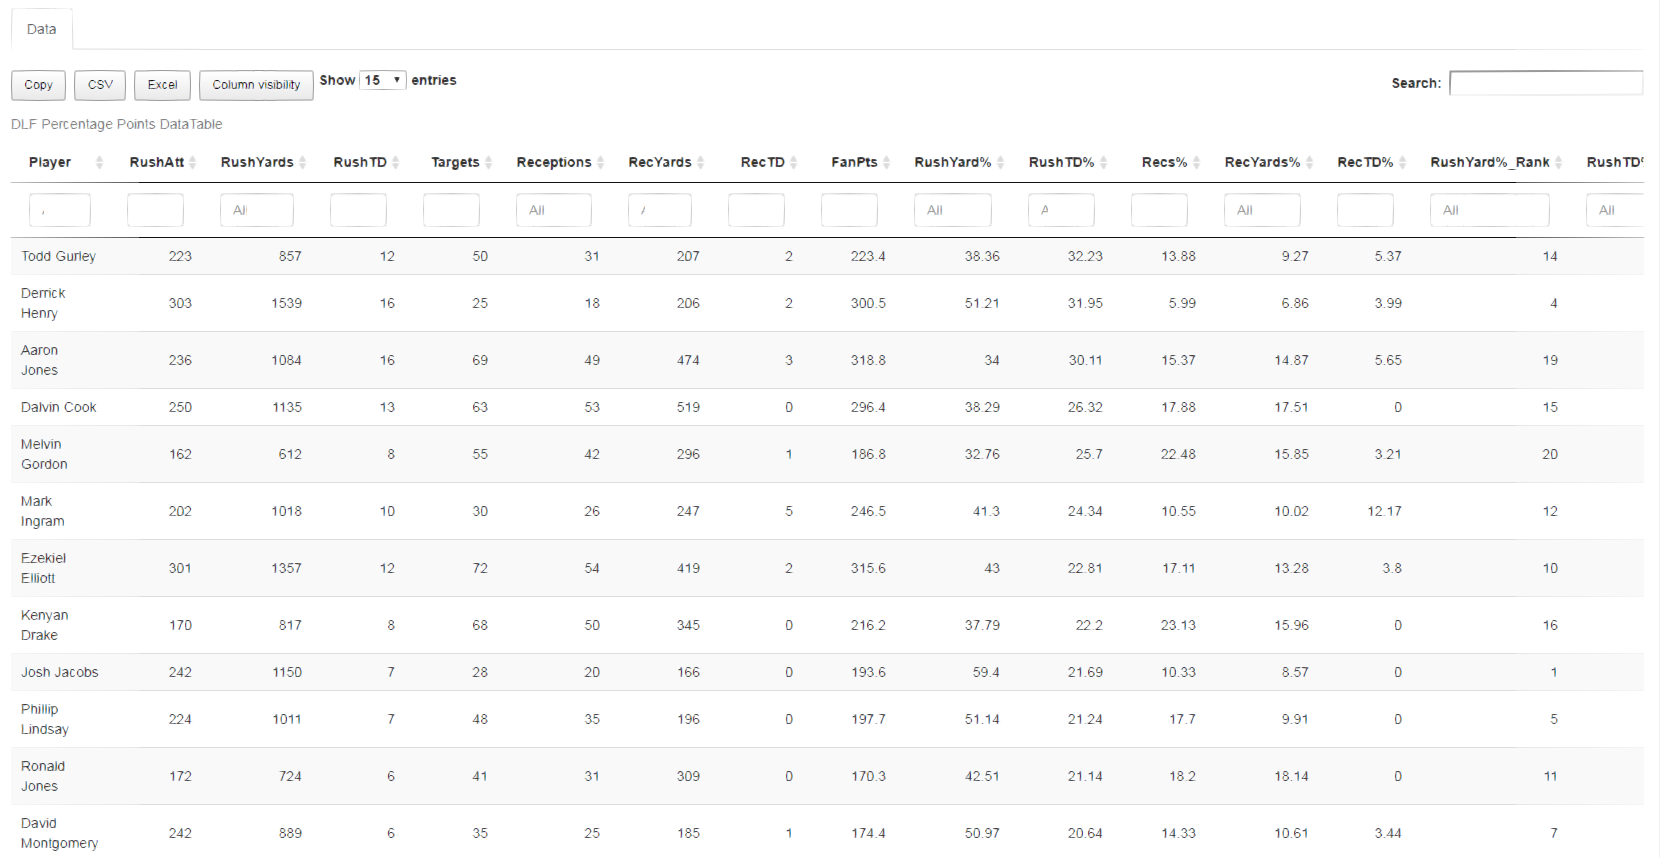
Now, we get back to the player statistical database. Above, we can see an example of the running back database and the same is available for each of the other three positions. As we discussed previously, the database can be used in accordance with the app as a whole or independently by itself to search through hundreds and hundreds of players available for analyzing.
You can develop player comps, find players to buy or sell based on their path as we looked at above, look for players that could break out the next season, and much more!
Here is an example of how to use the tool together with the database.
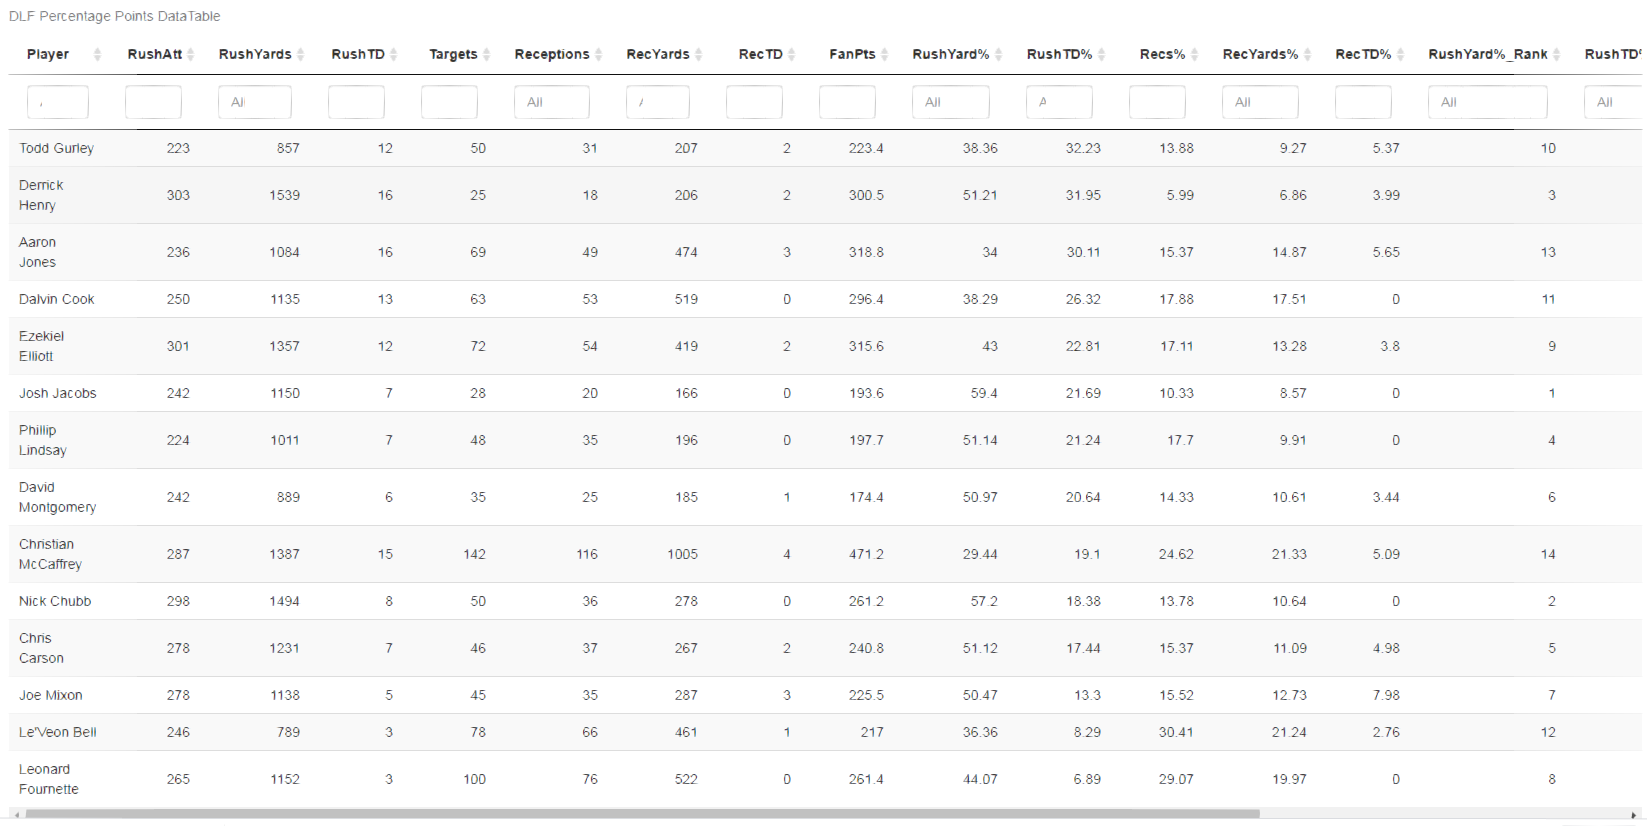
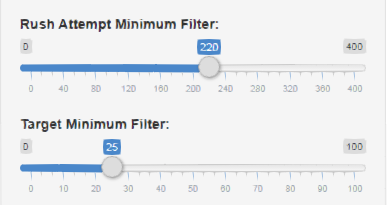
We used the filters in accordance with the minimum attempts and target totals from the two players we analyzed (223 attempts, 25 targets). The app filters through the database to provide us with the results above, displaying all players that met or exceeded the selected thresholds set by the filters. Now we can see all the similar players in the given year at the given position.
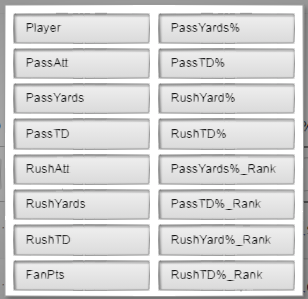
Another cool feature with the database is that you can download your results or all of the data for your own use. There is the option to obtain the database via Excel format, CSV, or simply copying and pasting on your own sheet. You can find the options for this at the top left of the database next to the counter that displays the number of players (entries) being shown and the option to filter out certain columns you do not wish to view by clicking on the column visibility box and selecting from the options in the second image below.

Wrapping It Up
Thank you for checking out the Percentage Fantasy Points App tutorial. Hopefully, this will get you started with your analysis and help you to maximize the functions and abilities of the great new tool from Addison Hayes that can now be found on DLF. You can check out more of my new work at DLF as well as my old work at the newest part of the DLF family, FFStatistics. Follow as well on Twitter (@willson8tor).


