ADP Breakers: Mike Williams vs. Chris Godwin
When it comes to owning a dynasty team, one of the biggest aspects owners need to master is to accurately value ascending players, especially young wide receivers. Even more important is the ability to take two players of similar value and attempt to project future success. The two players we look at today in March ADP, go right next to each other in most drafts and often are considered reasonably close in value. Rightfully so, as each player has perceived additional targets coming in the 2019 year. With that in mind, let’s take a closer look at Mike Williams and Chris Godwin.
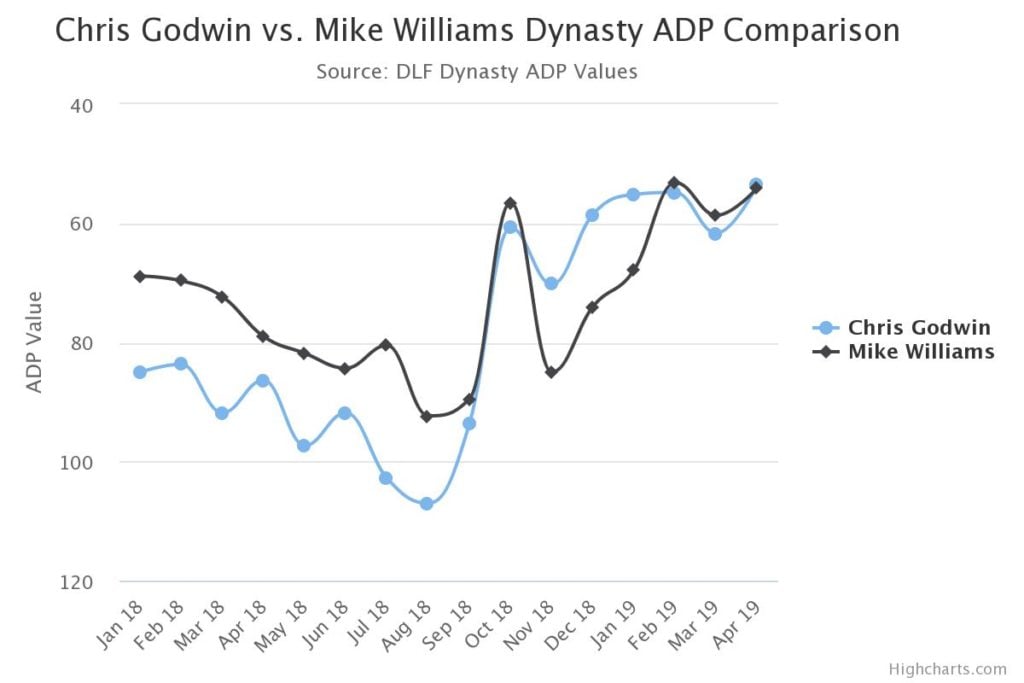
This series of articles is to help dynasty owners evaluate players head-to-head, then use the data to provide player value, depict future production, and break ties between two players when in a startup dynasty draft.
Before I begin any of these articles I try to go to the public of twitter and get a read on the general view of these two amazing players.
As you see from the link above, each of these players is generally considered to be close in value, giving a slight edge to the emerging Tampa Bay wideout, Chris Godwin. Let’s take a look at the fantasy production of each of these players to see how this perception came about in the community.
FANTASY PRODUCTION
Below is the 2018 fantasy weekly production for each of these players:
[am4show have=’g1;’ guest_error=’sub_message’ user_error=’sub_message’ ]
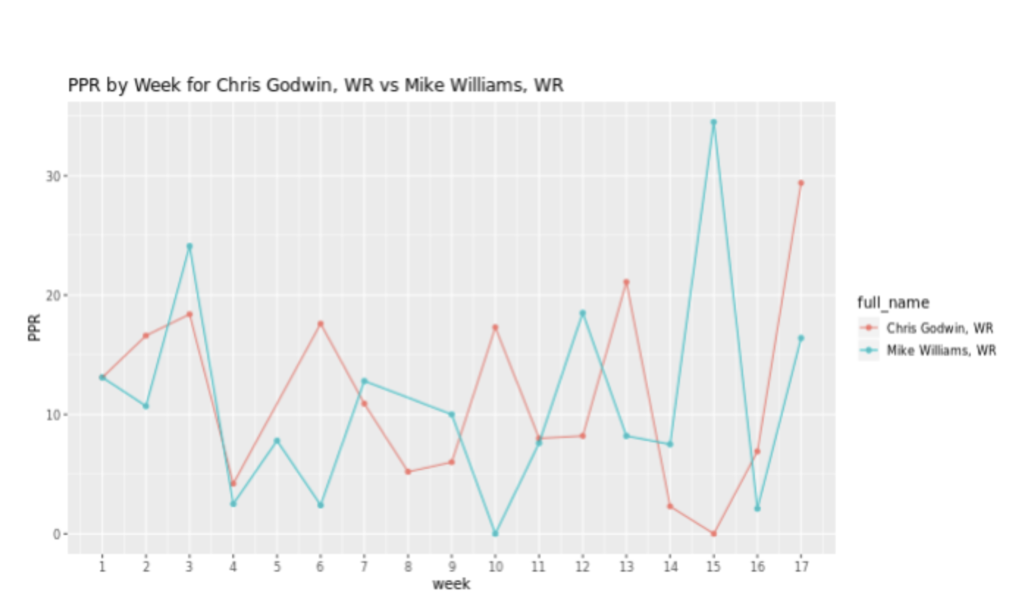
Graph from FFstatistics
Above we can see how comparable these two players really are. Looking at the data, each player had their peaks and valleys and no set of points seems to draw much attention. Both players had a week in which they scored zero points and weeks where they both had more than 25. Although not identical, these players’ fantasy stat lines are very comparable. Continuing with their fantasy production, let’s examine consistency for 2018 as well. Below is a graph that illustrates the percentage finishes for each player from the following year.
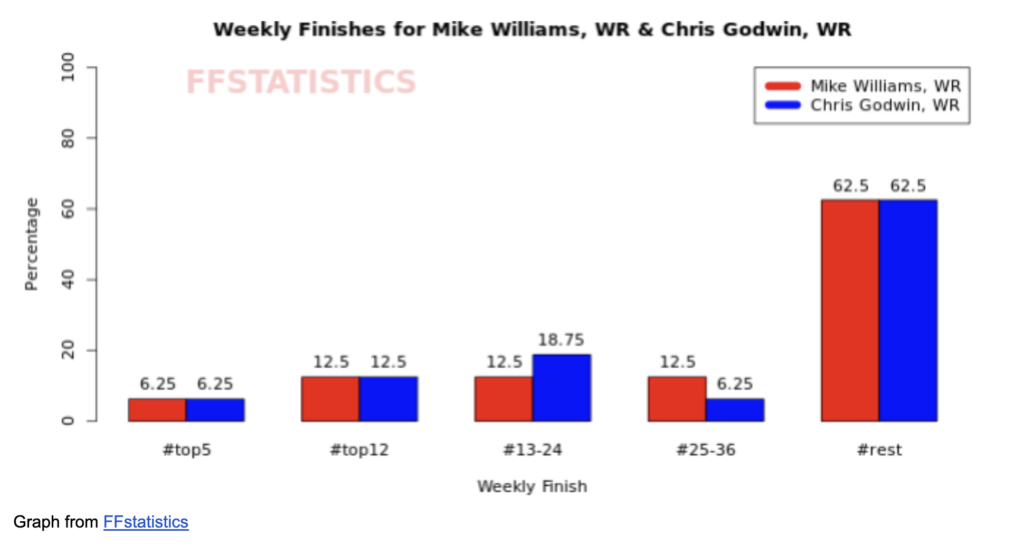
Graph from FFstatistics
The data between these two are closest to identical I have seen for two players. The only slight edge that can be given is to Godwin with an extra 6.25% in the WR2 finishes. However, this is such a slight advantage. Even extending these players’ games to include their last two seasons, we still see little-to-no change.
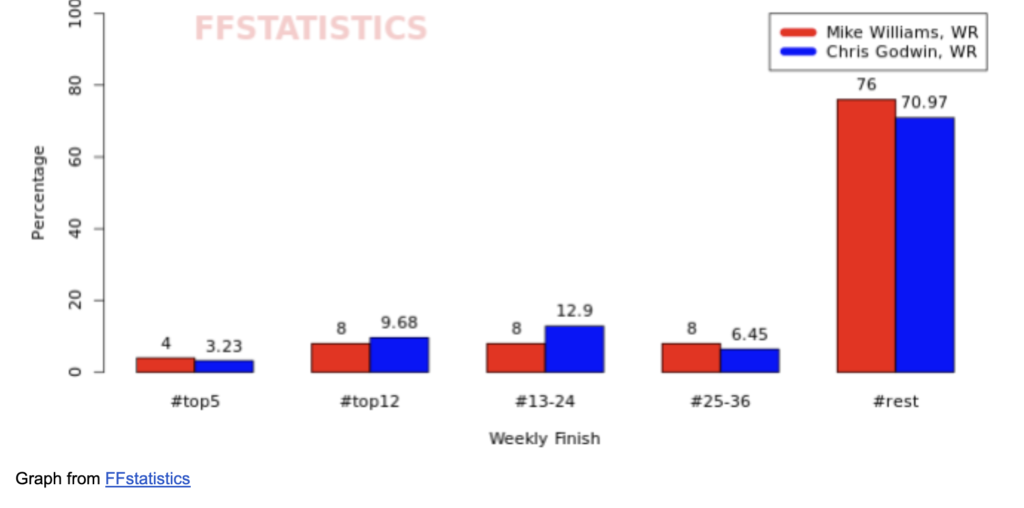
Graph from FFstatistics
Quite frankly, it’s getting a bit interesting as to how close these players are in fantasy production. Before we continue on though, I always ensure the Opportunity Ratio is something that is evaluated – this statistic is calculated by taking the total fantasy points the player receives, divided by the number of targets and/or carries they had. This allows for injury and missed games to become a non-factor. Simply put, what did this player do with the opportunity given to them? Below is the Opportunity Ratio (in PPR formats) for the two main wideouts in question.

Table from FFstatistics
Above we begin to see some noticeable differences between the two players. The first difference is the big production the Chargers wideout had in 2018 – 2.44 fantasy points per opportunity are nothing to be glossed over, but it should be mentioned that a great deal of this information could be a bit skewed due to his high touchdown ratio. Although we can not discount these catches in the end zone, I think the consistency from Godwin might stand out more.
In order to move this forward, we must next look past fantasy and start to look at the nuts and bolts of each of their games.
ON FIELD PRODUCTION
First, let’s look at the most recent production between the two.
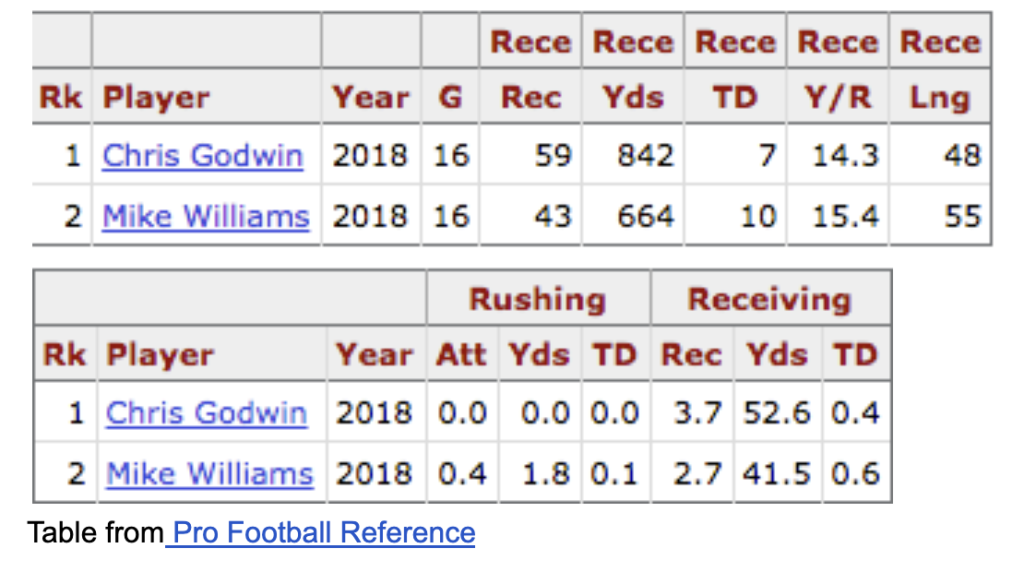
Table from Pro Football Reference
Above we can see some differences start to develop. Although these players both provided similar fantasy results, we can see they do it in different ways. The cherished Charger seems to make his through more touchdowns and end zone play, whereas Godwin brings more receptions and yards to each of his games. Although this seems trivial, it does help get a better outlook as to how their fantasy production is obtained. Personally, I think this leans in favor of the emerging Tampa Bay wideout. Touchdowns are great, but when it comes to projections, they can be difficult to predict.
Moving on, let’s look at targets. Production may happen, but what opportunity are these players getting? Below are the target shares for each week of 2018:
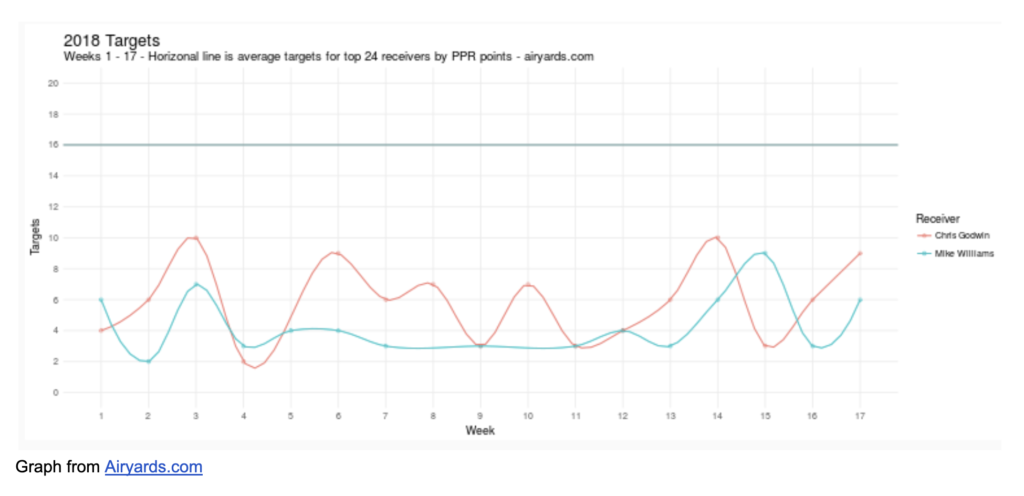
Graph from Airyards.com
As illustrated above, it’s easy to see Godwin seems to see much more opportunity than Williams. However, it should be noted Williams did seem to have a constant number of targets, meaning he still seems to be very much involved in the offense.
The biggest appeal for these players is in the vacancy of targets that have recently come about. Tyrell Williams recently signed with the Oakland Raiders and both Adam Humphries and DeSean Jackson have recently left Tampa Bay. Tons of more opportunities are right there for both of these young players, but the question is how many? Let’s explore:
Phillip Rivers
2018 Attempts: 508
Tyrell Williams targets:
2017: 69
2018: 65
Average: 67
2018 TDs: 5
Looking above, we can determine roughly 13% of targets have been left up for grabs. It is unwise to assume all these targets and touchdowns are expected to go to Williams, but even if a portion does, we can expect further fantasy points to be scored by this young Charger. Now, let’s explore the possible opportunities for Godwin:
Jameis Winston
2018 Attempts: 378
Ryan Fitzpatrick
2018 Attempts: 246
Total: 624 attempts.
Adam Humphries targets:
2017: 83
2018: 105
Average: 94
2018 TDs: 5
DeSean Jackson targets
2017: 90
2018: 74
Average: 82
2018 TDs: 4
Continuing our evaluation, we can see a great deal more passing attempts happen in Tampa and a great deal more targets and touchdowns have left the team (28%, in fact), for a total of about 176 targets. All of these targets might go down due to a coaching change, but even so, it is easy to see where Godwin could see well over 100 targets for the first time in his career.
The final aspect that is to be considered is their Weighted Opportunity Rating – this evaluates what a player will do with their targets and opportunity in a game. Although this is not based on fantasy stats, it does let us see a combination of talent.
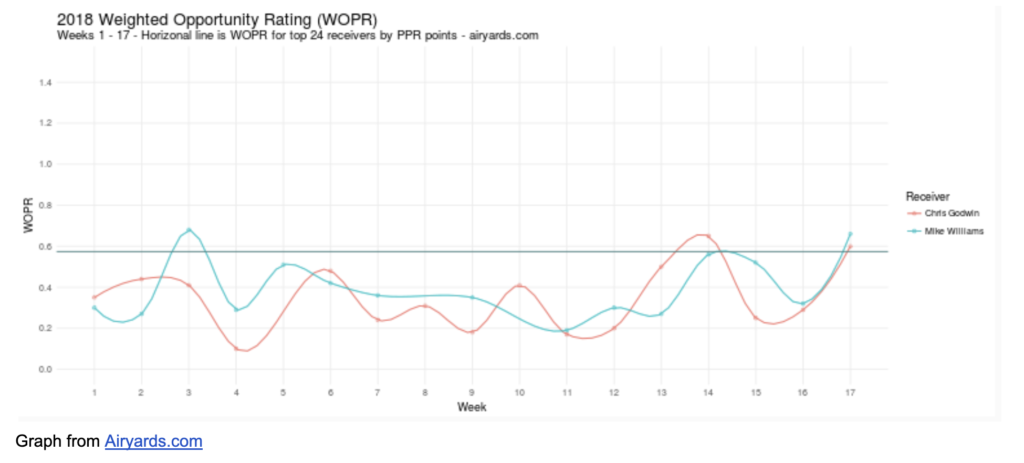
Graph from Airyards.com
Above, we see a great deal of what was already discussed. Two players who seem to be locked into very similar production and very similar talent levels.
CONCLUSION
When doing this type of analysis, it can be very difficult to pick a clear winner. After all, there is a reason these two players are this close in ADP. The general drafter can see the closeness of these two players and each dynasty owner certainly has a preference. However, after all the information I scoured through, I lean toward Chris Godwin out of the two. I know Williams comes with his draft pedigree, but his back injury is something that wasn’t discussed and is still a small factor. However, the biggest factor for me is the absurd amount of targets that have become available in Tampa. When it comes to two “similar” players, I think it is wiser to follow the targets and yards over touchdown receptions. As a final note, I would be more than happy to roster Williams on any of my dynasty rosters and if I could ever somehow turn some Godwin hype into the latter (and extra), I think that is how dynasties are made.
[/am4show]
- Mythbusters: Adam Thielen - May 9, 2019
- ADP Breakers: Mike Williams vs. Chris Godwin - April 12, 2019
- ADP Breakers: Anthony Miller vs Christian Kirk vs Dante Pettis - March 29, 2019


