Target Share and the Value Beneath: What to Expect when You’re Collecting (Targets)
Welcome the week three target share article. If you haven’t read the first two, know that I’ve been playing with the format through the first few weeks. In week one, I looked at unexpected opportunity. In week two, I took snapshots of each team to see who was moving up and down in opportunity. For week three, I’m going to look at those at the top of the opportunity scale.
With three weeks of data, we can start to dig down into the main focus of target share. Who is getting the most opportunity and how are they performing with it? If you imagine the NFL season as a map and games as points along the route, then you can see how three games start to give us a better idea of which direction each team is going. You should also notice that any 90-degree left turn can throw a wrench in our conclusions. So caution is needed. But we can start to trust some of what we see after week three.
Let’s dive right in.
Notes
- I’m using a mix of data from 4for4.com and Airyards.com
- Air yards = the total distance before the player caught his targets (essentially receiving yards minus yards after the catch)
- Regression = a rate should return closer to “normal” or average when it is greatly over or under that average over a long sample size
- WOPR = Weighted Opportunity Rating. It weights target share by the player’s share of air yards. It is one of the most stable (week to week and year to year) opportunity metrics and has extra utility because it describes some of the value in opportunity. It’s also useful because it can highlight potential regression when compared with fantasy points
- It should be noted that the WOPR calculation is my own and imperfect when compared Airyards.com. It has a slightly different player order at times, however, it is ranking them in ranges appropriately
- Zeno James, from ffstatistics.com, has been invaluable in collecting this data on a weekly basis. Give him a follow at @theDude_Z on Twitter
[am4show have=’g1;’ guest_error=’sub_message’ user_error=’sub_message’ ]
Top 24 in Opportunity
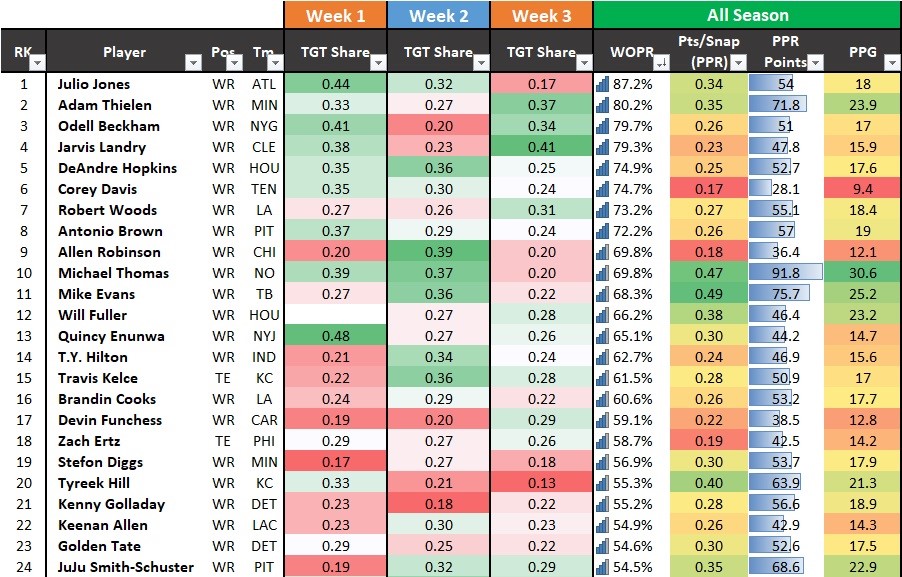
The picture above shows the top 24 players in WOPR. The blue bar in the fantasy point’s column is an easy way to “eyeball” whether a player is over or under producing their overall opportunity with their depth of target taken into consideration.
Some Observations
- Corey Davis is getting a similar opportunity to elite producers this year. This is a positive note for how he’s performing. Unfortunately, the offense is struggling and so is his production.
- Allen Robinson is another receiver getting elite level opportunity but not producing that level of fantasy points.
- Michael Thomas and Adam Thielen are elite but are overproducing even their opportunity.
- Will Fuller is looking to break out this year, finally.
Positional opportunity
It’s difficult to say comparing tight ends to wide receiver is a fair comparison. They get drastically different “types” of targets. What’s more, the tight end position is so inconsistent and underproductive compared to wide receivers that there should be a lot lower standard on what is “good”. So lets’ separate them out.
Wide Receivers
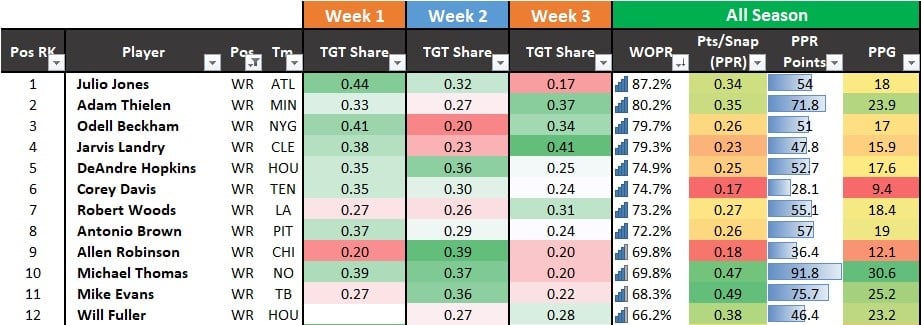
By reducing to the top 12 players in opportunity, we see the diversity in production at the highest level of targets and air yards.
- Michel Thomas will likely not keep up the same pace. This is not to say he will underproduce (suddenly start getting 7-9 points a game) but his weekly points per game will likely fall come closer to that of Antonio Brown or Robert Woods right now by the end of the season.
- Adam Thielen and Mike Evans should, at some point, also see a reduction in their PPG as well.
It should also be noted that there is no strict timetable for these potential regressions. Both have high flying offenses right now. Michel Thomas has one of the most efficient QBs in the league to bolster him (and he has never been a slouch himself since entering the NFL).
- Corey Davis underproduction is even more striking.
With the (hopefully healthy) return of Marcus Mariota, I’d look to see his 9.4 PPG increase before the end of the season. What’s more, the fact he’s “earning” this level of target share in and of itself is a breakout for the second-year player.
- Allen Robinson is the only other player in the top 12 to under produce nearly as drastically as Davis.
The Bears are also suffering at the quarterback position as their sophomore signal-caller tries to find his feet in the NFL. However, I expect Robinson to see some better numbers moving forward even if Mitchell Trubisky continues to struggle.
Players who are underperforming could keep “under” producing for similar reasons that Thomas and Thielen could continue to see higher PPG than normal. This could well be something intrinsic to their play or situation which demands a lower average. With Robinson, I’d suggest we have enough evidence of him being #good to suspect he will bounce back at some point. Davis should, but it’s harder to make the case he will.
Tight Ends
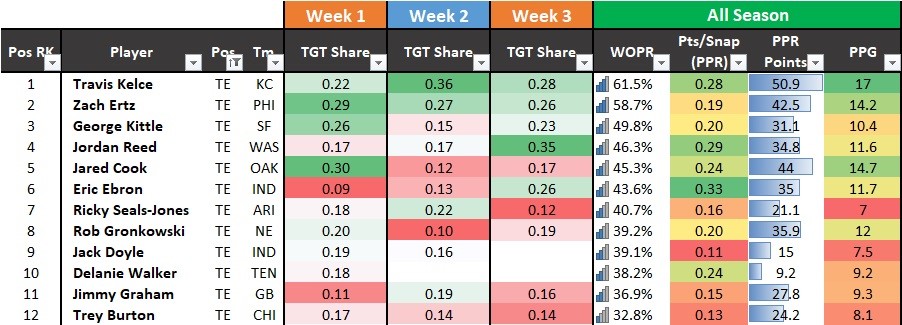
- Ricky Seals-Jones has been inefficient with his targets.
Earlier in the season, I suggested that Trey Burton and Seals-Jones would see a rise in production based on their opportunity. While Burton has seen some of that improvement, Seals-Jones continues to lag behind. What’s more; he saw his target share drop in week three and will now have a new quarterback making decisions behind the line of scrimmage.
Since I believe that opportunity is intrinsic – at least mostly – to the player, we could well see an increase in his targets moving forward. If so, he should earn better numbers eventually.
- Jack Doyle is now on the list of tight ends underproducing with the highest level of opportunity for the position.
Doyle has missed time but even when we adjust for that, by looking at his PPG, we see he is “due” greater production.
- Travis Kelce and Jared Cook have both been overperforming even their high levels of opportunity.
We should see a reduction in their PPG. No prizes for guessing which I think is more likely to sustain this high level of efficiency and which I expect regression from.
Running Backs
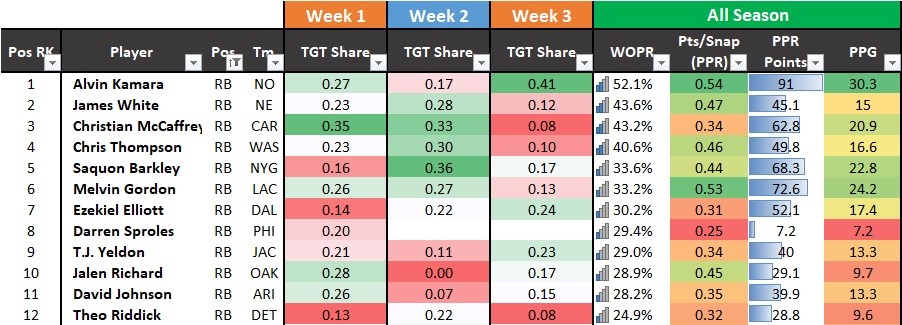
These metrics are not the best way of measuring running backs. The targets are so different for these players and tend to have low air yards behind them. This means it tells us less about their performance. It should not be nearly as stable or #good at forecasting performance.
However, I thought since we are seeing such an explosion of receiving work from running backs, it might be interesting to show their chart. Take it for no more than that at this point. It is not something we can build into our decisions just yet.
- David Johnson’s overall target share is not that bad, in fairness.
I think the company he is keeping in overall opportunity does a great job of explaining the inefficient and bizarre way he is being used through three weeks. His opportunity should look a lot more like those in the top seven. Hopefully, we see a change in this number very quickly.
- Kareem Hunt does not make the top 12 in receiving opportunity for running backs.
This confirms a lot of our worst fears about his role this year… not that we needed to hear it again.
What to expect moving forward
- Expect Allen Robinson to do better soon. Around 15 points per game should be expected at this level of volume, not his current 12.
- Expect Ricky Seals-Jones to do better if his opportunity bounces back. Around eight points per game would be fair.
- Expect Michael Thomas and Adam Thielen to see a reducing in their PPG by the end of the season to between 15-18 points per game.
- Jack Doyle will catch a touchdown instead of Eric Ebron. He should be around nine to ten points per game and not seven.
Thanks for checking it out, you can see snapshots of the target share for each NFL team here.
[/am4show]
- Peter Howard: Dynasty Fantasy Football Superflex Rankings Explained - March 6, 2024
- Dynasty Target and Regression Trends: Week 15 - December 23, 2023
- Dynasty Target and Regression Trends: Week 14 - December 16, 2023


