Rookie Wide Receiver Rankings Judged by Age-Sensitive Production
I’ve been building a model to rank wide receivers. No wait, come back! I promise this won’t get too “math-y”. I’ve spent the better part of two weeks updating, re-learning, and re-“being awed” by how much smarter other people are then me. All of it was in order to re-assess how I’ve been evaluating rookie wide receivers. Two weeks may not seem like a lot of time but, believe me, through the wonders of Excel and math, it definitely is.
Anyway, thanks to Anthony Amico (@amicsta) – who suggested it and talked me through some points – and others I’ve learned from in the fantasy community, I’ve been practicing very simple data modeling using “multiple linear regression.” But I’m not going to let this get too heavy on the how. Instead, I’m just going to explain what I valued, why I valued it and then give you the results. We good? Cool.
What I Valued
Production. I care about production in college more than anything else when evaluating wide receivers. I think we are at the limit of what we can learn about rookie players until other information is collected from College, like aDot. Outside of that miracle, we’re pretty much left with how much of a team’s yards receptions and touchdowns a player actually created. Or, market share for short.
[am4show have=’g1;’ guest_error=’sub_message’ user_error=’sub_message’ ]
To find what kind of production I want to target, I stole a trick I’ve heard JJ Zachariason (@LateRoundQB) mention a time or two himself on his podcasts. I made a list (good for me, right?) of all wide receivers since 2006 who produced multiple 200 point PPR seasons. I tweaked it a little. For instance, I removed players who only have two such seasons but are no longer in the NFL. I want more upside than that. I think this does a decent job of creating a sample (careful, Pete, careful. No more math, you’re free!) of players who have been the most consistently valuable for dynasty. You can see the list and all the data because I uploaded it to a Google Sheets. (Just in case you’re the type of person, like me, who wants to see the wizard behind the curtain, every time.)
You can use this any way you want. Make your own metric, model or print it off and turn it into a hat, it’s up to you. Just be sure to thank – or at least remember – that the vast majority of the raw data I used to make this list come from the good folks at Pro-Football-Reference.com but mostly from Sean (@Slavin22). He’s now my new best friend, or at least seriously cool.
I used this list to calcu…find the highest, lowest and average level of production at every age as well as a few of their college counting stats. I highlighted their Best and Final, years as well as their career AVG in market share of receptions, yards, and touchdowns. I also included their combine stats if you are into that kind of thing. That’s all on the Google Sheet.
This gave me an idea of the type of production that best reflects the players we want at the position.
One of the things I found was that about half the sample had no difference in their production between the ages of 18 and 20 and their entire career. This is because – surprise – around half of them only played in College until they were 20. Of those that played in college after that age, some noticeable trends existed.
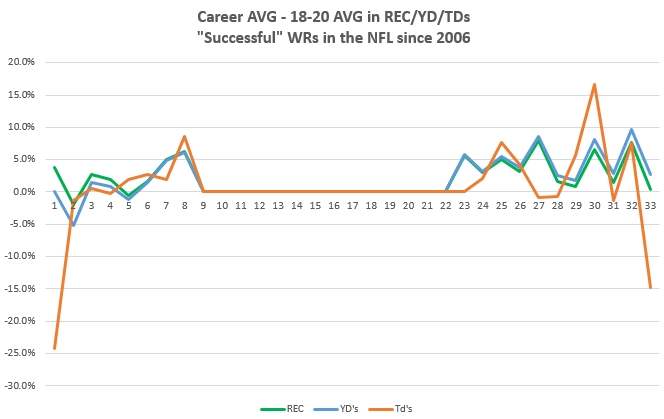
Ignore the touchdowns, which are always about opportunity. Most successful wide receivers who stay in college after 20 increase their percentage in team yards and receptions significantly – bar two minor examples. In other words, they keep getting more opportunity and producing more yards with it. So players who stay in college longer have to improve their yards and reception market share to be viable.
The exceptions are Alshon Jeffery and Michael Crabtree, but neither lost more than 5 percent of either. (You can see their loss at the end of the graph number 2 and 5.)
With this in mind, I gave more points to players who produced before the age of 20, as well as an increase in yards and touchdowns after that age. I included breakout age in the model as well.
What I Tested
I compiled another list (again, fancy!) of all wide receivers from 2001 to 2015 along with all the categories of production I’d decided to weight. I then ran a “multiple linear regression” (don’t leave!) it’s a fancy way of saying I asked Excel to make a fictional graph with all of this data do some specific math and compare the players production to the fantasy points they produced in the first three years of their NFL career.
The Adjusted r^2 (roughly, how well the data I’m using explained the PPR points) came out to 0.33 – 1.0 would be a perfect fit. Honestly 0.33 seemed suspicious because it’s too high. Getting over 0.2 is pretty good when it comes to trying to predict the future. So I have tweaked it favoring one thing or another based on the list of “successful” wide receivers using something I called “WhipperSnapper” for fun. I have another article about that one specific thing. It’s basically College Dominator for the young. All, done. Phew.
In the end, this helped me build an equation I could use on any wide receiver I had data for to “project” a players fantasy point in the first three years. The standard error (how wrong it can be) is over 150 points, so yeah, I’m not a swami. But it’s pretty good for a historian.
I used the equation against past draft classes to see how it did. I wanted to make sure Tyler Boyd wasn’t going to come out over Michael Thomas or anything crazy. Okay, yes, that did happen. But by and large, the ranks didn’t seem crazy. Odell Beckham won his draft class (I couldn’t have predicted that, obviously. This model is based in part on what he did, so this is a description) and the most productive players ended up above the fold at least. And they were also highlighted by the ranges the successful wide receiver list highlight beyond that.
The Ranks
I’m not a fan of the combine. I mean, I love watching it and I think it’s great. But using the numbers to evaluate rookies has proven a little “noisy”. It’s not that I don’t’ think there is value in athleticism. I just don’t think we understand how the combine tests equate to that value in the NFL. So, these ranks will be set until I get more data I know how to use. That leaves the NFL draft which is also included in the model equation.
Here are the top 16 players in my “wide receiver model”. Or rather, my rankings. As you know (unless you skipped, you darn skipper *shakes fist feebly*) these are based mostly on the share of touchdown and yards the players produced for their teams and the age at which they did it – but using math and not just an open eye ball assessment.
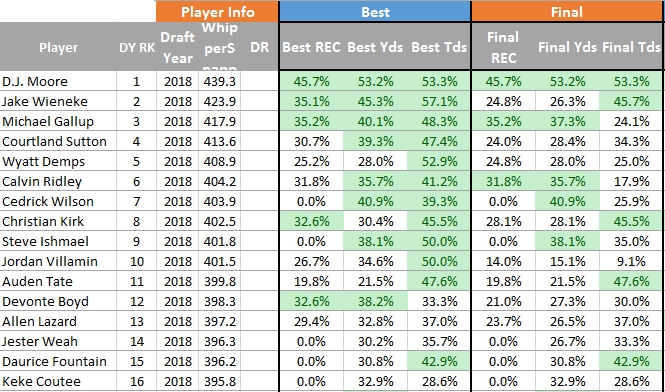
Technically those numbers in the “WhipperSnapper” column are the PPR projections these players in the first three years in the NFL. They will change a lot once I have draft data to include in the model. Also, the one thing I know for sure is they won’t be right. However, I think it’s the best projection based on the most useful information we have to evaluate wide receivers right now.
This is not what I thought I’d be doing when somone said “you should check out some models.” But it was interesting at least.
I hope you think so too.
Thanks for checking it out.
Peter Howard.
[/am4show]
- Peter Howard: Dynasty Fantasy Football Superflex Rankings Explained - March 6, 2024
- Dynasty Target and Regression Trends: Week 15 - December 23, 2023
- Dynasty Target and Regression Trends: Week 14 - December 16, 2023


