The Safety Dance
Recently I got up on my soapbox and decried the languishing value of running backs in both an NFL and dynasty sense. In the most objectively subjective way possible I considered every NFL ball carrier and wide receiver drafted in the past five years in order to discern whether such things as bust rates, late round gems, and odds of hitting on a stud or starter truly differed between the two positions. Upon the conclusion of my analysis, it became readily evident that running backs were being straight up hated on by the dynasty community.
However, in this real-life investigation one element remained missing – the concept of dynasty value. NFL production should always reign supreme, but dynasty owners are a fickle crew, and their player valuations can often remain unchanged even in the absence of fantasy numbers. As such it stands to reason that the next phase of this analysis should focus on the value fluctuations of running backs as they compare to receivers.
To do this, I want to focus on two specific subsets of players from the previous article – those in the “To be determined” (TBD) and “Rosterable/Spot Starter” (R/SS) tiers. While Studs, Starters and Busts are essentially locks to achieve their respective dynasty values (herein represented by their respective ADPs), the TBD and R/SS crowd stand to oscillate based on a relative dearth of actionable data. This of course begs the question – given the lack of meaningful production, which position will be affected to a greater magnitude? Continuing, which position remains a safer investment over time, despite the lack of NFL prowess?
[am4show have=’g1;’ guest_error=’sub_message’ user_error=’sub_message’ ]
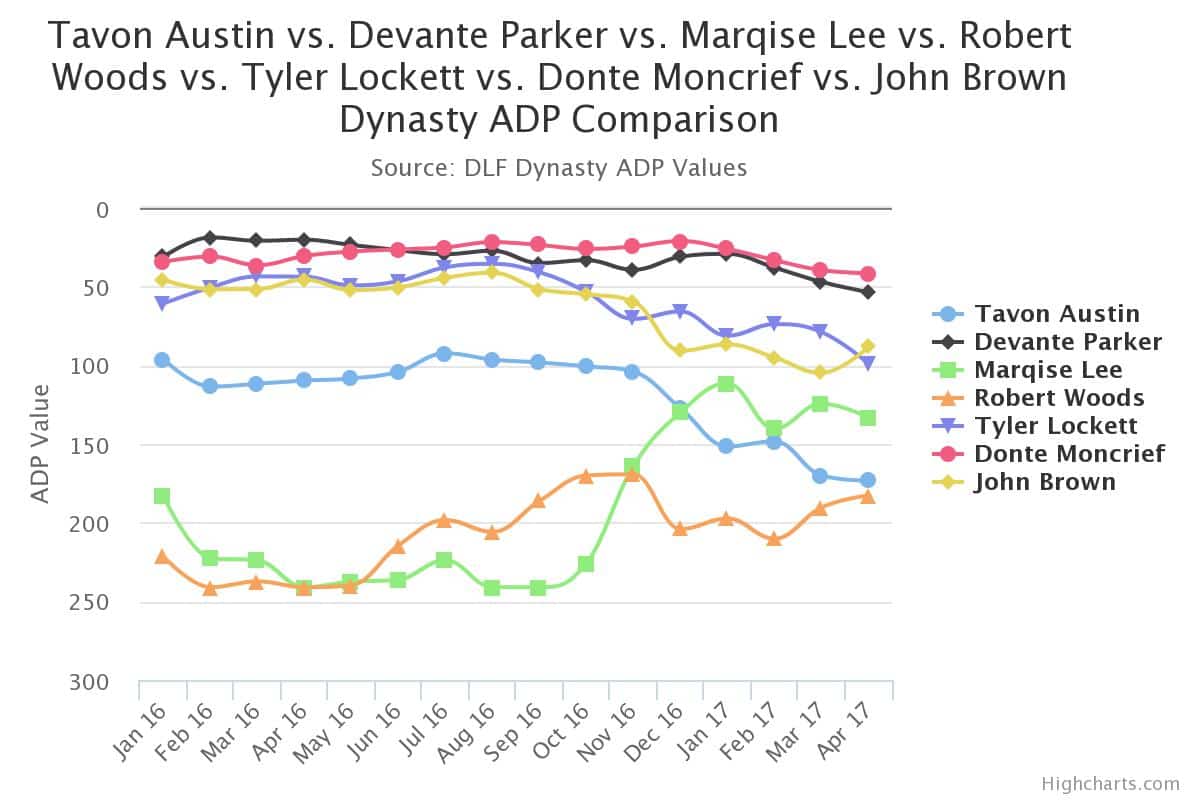
Fortunately, our ADP Player Comparison charts provide a perfect snapshot of value differential dating back to the beginning of 2016. This allows for a monthly glimpse into peaks and valleys for each player, along with an overarching trend. With this data, we can truly determine who the safer investments are.
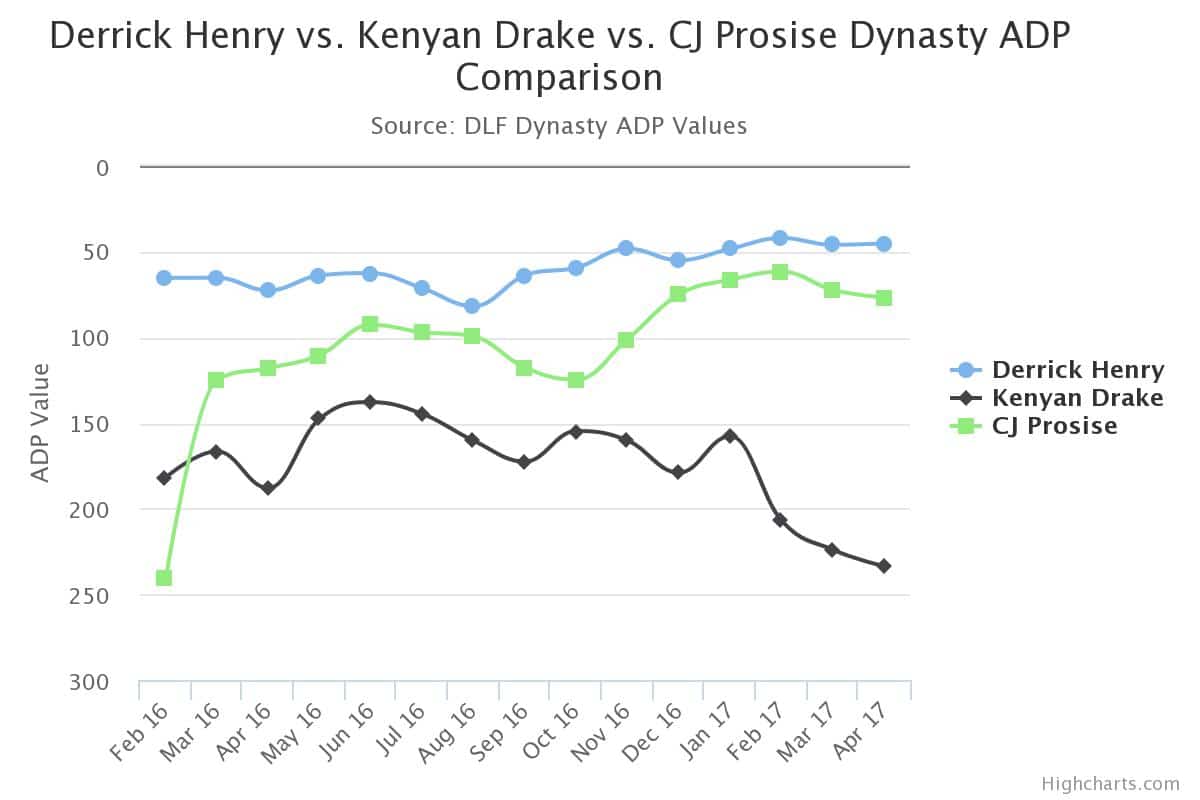
With that introduction in hand, let’s get started by looking at the more variable zone, the TBD players. That said, here’s the chart for the round 1-3 TBD running backs:
Next, let’s consider the results for the round 1-3 TBD wide receivers. Note that I’ve broken this down into two separate charts (round one, and round two/three), due to the volume of players.
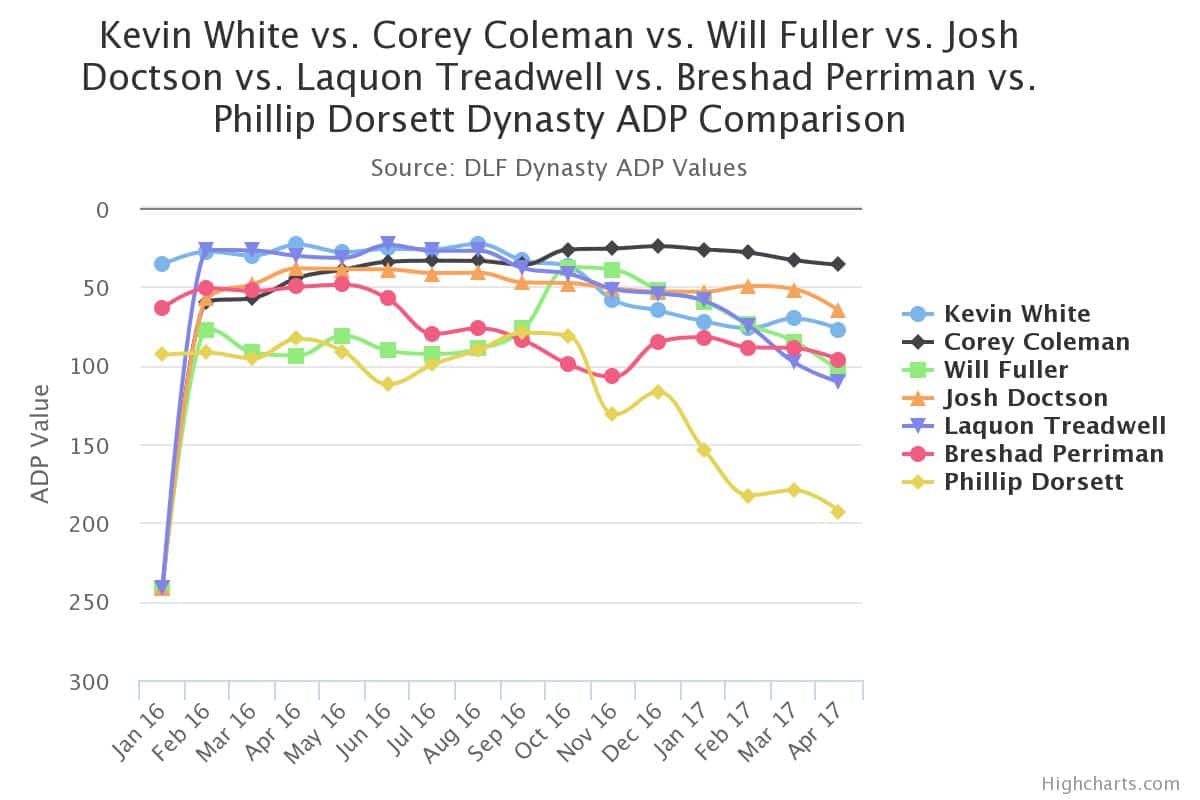
Here are the first round players:
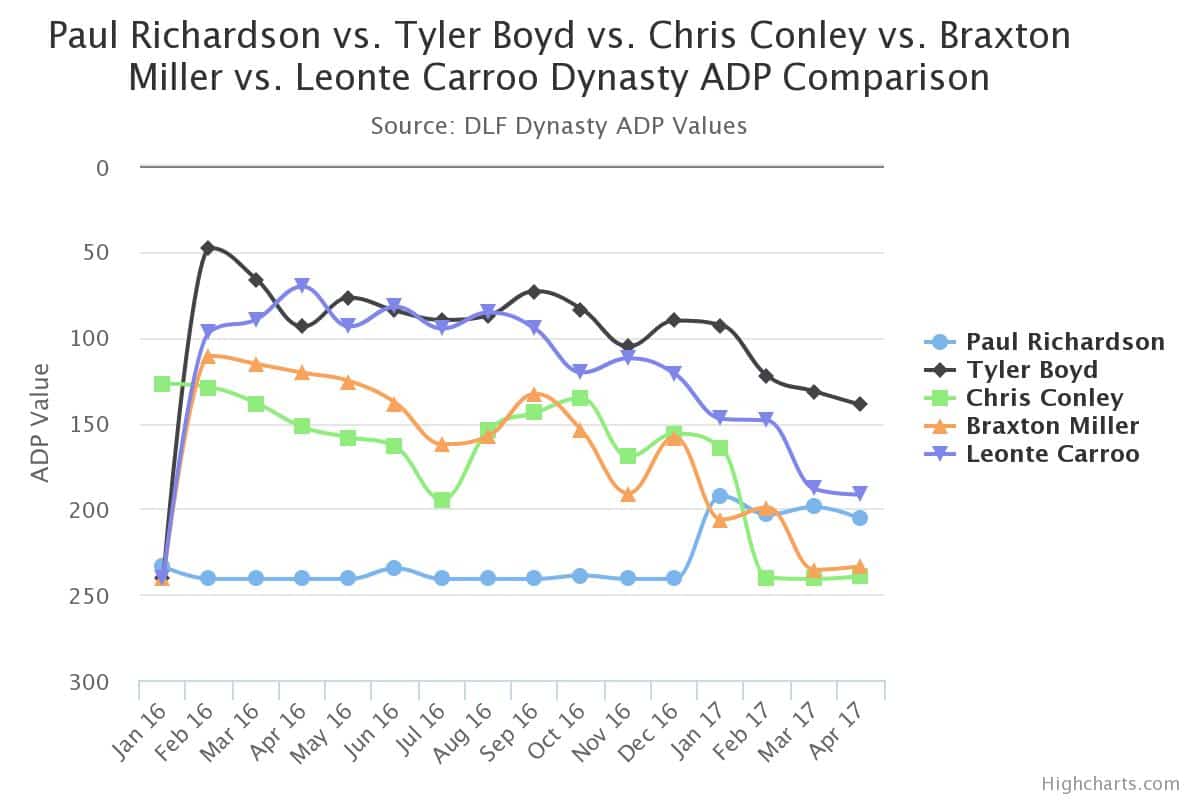
Next, rounds two and three:
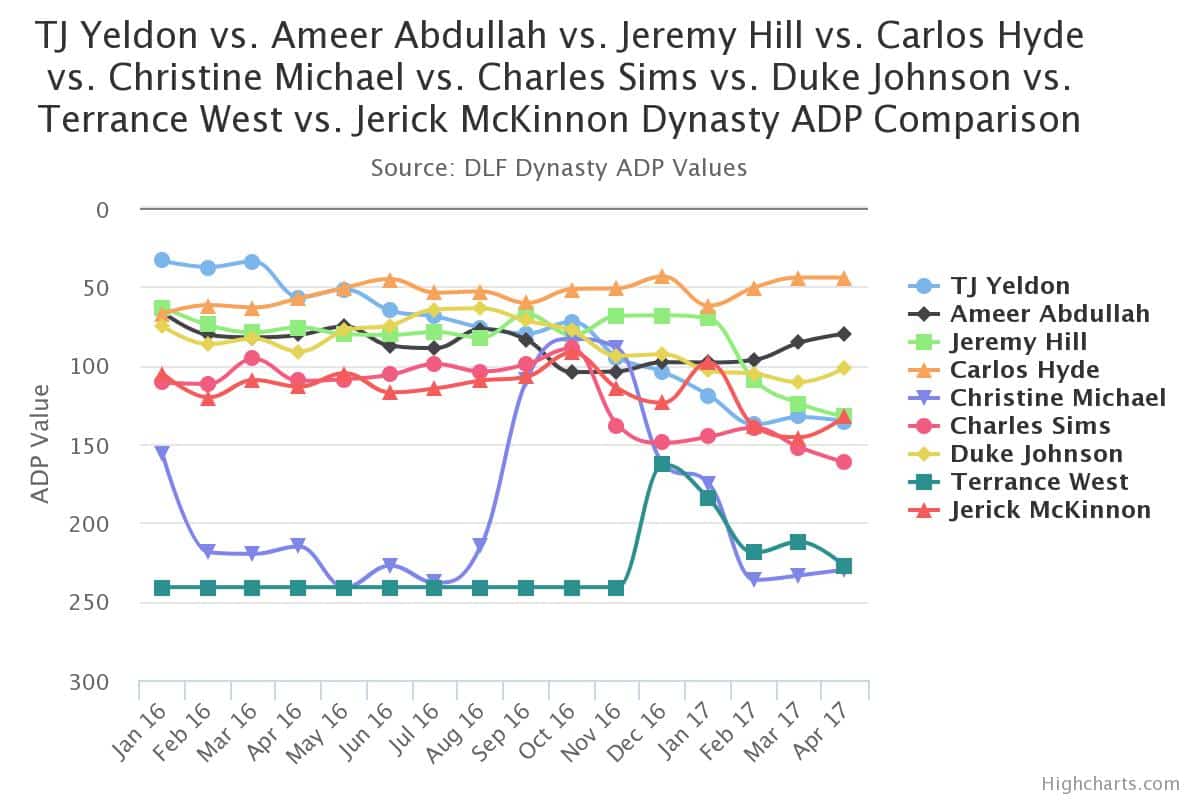
From here, let’s next consider the R/SS crew, once again starting with the ball carriers:
Our final chart will consider the R/SS wide receiver (rounds 1-3 shown):
Conclusion
So what do we really have here? I’ll attempt to sum it up in the following table.
| Zone | % Gained Value | % Stagnant | % Lost Value |
|---|---|---|---|
| TBD RBs R1-3 | 66.7 | 0.0 | 33.3 |
| R/SS RBs R1-3 | 16.7 | 16.7 | 66.7 |
| TBD WRs R1-3 | 22.2 | 11.1 | 66.7 |
| R/SS WRs R1-3 | 28.6 | 28.6 | 42.9 |
The above table shows the percentages of players in each zone who either gained, retained, or lost value. I’ll attempt to explain the conclusions below, but the following caveats should be noted:
- For players who weren’t on the radar (i.e. undrafted) at the outset of the time period (January, 2016), I used their first actionable (drafted) data point.
- Players who were considered to have gained value did exactly that. Players who were considered stagnant didn’t lose more than approximately one round of value. Players who were considered to have lost value dropped more than a round in ADP value.
- It’s imperative to remember we’re dealing with players who were drafted from 2012 to 2016. As such, looking at a roughly 1.5-year snapshot doesn’t always tell the full story. However, fantasy football, and even dynasty, has always been somewhat of a “what have you done for me lately?” proposition, so this data matters.
With that in hand, let’s take a look at the results:
- When comparing the TBD players, it’s hard to make a concrete analysis due to the lack of contenders from the running back crew. However, given the data, the receivers certainly didn’t win the day. Two running backs (Derrick Henry and CJ Prosise) gained value, while only one (Kenyan Drake) lost it. What’s even more interesting is that Prosise has remained relatively stagnant even after the Seahawks signed former Packer Eddie Lacy.
- Conversely, dynasty value insulation was somewhat hard to come by for the wide receivers. Notable first round fallers include Laquon Treadwell, Kevin White, Breshad Perriman, and Phillip Dorsett (four of seven). Even after his robust start to the year, Will Fuller sank back down to his preseason ADP. Only Corey Coleman and Paul Richardson truly gained value, and with P-Rich, he was a non-factor prior to the 2017 playoffs.
- When it comes to the R/SS crew, it’s a different story. Receivers who at least showed something held/gained value better than their ball carrying counterparts. This aligns with the more traditional theory that we’re living in a receiver-centric dynasty universe. However, it also does lend credence to the belief that NFL output does in fact matter. The R/SS players are guys who should no doubt be part of your roster, and who you’d even feel comfortable starting on a weekly basis if it came down to it. But with that said, it’s clear to see that when previously highly thought of ball carriers fall off, even if not to the level of bust status, they became devalued at a more rapid pace.
So all told what are we looking at? In all honesty I was coming into this expecting it to be a whitewash in favor of receivers, but that only wound up being partially true. While I’d like to see more numbers as it relates to the outcomes for the TBD running backs, it’s impossible to ignore that their dynasty values are just fine. Surprisingly, it was the TBD receiver group who actually wound up losing the benefit of the doubt in the minds of the masses. This was mitigated by a reversal of fortune when considering the R/SS crowd for the pass catchers, but I don’t think it’s unfair to posit that, on the whole, running backs held their value as well (if not better) as the pass catchers.
So does this safety dance exercise matter? Who knows. But in my mind, it’s yet another piece of circumstantial evidence asserting that you can draft how you want to…you can leave receivers behind.
Follow me on Twitter @EDH_27
[/am4show]
- Dynasty Fantasy Football Mailbag: Justin Jefferson Or A Bundle Of Draft Picks? - April 23, 2024
- Dynasty Fantasy Football Mailbag: Is Kendre Miller Valued Unfairly? - April 17, 2024
- Forgotten Dynasty Veterans: Bottom Tier - April 9, 2024


