A Closer Look at Efficiency in IDPs
To paraphrase Tony D’Amato, “IDP is a game of inches. The inches we need are everywhere around us. On this team, we fight for that inch, we CLAW with our finger nails for that inch. ‘Cause we know when we add up all those inches, that’s going to make the difference between WINNING and LOSING”.
Everyone who watches NFL games knows the sleeper candidates. Everyone knows the top players, and everyone knows the hot new rookies. But in the world of IDP, there’s still a chance to know more than your opponents. In this article I’ll be talking about fine margins and discussing how to add fractions of points per play to your team. That doesn’t seem like much, but as with Tony, when you add them all together it makes a difference. If you don’t use every edge you can find, someone else in your league will.
The problem with fantasy football is it’s big. There are a lot of players involved and simply remembering everyone is a tall order – let alone evaluating everyone. In the IDP world the player base is that much bigger of course. At the very least there are 400 or more additional players to keep track of that non-IDP players don’t have to worry about. So we look for ways to make it easier on ourselves. We look for rules of thumb and assumptions that we think are true.
“Rookie corners score highly”
“4-3 DEs are much better than 3-4 DEs”
“WLBs and MLBs are far better than SLBs”
“No free safeties score consistently”
“Pass-rushing LBs aren’t worth rostering”
Some of these are no doubt correct and sensible. But I also think that they might sometimes cause us to make additional mistakes because of false beliefs. So I set out to investigate how we can create rules that help us quickly identify potentially productive IDPs and limit the number we need to seriously consider.
My Method
[am4show have=’g1;’ guest_error=’sub_message’ user_error=’sub_message’ ]
NB – for this article I’ve used a scoring system of solo: 1.5, assist: 0.5, sack: 5, TFL: 1, INT: 3, Forced Fumble:2, Fumble Recovery: 2. DL assist: 1
The number one indicator of IDP scoring by some distance is snap-count. Lots of people track the percentage of snaps a player receives but given the discrepancy between defensive snaps on different teams I like to concentrate on pure number. And there is a good correlation towards scoring:

You can see that towards the right of the graph the variance increases. Some players with a high number of snaps scored very well. Some scored very badly. To understand what rules really govern IDP production we simply need to work out which players score well and which do badly.
I simply looked at every player to record a defensive snap in the NFL in 2016 (I’ll include more data as it’s available) and divided their points by their snaps. That gives an efficiency score – which can be described as the number of fantasy points they get every time they line up for a snap.
For 2016 and excluding players under 120 snaps (for simplicity’s sake) that figure was 0.14.

If a random player lined up for 100 snaps, we’d expect him to score 14 fantasy points.
We’re not interested in random players of course. We’re interested in good players. So I started to cut that data to see which players are more efficient than others.
By Position
The most fundamental category is position, and naturally we’d expect different positions to score very differently. Using MFL designations it looks like this:

Of course, this may vary in your own leagues and scoring systems but here you can clearly see that linebackers are the dominant animal. That’s to be expected given their role on the field – they have more opportunities to make big plays in the run and pass game than other positions. I imagine anyone reading this will know that picking a LB in your IDP flex spot is generally a good idea.
By Team
Every team runs a different system with a different philosophy and style, and we can see which teams lend themselves to good IDP production. When we look at efficiency by team there are significant differences:

The Cardinals, Packers and Chargers made a lot of plays for the time they were out on the field. Down at the other end the Saints, Browns, and Colts failed to make many big plays.
However, it’s not that simple. What on earth are the Texans doing down there? They were amongst the league’s best defenses, weren’t they? To understand, we need to go far deeper into the data.
Defensive Tackle By Team
Within position groups there is also significant variation by team, as we all know some systems favour different positions. Defensive tackle efficiency by team looks like this:

The Jets, for all their faults, were tough to run on for much of the year. Only four teams recorded a better yards per carry figure than them, and Steve Mclendon was at the heart of things. At the other end we see the Texans. As much as everyone loves him, Vince Wilfork was not a good player this season.
Also note the distribution by scheme – at the bottom you get teams who deploy a classic 0/1 technique like the Texans (Wilfork 0.06 pts/snap), Raiders (Dan Williams 0.07), Broncos Sylvester Williams (0.08) and Saints (Tyeler Davison 0.07).
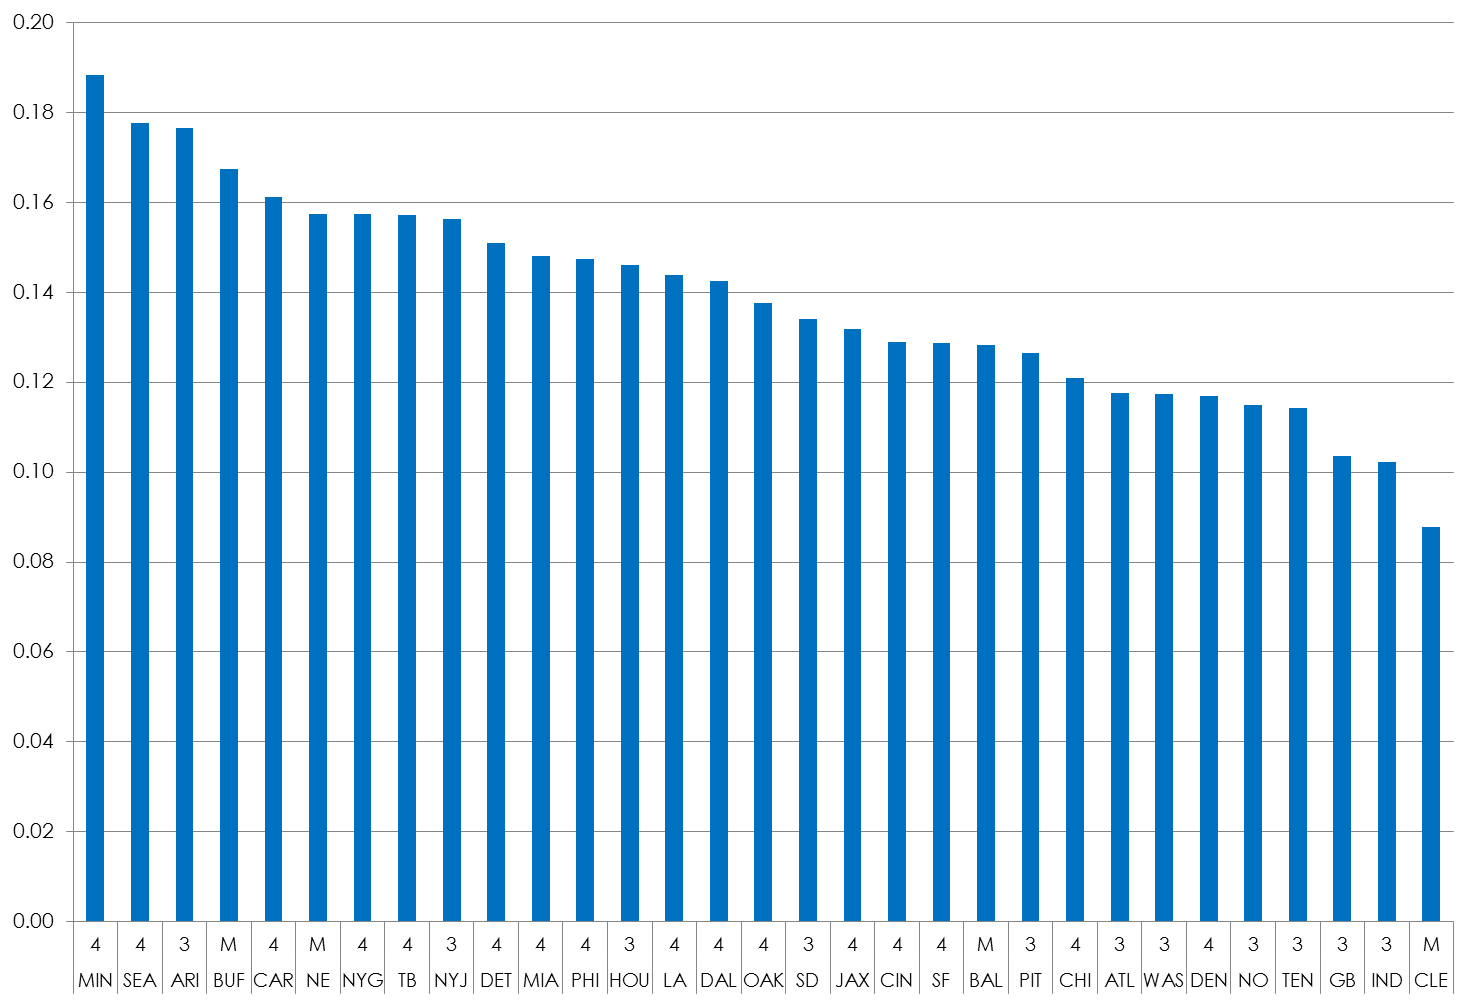
Defensive End By Team

This is one of the more straightforward relationships. As you’d expect, teams with a dedicated, effective pass rush tend to be more efficient. The letter above the team name denotes the scheme. Unsurprisingly, teams with predominantly three-man fronts are less efficient. This is one of the core IDP beliefs, so it’s good to see it hold true.
Unsurprisingly, the Vikings and Seahawks come out on top. Between those two teams they boasted Everson Griffen (0.16), Danielle Hunter (0.29), Michael Bennett (0.18), Cliff Avril (0.16) and Frank Clark (0.21). The Cardinals are surprisingly high, but that was driven by an outstanding season by Calais Campbell (0.2)
At the bottom end it’s worth noting that there some good players still with Jadaveon Clowney (0.19) chief amongst them.
Defensive Linemen
For defensive tackles and defensive ends, I advocate picking players by scheme. Here’s the comparison for all linemen:

3 denotes 3-4 teams. 4 denotes 4-3 teams and M denotes multiple front teams (Ravens, Browns, Bills, Patriots).
Although the differences are small here, it’s still significant across a season. 19 defensive linemen played 800 snaps or more in the NFL last season. An extra 0.02 points/snap would give them an extra fantasy point each and every game. Going back to Tony – this is how games are won and lost.
Linebacker By Team

The Packers are a fascinating example here. Joe Thomas, Jake Ryan and Blake Martinez started off the season in a rotation but by the end of the year Thomas was the clear starter dominating snaps (although Martinez was injured). However Martinez was the clear leader in efficiency. He managed 0.22 pts/snap whereas Thomas and Ryan reached 0.16 and 0.19 respectively.
Deion Jones was excellent as a rookie. He ended up with 0.22 pts/snap with over 800 snaps. If he can maintain that form, he’ll be a real force. Vic Beasley has been well documented as being a generally efficient player in 2016. He led the league in sacks but his conversion rate from pressure to sacks was astronomical.
Down at the other end, the Jets failed to make plays. David Harris and Darron Lee played over 1,400 snaps between them and both only reached 0.14 pts/snap. We’ve already seen that the plays are made by linemen in the Gang Green D. Avoid this situation where possible.
Cornerback By Team
Any IDP player worth his salt will tell you corners are hard to predict and useless. I think we can change that. Here’s how the teams stacked up last season:

Traditionally we look for high-volume corners who allow catches but make tackles. Given the Colts were sixth in passing yards against and ninth in completions, this should apply to them – but they’re dead last in efficiency. At the other end, the Cardinals were fourth-best in passing yards surrendered. So it seems that volume alone doesn’t denote efficiency.
We also believe rookie corners tend to score better because they get picked on by savvy quarterbacks. This is CB efficiency sorted by years in the NFL:

There’s definitely an advantage for younger players but it’s by no means conclusive. My takeout from this is avoid veterans rather than focus on rookies.

This is the top ten most efficient rookies. There are a lot of young players here but also a lot of players who are the weak links in their CB groups. Justin Bethel was opposite Patrick Peterson. Troy Hill was behind Trumaine Johnson and Lamarcus Joyner. When given the choice, pick corners who have much better teammates.
Safety By Team

There is a wide margin here and I think it’s mainly scheme based. First look at the bottom teams.
Pittsburgh, Cincinnati, Seattle and Jacksonville have amongst the clearest delineations between strong and free safety in the league. And low efficiency free safeties drag team scores down. Mike Mitchell, (0.11), Rashad Johnson (0.09), George Iloka (0.10) and Tashaun Gipson (0.06) and Earl Thomas (0.09) were all payers to avoid even though they saw the field a lot.
At the other end, you find more teams with flexible safety partnerships. In Tampa you have Brad McDougald and Chris Conte, Minnesota has Harrison Smith and Andrew Sendejo and Kansas City has Ron Parker and Eric Berry. All of them are players who can do a bit of everything from both spots.
Detroit are a special case. They manage to hit the #2 spot here because of variety. The gave significant playing time to Tavon Wilson, Rafael Bush and Miles Killebrew at strong safety, and they were all efficient. If one player manages to secure that spot next season, he could be an IDP star.
Top Efficient Players
These are the ten most efficient players in 2016 (with 500 or more snaps):

Four of the top five are pass rushers who had excellent seasons. Nick Perry flew under the radar a bit but managed 11 sacks. The only other player in the top five was a defensive back asked to fill in at linebacker. Position is irrelevant here as we’re looking at overall efficiency rather than benchmarking against position, but it still shows that big plays are the key to efficiency. You can do it through tackles, but in the case of Burfict, Brown, Kuechly and Alexander they all play a pivotal role on their defences.
As always with sizeable data sets, there’s likely to be some #regression. Hunter and Bosa may well make up for that with higher snap counts, but keeping up the same rate of production would make them superheroes rather than football players. It might be worth selling some players with very high efficiency. Vic Beasley is a prime candidate here.
How Do You Use This?
It’s all very interesting, but we’re in the business of winning fantasy leagues. How will it help you do that? Here’s what I think we can use:
- Try and do the same thing with your league’s scoring settings. Running it against a slightly different scoring system is fascinating, but not as accurate for your own decisions as it could be.
- 4-3 defensive linemen are much better producers all around. You probably already knew that, anyway but it’s very clear in the data.
- Some schemes clearly favour certain position groups. Take advantage of these. 2-deep safety teams, Packers linebackers, etc. You need to know these.
- Targeting rookie cornerbacks is overrated. Instead, go for the worst starting corner on each team.
- Free safeties really are bad. Don’t pick them thinking INTs will make up for it – they almost certainly won’t.
- This should be helpful in auction drafts. In auctions, put inefficient players with big names on the block early.
That’s a whistle-stop tour of my findings so far. Hopefully it can help you build a team ahead of 2017. I’ll be revisiting the information over the summer to try and figure out what efficiency can tell us about individual players going forwards.
[/am4show]
- Ten IDP Fantasy Football Stats You Need to Know after Week 16 - December 29, 2023
- Ten IDP Fantasy Football Stats You Need to Know after Week 15 - December 22, 2023
- Ten IDP Fantasy Football Stats You Need to Know after Week 14 - December 14, 2023


