The Marshall Plan
The problem I have with every Brandon Marshall detractor is that they’re not actually arguing against the player himself. Let’s consider the most popular negative viewpoints:
- He’s too old
- He has character concerns
- You can’t ignore his injury history
- No matter what he does, his trade value is too low
- Ryan Fitzpatrick is going to turn back into a pumpkin and Marshall will suffer
To the first point, sure, Marshall is no spring chicken. He turned 32 this year, meaning it’s entirely possible he could soon be reaching the age cliff that has previously tanked many a stud receiver. But this isn’t so much an argument against Marshall as it is against the law of averages. Of course, in order to have an average we must have a range, and often times we’ll have outliers. Father Time remains undefeated, but examples exist (Terrell Owens, Reggie Wayne, Tim Brown, Jerry Rice, and Cris Carter) of receivers who bucked the trend and played well into their mid-to-late 30s.
[am4show have=’g1;’ guest_error=’sub_message’ user_error=’sub_message’ ]
The second argument, while perhaps muted over the past few years, does help explain why Marshall is on his fourth NFL team. But by all accounts he’s much more dedicated to his craft than previously, and even partakes in charitable missions off the field. This is a non-starter for me.
With the third point, the haters (or at least my strawman argument for the haters) are just embarrassing themselves. Yes, Marshall had a freak injury that ended his 2014 season, but even given that the man has only missed three games in the last five seasons. Next question.
The fourth bullet probably comes closest to hitting home. Even despite his massive 2015 season, Marshall’s July 2016 ADP of 43.0 leaves him as a middling fourth round pick. This is still up from an August 2015 ADP of 61.8, but to many Marshall still more than likely falls into the nebulous region of “depreciating assets.” If your end game is to trade him and recoup some value, he’s likely not the guy you want to own. But once again, to me this falls as a tangential argument instead of one that hits home.
Firstly, ADP does not necessarily equate to trade value, and functions as more of a “team building” exercise. This will almost always skew towards younger, “sexier” players, as the incredibly misunderstood term upside is bandied about. This leaves many players like Marshall, who remain aged but simply produce, as ADP also-rans.
This brings me to the second half of attempting to defeat the “value” argument. ADP is a zero-sum game. If one player moves up, others must move down, and vice-versa. The fact that Marshall has gained value over the past year means owners still clearly like him – they just happen to like other guys more. Much of this can be attributed to the above, as it relates to crafting a valuable team – but many of the players ahead of him have little to no NFL experience (four rookies and seven sophomores, by my count), and could go bust before Marshall even retires. They may be worth more in the trade market and in a startup draft, but that could very well end up as nothing more than a snapshot in time depending on what happens in the next NFL season.
Lastly, we have the most mystifying argument of them all – that somehow the Fitzmagic of the 2015 Jets was the reason why Marshall produced. Yes, the journeyman had a fantastic statistical season after reuniting with former offensive coordinator Chan Gailey, producing the most yards and touchdowns, and second-most completions, of his career. But make no mistake about it – that was due to Marshall (and Eric Decker) making him look good. Because after all…
Brandon Marshall was the best combination of fantasy and real-life receiving ability in the NFL in 2015.
With that preamble in hand, this article is meant to function as a companion piece to my recent 2016 Receiver Wrap-Up. I hope to crank a few of these out over the next month to provide additional, actionable information before the inception of the 2016 season. With that said, you should absolutely read the Wrap-Up first! I’m not going to repeat how I derived the formulas and exactly what they mean here, so you’re going to be lost if you don’t at least glance at that work.
Back to Marshall.
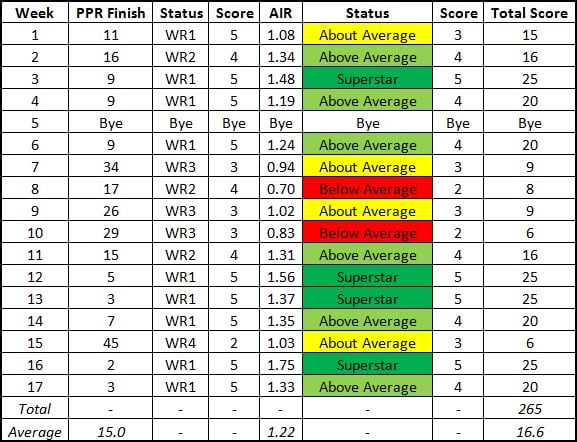
Below is a summary table of his 2015 season, including fantasy finishes and fantasy efficiency (as determined by my AIR metric). Each was assigned a value between 1-5 depending on the weekly output (weekly WR1 = 5, and so on; weekly Superstar AIR = 5, and so on), and those values were then multiplied together. This ultimately yielded both aggregate and average weekly combinatory output, which is shown in the bottom two rows.

Out of all of the 2015 PPR Top-50 receivers, Marshall led the pack in both average weekly and total scores. The former shows that when broken down on a weekly basis, Marshall was more likely than any other receiver to function as both and elite and efficient fantasy asset. The latter shows that he was also able to do it over the course of the entire season, never missing a contest despite many run-ins with the injury report.
You can also see the listing of his weekly finishes (second column from the left). His average weekly finish of 15.0 also led every receiver I chronicled. This means that no matter what additional metrical analysis I performed on the guy, at the end of the day he put up the points where it matters – in our fantasy stat sheets.
As to the “real life football” aspect, Marshall simply knew how to get the ball to where it needed to be at an above average rate. His First Down Ratio (FDR) of 1.26 was ninth best amongst all the Top-50 receivers, proving that he generated first downs at a ratio vastly better than team average (36.2% of the team’s first downs on 28.6% of the team’s targets). Despite having a seasonal AIR score of 1.23, fourth best in the league behind only Sammy Watkins, Doug Baldwin and Allen Hurns, this means he was still actually better in real life. The division of these two ratios, dubbed The New Deal, checked in at 1.03, which remains supremely impressive given his elite fantasy efficiency.
This is where the naysayers like to point out that Marshall’s 14 receiving scores influenced the data. To that all I can say is hell yeah they did! But does that actually matter?
In 2015 Marshall derived the following percentages of points from receptions, yards and touchdowns:

The traffic light “heat map” signature shows that he was below average with regards to receptions, about average for yards, and definitively above average for touchdowns. But as I mentioned in the 2016 Receiver Wrap-Up, the three quantities must always add up to 100% – if one goes up, the other(s) must go down. However, this doesn’t mean that Marshall was inferior with regards to receptions and yards. As it turns out, it was quite the opposite.
Consider the following table, which shows Marshall’s relative ratios for each category (think AIR or FDR, but with player/team receptions, yards and touchdowns comprising the numerator – once again, please read the Wrap-Up for additional explanation):
![]()
You might notice that what was once orange and yellow are now green. What was also previously green has stayed green. In summation, even though Marshall’s reception and yards point percentages fell below average, within the confines of the Jets offense he was actually better than average at procuring both. As for the scores, he was already elite here, and as such it’s no surprise to see that played out in the relative touchdown ratio.
Yeah but, that’s bound to regress, right? Once again, only if you believe in nothing other than the law of averages.
My newest formula, the Aggregate Receiving Computation (ARC, for short), is my most recent effort at a predictive quantity. ARC, which can be calculated for receptions, yards and touchdowns (-R, -Y, and -T in the table below), essentially compares a player’s component percentages of points to the league average, and compares that directly to his relative ratio of accumulating each component of points. I explained this at length in the Wrap-Up, so once again please read that first, but the tl;dr version basically states that the ARC formula roughly equates to a percent error calculation, where the player’s output relative to league output (percentages) functions as the theoretical value, and his output relative to his own team (the relative ratios) functions as the experimental value. If a player’s component percentage was lower than league average but his relative ratio was higher, it stands to reason he’s much better than the percentages suggest. By using league-wide trends as the standard, the ARC scores show when can happen if a team’s offense changes, and whether we should be concerned if the offense gets worse. Below are Marshall’s values:
![]()
The green ARC-R and ARC-Y scores show that Marshall’s receptions and yards can still be viewed in a positive light, and the predictive analysis states that his numbers were no mirage. His touchdowns could be due for minor regression (ARC-T), but his floor will remain strong due to the likelihood that he’ll accrue statistics through the other two components. In other words, the guy will be just fine in 2016.
As I hope I was able to show in the above, Marshall should be treated like a unicorn, not an aging plow-horse. He dominated the 2015 season better than any other receiver, despite being “over the hill.” Age is nothing but a number, and with Marshall, it’s one of the least important ones – my (and hopefully yours) Marshall Plan is to own him wherever I can and reap the fantasy rewards.
You can find the 2016 Receiver Wrap-Up here.
Follow me on Twitter @EDH_27
[/am4show]


