2015 Rookie Pick Trade Value Chart

As we are once again in the middle of draft season, it’s time to take a look at our upcoming rookie drafts. Last year’s class had an unprecedented amount of success, especially at wide receiver, and it looks like that may have caused rookie fever to be even more intense this year. As a numbers guy, I am always looking for a way to quantifiably improve my chances over that of my opponents. That is what led me to create the original Rookie Trade Value Chart.
Two years ago, I released the first version, which was based on arbitrary values established by my personal perceived value of rookies. For obvious reasons, it did not work for the community as a whole. Last year, the chart was completely reworked to include historical ADP data dating back all the way to drafts from 2009. The idea was to incorporate where rookie picks had gone in real and mock startup drafts to gain a greater understanding of how rookie picks were valued over a longer period of time to a greater number of people. In order to not repeat verbatim what my thought process was, you can look at last year’s explanation here if you aren’t familiar with the chart or if you want a refresher on my methods of creating it.
[am4show have=’g1;’ guest_error=’sub_message’ user_error=’sub_message’ ]
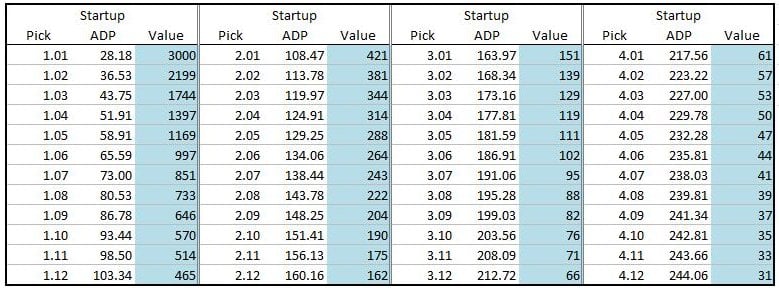
This year, I’ve added in data from March startup mocks run here at DLF to greater reflect current values in conjunction with historical values. This has caused values to change, some slightly and some greatly, for every pick after the 1.01. Every single rookie draft slot in the first 32 rookie picks has seen an increase in ADP this year, which can almost certainly be at least partially attributed to the success of last year’s class. The most influential move has been the 1.01, going from an ADP of 30.31 on the 2014 chart to 28.18 on this year’s version. While that seems like a small move, it has inflated the pick’s value even more than what we saw with last year’s chart.
After seeing the value changes, I asked my twitter followers to pick a side on a four hypothetical pick for pick trades. The results were far from unanimous, but they showed that the chart works as a baseline in several areas.

Surprisingly, most voters preferred the three first round picks to the 1.01 in the first trade. This could be due to the amount of deflation in the value of picks after the 1.01 from last year’s chart. It could prove difficult to get equal value when moving down from the top pick this year, unless Todd Gurley, Melvin Gordon, Amari Cooper or Kevin White are drafted into a perfect situation and see a rise in ADP. All three of the other trades were voted in line with the trade value chart. The third trade, which was essentially equal value, was overwhelmingly in favor of keeping the 1.12. This could show an opportunity to move back and pick up multiple picks if you’re rebuilding or looking to spark a youth movement on your roster.
With last year’s chart, I explained a secondary use – trading veterans for picks based on veteran startup ADP. That works for any veteran drafted after the first pick on the chart (28.18 overall). You can just look at the ADP data provided here at DLF and see which pick or picks combine to make equal value. However, that doesn’t give a numerical value to players being selected higher than the top rookie pick. For instance, what would DeAndre Hopkins’ value be when using the chart? His March ADP was 16.50, which is much higher than where the first rookie pick has historically gone. By inverting the formula I used to determine the values on the chart, we can find Hopkins’ value.
Take the ADP for the rookie 1.01 (28.18) and divide it by Hopkins’ ADP (16.50) – that leaves a value of 1.71 after rounding. Then, multiply it by the 1.01’s pick value (3000), giving us a “pick value” of 5,124 for Hopkins. That means Hopkins is worth the 1.01 and 1.02 based on the chart’s values. The price looks a little steep, but this is still just a tool for gauging initial values. It’s a good starting point.
If you look at Odell Beckham’s point value using this method, you get 50,623, which is essentially every rookie draft pick for the rest of eternity. This method for determining player value for picks going higher than the rookie 1.01 is not going to yield tradable results in most cases, especially with players who have very low ADPs, but it does reveal how much these players can be seen as a cornerstone to building a team.
Remember when using this chart that it is not going to line up 100% with any single person’s own valuation of picks. If used as a starting point in trade negotiations, it can help yield more fruitful results. I am of the belief that ADP is the number one foundational piece in determining rookie market value and this is a tool that accurately reflects how many drafters view these picks, whether they do it consciously or unconsciously.
[/am4show]
- Summer Sleeper: Buffalo Bills - September 5, 2017
- Summer Sleeper: Miami Dolphins - August 14, 2017
- How Broken Is Running Back Scoring? - July 9, 2017


