Updated Rookie Trade Value Chart
Editor’s Note: Zach Bahner is a friend of ours here at DLF. We thank him again for sharing his thoughts on a rookie trade value chart. While no chart will fit every format, he’s done a lot of research to help validate his thoughts. Let the debate begin!
Last year, I released a Rookie Trade Value Chart here at Dynasty League Football and it wasn’t as well received as I expected it to be. With anything like that, there will be differing points of views, but as a baseline, I thought it worked. This year, I was asked if I would like to update it. I was happy to oblige because I think I know what wasn’t working with it – the previous chart contained values that were too arbitrary. The numbers were on a fairly even scale as they went down in value. They were also way more about how I perceived value instead of how the community as a whole viewed their worth.
Then, it dawned on me – it was the community. We, as a whole, are the ones who decide what the rookie picks are worth and we do that through start up drafts. Initially, I thought ADP was going to be a valuable part of constructing this new chart. That was only partially correct. ADP actually skews values quite a bit. A true valuation was in where the first, second, third, etc. rookie went in each draft, not the player attached to each of those picks.
Here is an example.
In one 2013 startup draft, Montee Ball was taken as the #20 overall pick in a draft and Le’Veon Bell at #33. In another draft, Ball went at #36 and Bell at #35. The important part here is that in one draft the first rookie was selected with the 20th pick and in the other the 35th. Basically, the ADP for rookie pick #1, rookie pick #2, rookie pick #3, etc. is what I wanted. Think of it like you are drafting the rights for the 1.01 or 1.02 in a rookie draft.
To compile this data, I took 26 startup drafts dating back to 2009. I then found the ADP of where each rookie pick was selected. There was only one hiccup as I worked through all the averages – Trent Richardson. Richardson was taken so early in 2012 startups, that he actually increased the value of the #1 overall rookie pick by 33%. With the Richardson data, the only way to get equal value for the first overall pick was to trade the second and third picks. The points came out to almost exactly equal (3,000 for the #1 and 3,001 for #2 and #3 combined). This just wasn’t going to work. Richardson was too much of an outlier.
The rest of the data for the first overall picks was fairly consistent, ranging from 20-43 with a mean of 30.31 – this made it pretty clear the Richardson data needed to be put aside. The rest of the picks from those drafts were still used, as they did not skew the data. What we can learn from this is that sometimes there is a transcendent player that just will not fit into a trade chart. That is something individual owners will need to determine.
After compiling all the ADPs for each rookie selection (sans Richardson), I found the percentage difference between each selection. Again, this was not going to work by itself. The regression plateaued too quickly, leaving picks almost equal in value from the end of the second round through the fourth. I tested several different variations on how to get values for each pick before finding a way that worked.
The formula is 1 – the ADP of the pick prior / the ADP of the current pick * the prior pick’s value. I set the first pick’s value at 3,000, and used this formula for each consecutive pick.
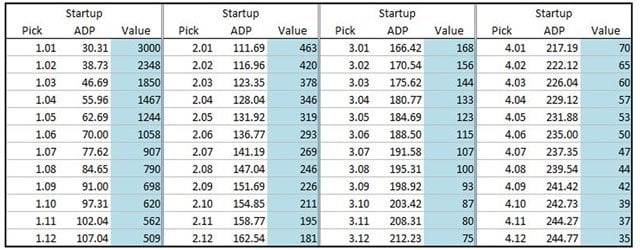
The only change made to this chart is rounding all the values to the nearest whole number. I considered smoothing out some of the values in the first and second rounds to make them easier to use but decided that this lowered the integrity of the chart as a whole.
Aside from just trading picks for picks, there are two other practical applications for the trade value chart. First, let’s say that you were offered Kendall Wright for the 1.05. Rather than just guess at Wright’s current value, you can look at his current ADP in startup drafts right here at DLF. February’s ADP has Wright going 50.5. Based on the chart, pick 1.05 typically goes at 62.69. This would be a good trade for the Wright owner based solely on the historical values in the chart. Looking again at the February ADP, it is again a good value, because the fifth rookie taken, Lache Seastrunk, is going around pick 74.2.
Lastly, with the inclusion of each rookie pick’s ADP, you can see if the current year’s rookies are going higher or lower than they typically do. This makes for easy adjustment of the chart’s values when discussing trades. If you see that pick 1.05 is typically going around pick 70 in startups, you know that it is valued closer to pick 1.06 in most years. You can easily adjust what you would offer in acquiring the pick or what you would accept in a trade should you already own it.
This isn’t fool proof. It is far from it, but it does show how rookie picks are typically valued in startup drafts. That is directly related to the different values of picks in rookie drafts. Now, when dealing rookie picks, we have a quantifiable system showing the typical valuation of each pick based on historical drafts.
Follow Zach on twitter here.
- Summer Sleeper: Buffalo Bills - September 5, 2017
- Summer Sleeper: Miami Dolphins - August 14, 2017
- How Broken Is Running Back Scoring? - July 9, 2017


