Advanced Draft Preparation: Avoiding the Herd Mentality
“If asked how to cope with a great host of the enemy in orderly array and on the point of marching to the attack, I should say, “Begin by seizing something which your opponent holds dear; then he will be amenable to your will. Rapidity is the essence of war: take advantage of the enemy’s unreadiness, make your way by unexpected routes, and attack unguarded spots.”
– Sun Tzu (The Art of War)
 Sun Tzu knew well that when everyone zigs, you should zag. This quote holds true with many aspects of life. In the stock market, those who are the most successful buy when everyone else is selling. In warfare, when an enemy expects you to do one thing, do something they wouldn’t expect to truly gain an advantage. Fantasy football is no different, especially when engaging in an initial startup draft.
As you may or may not have noticed, fantasy football drafting is incredibly predictable in the early rounds of an initial startup draft. Certain players will almost certainly be drafted in certain rounds. Doug Martin tends to go in the first round, while someone like Randall Cobb more often than not tends to come off the board in round two and on down the list. I think we’ve all seen the pattern and are all likely fairly familiar with it.
The funny thing about zagging when everyone else zigs is it all comes down to timing. Zag too early and you’re exposing yourself to risk with much less chance for success, zag too late and whatever advantage you may sought could evaporate. So, how do you time a zag correctly? It takes much more than just a gut feeling or intuition – the best indicator of when to react inverse to public opinion is past experience. This presents a bit of a challenge for a fantasy football owner trying to draft players for the future while using trends from the past. Luckily enough an interesting feature of fantasy football culture allows this to occur – the mock draft.
A second bit of good fortune occurs in the fact that Dynasty League Football’s own Ryan McDowell (@RyanMc23) has been conducting dynasty mock drafts for much of the off-season. These mock drafts all used the same scoring system and had a wide variety of participants, perfect for examining drafting trends. So, let’s dig into the trends and I’ll explain what’s occurring as we go.
First, we have to assign point values to the players drafted. Since the 2012-2013 is no different than your average season, I assigned the point values each player scored last year to the players this year. I can hear people saying already, “Well every player isn’t going to score exactly the same amount as last year!” You know what? You’re absolutely right, however, you’re absolutely wrong too. Individual players will almost certainly not score the same amount they did last year, but when you step back and look at the whole picture, it is actually quite surprising how close, on average, the picture will look very similar to the one I’m about to show you come this time next year. Some players will over perform, others will under perform and still others will get injured and score much less than owners had hoped. The names will change, but the face of the scenario will stay basically the same.
Once we assign the points to each player, we need to obtain the average points per player, per round, per draft. This step took an extremely long time and a ton of effort since there were 18 different drafts. When everything was entered and tallied, here is how the average points per round broke out over all 18 drafts:
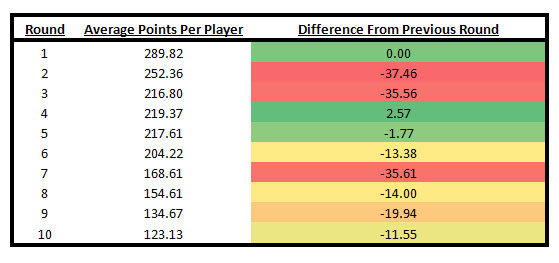
I’ve highlighted fluxuations in average points per player round over round. By doing so some things stand out immediately:
- The value in round four is actually higher than the value in round three.
- Round five is roughly as valuable as round three and four.
- Round seven drops significantly in value from that in round six.
- After round seven value starts to drop at a fairly slow rate.
Now comes the real question, why this happening? First, let’s look at this two other ways:
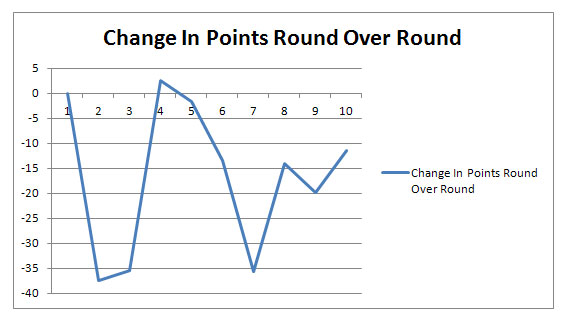

I think when looking at the data these two ways you really start to realize something weird is occurring here, but again, why? Furthermore, how can we capitalize on it?
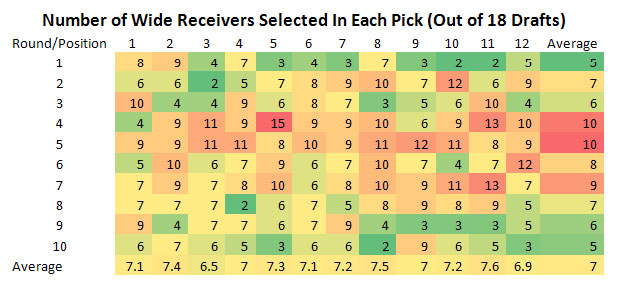
Before I answer any of those questions, we have to dig deeper yet to fully understand what’s occurring. Be prepared, because I’m about to share with you a ton of charts. First, let’s look at in how many drafts a position was drafted with each pick:



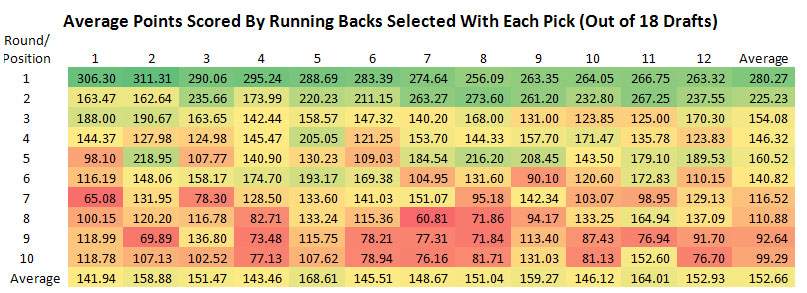
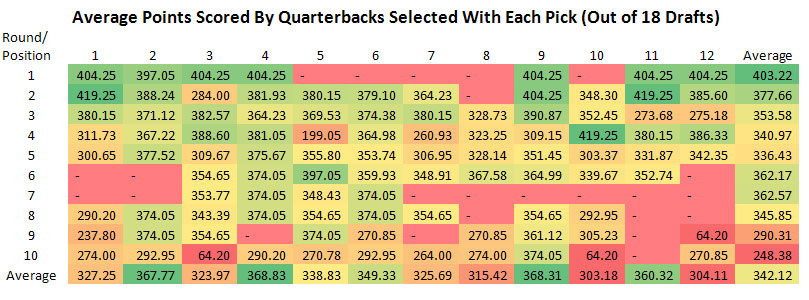
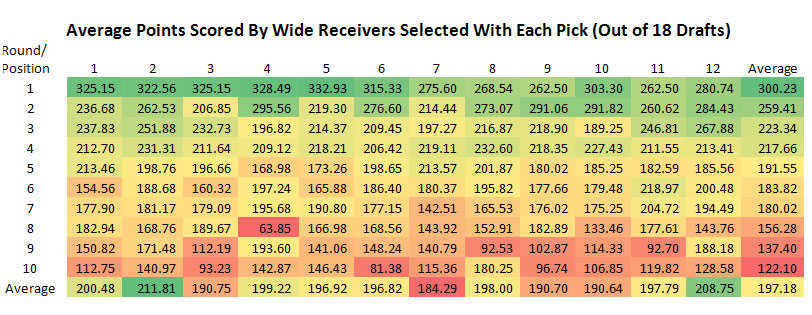
This time we will look at the average amount each point scored last pick by pick over the 18 drafts in question:
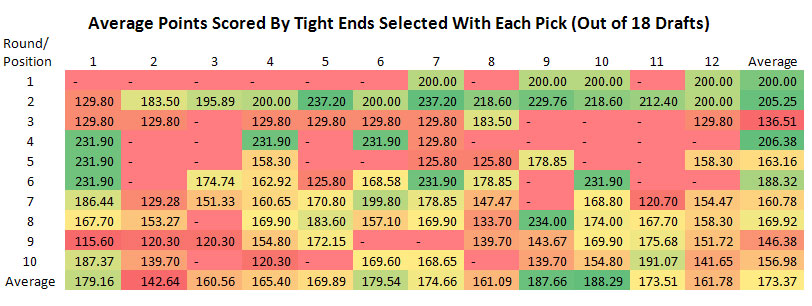
I know it’s a lot of take in, but let’s break these eight charts down a bit.
The first four charts list the number of times the position in question was drafted at each pick over the 18 drafts in question. For example, refer to the first chart. With pick 1.01, a running back was selected eight times. With the 1.02 pick, a running back was also selected eight times and with the 1.03 pick, a running back was selected 13 times. The first four charts will help lay the foundation upon which we will be able to most effectively time our break (or breaks) from traditional herd drafting mentality.
The second set of four charts average the number of points scored by the position in question per pick over the 18 drafts in question. These charts are important because they clearly lay out where value ebbs and flows per position. Take the first chart of this set (fifth chart overall) – we can clearly see if an owner isn’t drafting a stud running back with one, or both, of their first two picks, the value at this position falls off dramatically. Intuitively, many fantasy football owners understand and accept this strategy.
With a bit of groundwork laid regarding these tables, let’s take a closer look at what they’re telling us beneath the surface.
First off, with little surprise, running backs absolutely dominate the first round. On average, two out of every three picks in the first round will most likely be running backs. This is hardly a surprise to any of us who have participated in more than a single fantasy football draft. On the flip side, running backs tend to get neglected most in rounds three through seven, but become in demand again in rounds eight through ten.
On average, quarterbacks tend come off the board in a flurry between rounds three and six. Somewhat interesting is the fact that on average only one quarterback comes off the board in the first round and after round six quarterbacks trickle off the board. Of special note is the fact that round seven seems extremely barren with eight draft positions passing on quarterbacks completely in this round over 18 drafts worth of data.
Wide receivers are by far the most abundant position in any draft and one would expect to see them come off in regular frequency throughout the rounds. This turned out to be untrue as rounds four through seven saw the biggest rush on wide receivers with all other rounds averaging around one wide receiver being selected out of every three picks.
Quality tight ends are very hard to find and the data backs that assessment up. On average, tight ends don’t come off the board in the first round. Remember, that’s not to say that they don’t ever, but on average they slip until the second round where they suddenly come off quickly. After the second round, things cool back off until round six where tight ends begin to come off with some frequency. Looking at the data you can almost tell exactly which picks in the second round map to which tight ends. Jimmy Graham or Rob Gronkowski tend to go off the board most at 2.04 and 2.05. Meanwhile, the third most sought after tight end (Aaron Hernandez) would likely fill the next hottest spot for drafting a tight end which is pick 2.10 with roughly half of the drafts slotting a tight end into the spot. Just as round seven was a dead zone four quarterbacks, round four is the same for tight ends with eight draft positions passing on tight ends completely in this round over 18 drafts worth of data.
How about the point distribution for the positions? Does the draft position bare out where people are selecting these positions?
Running backs come off the board in a smooth reducing gradient as one would expect. Basically, the best running backs get selected first and the value descends from that point on. There is a small uptick in value in round five before returning to the standard decline.
For quarterbacks, a couple of interesting things are occurring. First, as one would expect, value decreases initially just as it does with running backs. However, at round six, and subsequently round seven, things very odd start to happen. In these rounds, the value increases, but it doesn’t just increase, it shoots up dramatically. These rounds are so valuable for quarterbacks that they are actually more valuable than even the third round. Therefore, if you missed a quarterback in the first or second round, wait until round six until drafting one. One thing to consider though, remember earlier when I stated round seven was nearly devoid of quarterbacks being drafted in that round? Be sure to weigh that into your decision as the average points in round seven will likely be skewed higher due to this phenomenon. Round six did not experience this so the average from that round is solid.
The point data from wide receivers is very vanilla as the point value decreases round over round as expected – this corresponds directly to the large supply of wide receivers available to owners. The dips in value are much less severe from round to round as well sometimes no more than three or five points separating the value from one round to the next.
Finally, tight end point value is a tough one to read. It’s very tough to take the values of rounds three through five very seriously due to the low frequency of a tight ends being selected in those rounds. What is evident is that round two is the prime spot to select a tight end with round six being the next round to target after the initial run.
Now then, how does one plan an attack coming into a draft? We now know certain tendencies that your average bear just doesn’t know. How can we leverage them? How can we exploit them?
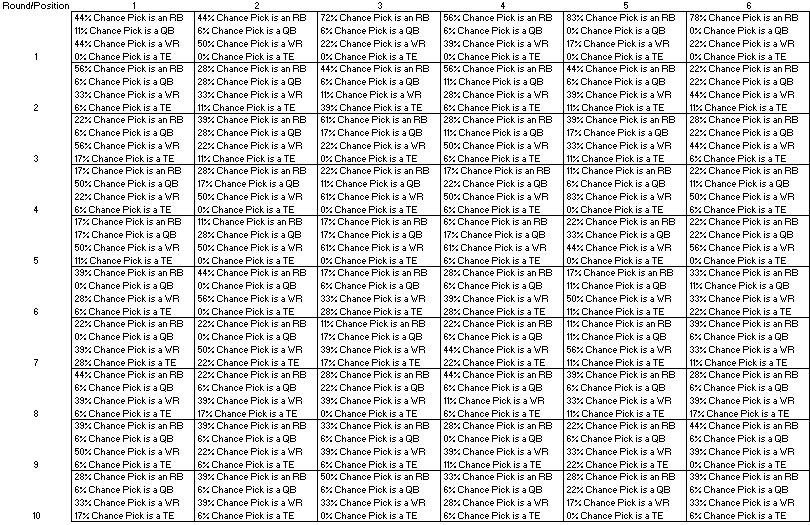
To assist in developing a game plan, I’ve created the following chart – it outlines what the likelihood is of an owner selecting any given position with any specific pick:
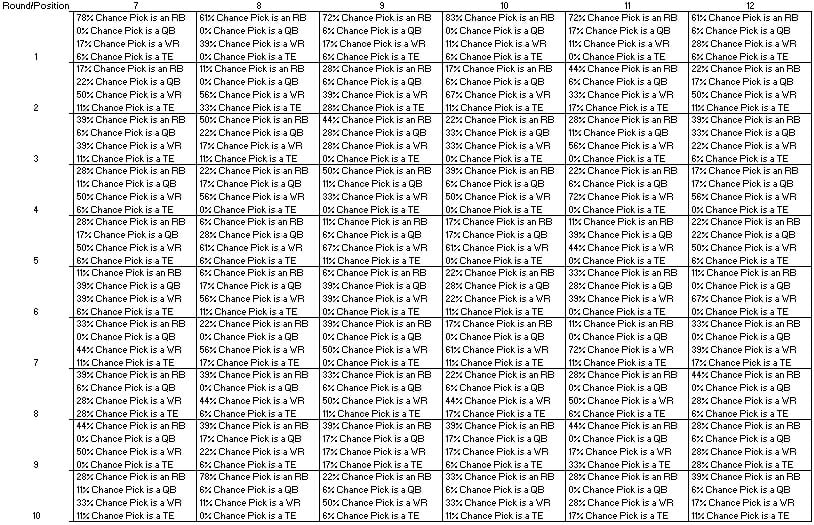
When using this, remember every draft and owner is different. One owner may value a player or position differently than anyone else alive. This data simply shows what has been observed over 18 drafts worth of data. As such, entries that state there is a zero percent change of a position being drafted with any specific pick you should simply take to mean there is a low chance this will happen and it has not been observed in the data collected, not that it is impossible.
With that disclaimer out of the way, this chart is extremely handy if you’re going into a start-up draft. Print it up, cut it out and stick it in your wallet or draft folder. Yes, it is that useful. This chart essentially combines all of the data in the first set of four heat charts shown above and assigns percentages to the likelihood of each position being drafted with a specific pick. Moving through the rounds, you can see when positions are in demand and when they are less sought after – this is our first tool in determining when to zag when the herd is zigging. If you can see a position is going to become hot in the next round, perhaps it might make sense given how your draft board falls to get out in front of the position rush. For instance, between pick 2.11 and 3.01, the shift from running backs to wide receivers occurs. If the running backs available to your are not to your liking at 2.10, it might be best for you to hit wide receivers with this pick.
The next thing we should look at when determining a solid draft strategy is should we even try to zag when others zig or should be embrace the safety of the herd. “Whoa, whoa,” I hear you saying, “You’ve been selling us on this whole notion of going against group think, now you’re saying we shouldn’t?” The answer to that is both yes and no, but let me explain. Some positions in drafts like the ones we’ve been examining hold certain “sweet spots.” These sweet spots are where the owners barely need to think. They can place their draft essentially on auto-pilot and can come out with an excellent team. Where are these sweet spots? Unfortunately they will vary from one format and scoring system to the next. However, if your league is set up roughly similar to these leagues, then here is the chart for this format and scoring set-up:

This chart was created was by taking the average point value for very draft positions and every player position and breaking it out. What we see here is that an owner drafting in the ninth position of this format had a very good chance of having the best draft. The average ninth slot owner had the third best running backs overall, the second best quarterbacks overall, the second best tight ends overall but had the tenth best wide receivers. According to the likely pick chart above the ninth round owners, on average drafted like this:
First Round: RB
Second Round: TE
Third Round: RB
Fourth Round: RB
Fifth Round: WR
Sixth Round: QB
Seventh Round: WR
Eighth Round: WR
Ninth Round: TE
Tenth Round: WR
No, the position selections don’t match completely to the chart, specifically the tight end portion. For tight ends, due to no specific round holding a majority for a tight end selection, what I did is look at the highest likely hood that a tight end would be drafted at any given round. After that I followed the chart. Some things to immediately take away from this strategy is that it lines up nearly perfectly with three of the four value hot spots. The average ninth round owner selected a running back at the positions highest point, they selected a quarterback at the second positional value peak in the sixth round (remember, the sixth round was more valuable than the third, fourth or fifth rounds for quarterbacks) and they selected a tight end at the most valuable round for tight ends. Only wide receivers were an afterthought with the average ninth position owner selecting their first wide receiver in the fifth round with an average point value in that round of 180.02 which would make their number one wide receiver somewhere between T.Y. Hilton and Antonio Brown, not great but not horrible by any means.
Knowing all of this, why does value in the draft increase in rounds four and five? The reason for this seems to be a clear move away from drafting running backs and a complete shift towards drafting wide receivers. That’s not to say wide receivers have more value in rounds four and five, simply that focus shifts as a whole towards drafting wide receivers. By round four, running back value drops significantly below the value of the wide receivers available, 71.34 points separates the value of your average running back in round four versus your average wide receiver available in round four. In round five the herd shifts towards drafting quarterbacks, despite that round being the lowest value for quarterbacks in any of the first eight rounds, which again increases the value in the round despite not being a good value overall. As all the positions start to come into play roughly in proportion to the starting lineup, the value round over round stabilizes.
I understand I’m trying to cram a lot of information into this piece. Hopefully, I’ve made it fairly digestible and understandable for everyone. Beyond the findings I’ve outlined in this article, here are a few interesting points to come out of the data:
- Pick 1.05, 1.10 and 4.08 are the most “locked in” picks with 83% of owners selecting a running back with the 1.05 and 1.10 picks and picking a wide receiver with the 4.08 pick.
- Pick 10.08 has an extraordinarily high frequency of running back selections being made with the pick, outside of the first three rounds it is the only pick where a running back was selected in double digit drafts.
- Pick 4.12 is the favorite position of owners selecting a quarterback where 50% of the drafts saw a quarterback selected with this pick.
- A tight end was never selected in the first six picks, the only positions where this is true.
- Picks 1.10, 1.11 and 2.10 very rarely select wide receivers with a wide receiver being selected only 11% of the time with these picks. Not until the eighth round do wide receivers dip this low.
- Despite drafting a quarterback with less frequency than any other draft position, owners in the fourth position draft quarterbacks with the highest average point total than any other draft position, outscoring the 10th and 12th draft positions by nearly 65 points (roughly an 18% advantage) and outscoring the league average by roughly 25 points (roughly 9%).
- The best spots to draft out of in respect to value are picks nine and eleven. Picks eight and three was the worst spots for value, followed closely by picks twelve, ten and seven.
- The highest value draft position versus player position is the fourth position when selecting a quarterback. The lowest value draft position versus player position is, ironically, the first position when drafting a running back. This doesn’t mean the 1.01 is the lowest value, simply that if an owner drafts from that position the value they get from their position in regards to running back is the lowest of all draft positions versus player positions. This could be due in part to owners feeling overly secure with a running back at 1.01 and then they neglect the position until much later.
While I’ve tried to interpret much of the data I’ve presented here, I have no doubt many of you will be able to find additional relevance in parts I haven’t touched on. I’d love to hear additional findings any of you extract from the data as I’m sure the community would as well.
This article has been very enlightening to me while researching and writing and I hope this article helps those of you preparing, conducting or simply researching drafts. Thank you to Ryan McDowell (@RyanMc23) for conducting these drafts and those who participated in them as well.


