Dynasty League Football

Dynasty

Daniel Jones’ Value in Dynasty Leagues: From Dimes to Dollars
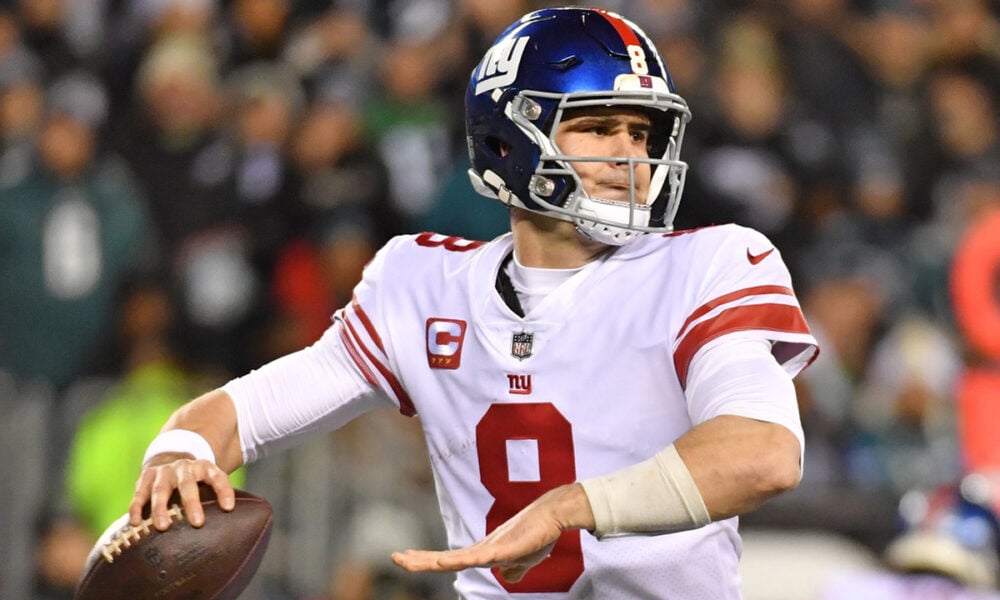
What is Daniel Jones’ dynasty value and where is it heading after he signed a four-year, $160 million extension?

Daniel Jones

There might not be a more talked about player this off-season than Giants quarterback Daniel Jones, even more so after he signed his four-year, $160 million extension, and for good reason. Quarterback is the most important position in the NFL, and there’s an argument to be made that there aren’t more than 10-15 signal callers who don’t come with at least a moderate number of question marks. This isn’t to say Jones himself isn’t still something of a mystery, but at the very minimum he’s made significant progress since his rookie season in 2019.

Let’s consider his passing statistics, shown below:

Year Games Attempts Completions Comp. % Yards YPA TDs INTs Passer Rating Sacks
2019 13 459 284 61.9 3027 6.6 24 12 87.7 38
2020 14 448 280 62.5 2943 6.6 11 10 80.4 45
2021 11 361 232 64.3 2428 6.7 10 7 84.8 22
2022 16 472 317 67.2 3205 6.8 15 5 92.5 44


A couple of numbers immediately stand out. Firstly, there are positive yearly trends in completion percentage, YPA, interceptions and passer rating. Though his counting stats leave much to be desired when compared to his positional peers throwing for 5,000 yards and 30+ scores, Jones has clearly improved over time. In 2022, he also managed to stay healthy, with his only absence coming in a meaningless week 18 contest where he was rested.

Continuing, while perhaps not a true dual threat, Jones adds both real-life and fantasy value with his legs. This was particularly true in the 2022 season, as noted in the table below:

Year Games Attempts Yards Average TDs First Downs Fumbles Fumbles Lost
2019 13 45 279 6.2 2 21 6 3
2020 14 65 423 6.5 1 17 3 2
2021 11 62 298 4.8 2 16 2 1
2022 16 120 708 5.9 7 57 2 1


In both an overall sense, and relative to his improvement as a passer, Jones truly broke out as a runner this past season. He nearly doubled his previous high in rushing attempts, while shattering his prior bests in yards, touchdowns and first downs. In doing so he ripped off nearly 6.0 YPC, and notably he took care of the ball with a mere two fumbles (one lost). In fact, on the season Jones only turned the ball over six total times, despite his total opportunities (passes and rushing attempts) increasing.

How did this all translate to fantasy football? Pretty darn well, as Jones finished the year as a QB1, and was just outside as the QB13 in terms of points per game (minimum of eight games played).

Year Games Fantasy Points Rank PPG PPG Rank
2019 13 287.3 QB20 22.1 QB11
2020 14 239.5 QB24 17.1 QB30
2021 11 203.2 QB28 18.5 QB17
2022 16 333.1 QB12 20.8 QB13


One item that’s fair to note is that while Jones had his best season statistically, he was actually better from a fantasy perspective as a rookie in terms of weekly output. This was due to his ability to find the end zone as a passer on a more frequent basis, with nine additional touchdowns despite 13 fewer attempts. The overall numbers were close based on Jones’ newfound rushing prowess, but it’s fair to say he compiled his fantasy numbers in a very different way than the years prior.

Year Pass PPG Rush PPG
2019 19.0 3.1
2020 13.7 3.5
2021 14.7 3.8
2022 13.8 7.1


While rushing has proven to be a sticky statistic for some of the best in the game (e.g., Josh Allen and Lamar Jackson), it’s fair for dynasty players to wonder if Jones can repeat his 2022 season. And if he doesn’t, will his diminished passing numbers allow him to remain as a startable asset?

Truthfully I’m not as concerned about this, as his fantasy passing numbers were actually improved when touchdowns are removed from the equation.

Year Games Yards TDs Pass PPG PPG from Yards % PPG from Yards PPG from TDs % PPG from TDs
2019 13 3027 24 19.0 11.6 61.2 7.4 38.8
2020 14 2943 11 13.7 10.5 77.0 3.1 23.0
2021 11 2428 10 14.7 11.0 75.2 3.6 24.8
2022 16 3205 15 13.8 10.0 72.8 3.8 27.2


The table above breaks down exactly how Jones scored his points through the air. It’s true 2022 yielded his fewest points per game directly from yards, but this was only 1.6 points below his previous high in 2019. Perhaps more importantly, his points per game per touchdown show that even a modest improvement should be more than enough to see his overall passing numbers increase. While this is clearly not a direct comparison from a talent perspective, Chiefs quarterback Patrick Mahomes achieved 33.7% of his fantasy points solely from passing scores. If Jones can bump that number up to even the 30-31% threshold he’ll be in good company.

Continuing, and noting a direct correlation to his YPA, Jones actually scored the most fantasy points per passing attempt (yards only) of his career. Potentially even more importantly, 2022 didn’t represent an outlier season in terms of unsustainable efficiency.

Year Attempts Yards Point/Attempt (Yards)
2019 459 3027 0.330
2020 448 2943 0.328
2021 361 2428 0.336
2022 472 3205 0.340


Returning to Jones’ lack of passing touchdowns, there exists another reason for optimism, which is that, quite frankly, his supporting cast can only possibly improve. The table below shows the disparity between his skill player corps in 2019 and 2022.

Year WR1 WR2 WR3 TE1 RB1
2019 Darius Slayton Golden Tate Sterling Shepard Evan Engram Saquon Barkley
2022 Darius Slayton Richie James Isaiah Hodgins Daniel Bellinger Saquon Barkley


While Darius Slayton and Saquon Barkley remained, this past season Jones was saddled with a former seventh-round pick in Richie James, a midseason waiver pickup in former sixth-round pick Isaiah Hodgins, and a rookie fourth-round pick in tight end Daniel Bellinger. Conversely, Golden Tate and Sterling Shepard were both former second-round picks with established track records (though admittedly Tate was nearing the end of the line at this point), as well as former first-round tight end Evan Engram. Given this inequality, it’s fair to reason that from a qualitative perspective, Jones’ 2022 numbers were as good as those in 2019.

Another primary reason to think Jones can continue to flourish in New York is the team’s new coaching staff, led by Coach of the Year Brian Daboll. While perhaps not quite to the same extent as what he did as an offensive coordinator in Buffalo, Daboll successfully implemented a scheme that allowed Jones to represent something of an Allen knockoff. Compared to the prior coaches with whom Jones was saddled (Pat Shurmur and Joe Judge), Daboll represented a mammoth upgrade that cannot go unnoted.

To this point, the argument for Jones has solely centered his improvement in the vacuum of his own team and statistics. However, it’s also important to compare him to some of his positional peers, in an attempt to gauge a relative valuation. Given their proximity in age and youth, incomplete grade as it relates to firmly proving their worth as long-term solutions, and first-round draft capital, two comparators who jump out to me are Miami’s Tua Tagovailoa and Chicago’s Justin Fields.

While Jones’ stock has risen in recent months (noting that rookie ADPs were added in the most recent iteration), his value still lags behind that of Fields and Tagovailoa, as shown in the figure below.

The values for this trio in terms of both ADP and DLF’s Top 250 rankings is shown in the table below.

Name Overall ADP ADP Rank Overall Rank QB Rank
Daniel Jones 159.2 QB17 146.0 QB18
Tua Tagovailoa 117.7 QB12 91.9 QB12
Justin Fields 67.0 QB8 60.3 QB8


Jones falls approximately 3.5 rounds behind Tagovailoa, and nearly eight rounds behind Fields. He is also being valued well lower than the ceiling he’s shown in both 2019 and last season. To me, that sticks out as too large a divergence.

Let’s continue with comparing the trio’s passing statistics from 2022.

Name Games Attempts Completions Comp. % Yards YPA TDs INTs Passer Rating Sacks
Daniel Jones 16 472 317 67.2 3205 6.8 15 5 92.5 44
Tua Tagovailoa 13 400 249 64.8 3548 8.9 25 8 105.5 21
Justin Fields 15 318 192 60.4 2242 7.1 17 11 85.2 55


Tagovailoa was the best of the three by far, with the most yards and touchdowns of the group, and also the highest YPA and fewest sacks taken. Jones (previously described) serves as something of a midpoint, while Fields’ counting stats are the worst, including the fewest yards, lowest completion percentage, and worst touchdown/turnover ratio. Fields also took the most sacks, which has been a problem for him thus far in the NFL (91 through two seasons despite limited dropbacks). This issue actually dated back to college, as Fields was sacked once every 12 passing attempts.

Interestingly, though the Bears offensive line is thought of as the culprit, ESPN promulgated a metric called the “Pass Block Win Rate,” which is predicated on how frequently the team’s individual offensive line players were able to sustain blocks for > 2.5 seconds. These team results are shown below.

Team ESPN Team Pass Block Win Rate Rank
Giants 52% 29
Dolphins 55% 24
Bears 68% 2


This table helps reaffirm Tagovailoa as the clear winner, and also helps explain Jones’ sack totals given his line’s inability to sustain blocks. For Fields, however, the offensive line appears to have performed their jobs. However, this is where his mobility served as something of a double-edged sword; in extending the play by scrambling, Fields opened himself up to additional pressure as his linemen couldn’t maintain their blocks, and were blocking the play that was called. Dynasty managers will likely take this tradeoff given Fields’ prowess running the ball (more on that later), but it’s fair to be noted as an issue of potential ball security and an ability to sustain drives.

Additional context is added by comparing and contrasting supporting casts. Jones’ skill position players in 2022 were noted above, and the below shows the same for Miami and Chicago.

Team WR1 WR2 WR3 TE1 RB1
Dolphins Tyreek Hill Jaylen Waddle Trent Sherfield Mike Gesicki Raheem Mostert
Bears Darnell Mooney Equanimeous St. Brown Dante Pettis Cole Kmet David Montgomery


Similar to Jones, Fields suffered in part due to the poor assembly around him. Apart from Cole Kmet (PPR TE8), no Chicago player functioned as an upper-echelon asset. David Montgomery was the PPR RB24 and only caught 34 passes, and no Bears receiver even cracked the top 70 at the position in the final 2022 PPR rankings.

Comparatively speaking, Tagovailoa lived like a king. Hill and Waddle were the PPR WR2 and WR8 respectively, and both Mostert and colleague Jeff Wilson Jr functioning as top-30 running backs. Still, he had to make good on the talent around him and was able to do so.

Additionally of note was the way each player compiled their passing yards, as shown in the table below.

Name Yards YAC % YAC Intended Air Yards IAY/Att
Daniel Jones 3205 1596 49.8 3024 6.4
Tua Tagovailoa 3548 1281 36.1 3790 9.5
Justin Fields 2242 957 36.1 2900 9.1


Markedly, Jones relied upon his skill players generating yards after the catch, with nearly half of his passing yards compiled in this manner. He also had the lowest intended air yards per attempt (rightmost column) of the group, which accounts for both completed and incomplete passes. Comparatively, Tagovailoa and Fields only had slightly over one-third of their passing yards come after the catch, and each averaged over 9.0 intended air yards per attempt.

While this reflects poorly on Jones, it is noted that his intended air yards per attempt were higher in previous years (8.0, 7.6 and 7.2 IAY/Attempt in 2019-2021, respectively). Additionally, before having Hill in town, along with head coach Mike McDaniel, Tagovailoa had similarly middling values of 7.0 and 7.5 intended air yards per attempt in 2020 and 2021, respectively. With an upgraded supporting cast, it’s possible Jones may revert to his prior numbers, or potentially outpace them in a second year in Daboll’s system.

As shown in the table below, when it comes to value added by rushing, Fields is incomparable.

Name Games Attempts Yards YPC TDs First Downs Fumbles Fumbles Lost
Daniel Jones 16 120 708 5.9 7 57 2 1
Tua Tagovailoa 13 24 70 2.9 0 4 2 0
Justin Fields 15 160 1143 7.1 8 65 9 0


He had the most attempts, yards, and touchdowns, while having the highest YPC. In fact, his 1,143 rushing yards were the second-most by a quarterback in NFL history. On the other side, Tagovailoa was essentially a non-factor on the ground, with well under 1.0 PPG added with his legs.

From a “real life” football perspective, Jones converted the highest proportion of first downs (47.5%), and also had the best ball protection of the group with only one fumble every 60 carries. Fields fumbled the ball a whopping nine times (once every 18 rushes), but incredibly managed to not lose a single one.

All told, in terms of a comparative scoring analysis, the 2022 season shook down as shown below:

Name Games Fantasy Points Rank PPG PPG Rank
Daniel Jones 16 333.1 QB12 20.8 QB13
Tua Tagovailoa 13 284.4 QB15 21.9 QB9
Justin Fields 15 342.4 QB10 22.8 QB6


The three were clustered close together in both overall rank and PPG rank, with Fields and Tagovailoa bettering Jones in the latter, and Jones in the middle for the former based on Tagovailoa’s missed contests. This, however, is an important note as the Dolphins’ signal caller suffered a scary series of concussions (and “concussion-adjacent” injuries) within the 2022 season. Though he has entered the off-season with an apparent clean bill of health, this hasn’t stopped Miami general manager Chris Grier from stating the team is “exploring all options” at the position.

All told, there are pros and cons for each of the three players. Tagovailoa has functioned as the best passer and is surrounded by the best set of skill position players. He offers next to nothing as a runner, and has a bad injury history. Fields is a big play waiting to happen in the passing game, but completes too few passes and takes too many sacks. From a fantasy perspective, he has been reliant upon near-historic rushing production, but also has ball security issues. The front offices in Miami and Chicago also don’t appear to be sold on either.

Conversely, New York went out of their way to retain Jones. It’s sensible, as he improved as a passer (sans touchdowns), and put forth career-best and not-unsustainable rushing production. He’s still young (he turns 26 in May), and should be able to continue improving with the stability of a competent coaching staff and an influx of talent at the skill positions.

I’m not here to argue that I’d trade Fields or Tagovailoa for Jones in a 1:1 manner, because per the ADP and rankings that would leave value on the table. Truthfully, both were included more as points of comparison, to show that Jones shared several items in common with these two players who are viewed as dynasty QB1-caliber players. Given his status as a midrange QB2, and given the growth he was able to show in 2022, he’s a sensible “buy” candidate and (arguably, but in my opinion) a better value.

Lastly, and while noting this is outside the scope of dynasty football, much has been argued about Jones’ NFL worth in terms of a new contract. $35 million, $40 million, or $45 million? The deal settled on $40m, but my thought is – who cares?

The chart above shows the near linear rise in the salary cap from 2018 through 2023, even with a reduction in 2021 due to the Covid-19 pandemic. The point here is, $40 million in 2023 is going to look a lot different in 2025 or 2026, when the cap hit would be lower. Contracts are only going to continue to go up in value, and it won’t be long until the next quarterback (e.g., Kirk Cousins) shatters the ceiling again. Circling back to the first paragraph in this article, there do not exist enough quality quarterbacks for all 32 teams in the league, and it was no surprise to see the Giants spending accordingly. When it comes to Jones, dynasty players should consider doing the same.

Follow me on Twitter.

Daniel Jones’ Value in Dynasty Leagues: From Dimes to Dollars
2 Comments
0 0 votes
Article Rating
Subscribe
Notify of
2 Comments
Oldest
Newest Most Voted
Inline Feedbacks
View all comments
Cy Guy
1 day ago

Excellent analysis! I’ll note that I discount the intended air yards in part because of different WR – put Hill or Waddle on NYG and he may throw it deeper too. But the rest of the article gives me reason to be cautiously optimistic for 2023.

To Top