Target Share Report: Week 16
Welcome back to the target share report, where we look at player usage and how it’s changed.
You can find all my 2020 data here.
You can also join my live stream every Monday (on Twitch, Youtube and Periscope) while I collect and discuss first impressions of each week’s stats.
There’s always a lot going on in my tables so I have included information about the stats I utilize most at the end of the article if you’d like to know more about any of them.
With most of the fantasy season over, and start/sit columns doing far more relevant work for more immediate decisions, I’ve decided to turn towards a “year in review” style tone for this column. Last week I took a look at rookies in 2020 and compared them to the 2019 class. This week I’ll take a look at usage league-wide and any trends and changes we may want to notice.
Enough preamble, nerd up!
Usage in 2020
The problem with giving a nerd a bunch of data and letting him write about usage in any way he wants is that a nerd has a hard time putting down the research, and picking up the pen. In my experience anyway. I’ve made so many tables and graphs this last week I don’t know where to store them all. But, we have to get started somewhere, and not make this too boring for y’all non-nerds. So, let’s just take a broad view of 2020, and see how usage and production shaped up in 2020.

How are we to adjust for the fact that more players recorded stats (or played) in 2020 than any other year since 2009? That waiver wire scramble and injury designation fatigue you suffered this year was not a figment of your imagination. We genuinely saw a historic level of players playing in 2020 because of the COVID list and pandemic.
Honestly, we can’t. We don’t have anything to compare it to. While the player lockout of 2011 offered some comparison to the lack of preseason practice (something that suggested it would not hurt the receiving game as much as some thought), no season had the level of turnover at each position we saw in 2020.
Having said that, we should know it. We can’t do much with it but remember it.
Here are the average target shares of top 12 players at each position by season.

No position saw the lowest average in 2020, but it’s noticeable that all three were below the average for the first time. Outside of a few anomalies, the positions as a whole seem to have had a lower target share as a whole.
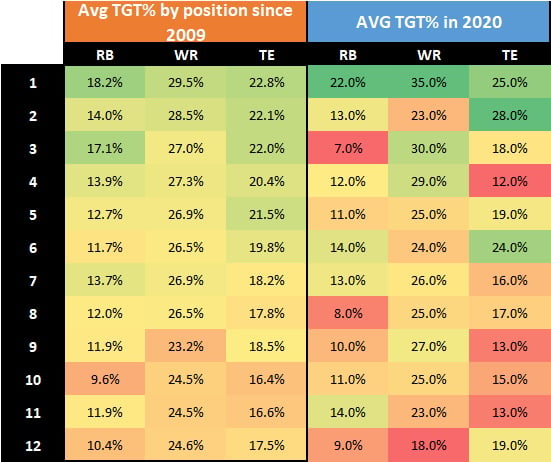
At wide receiver, Davante Adams (WR1), DeAndre Hopkins (WR4), and Stefon Diggs (WR3) beat the average. But almost everyone else was low.
Specifically at running back, it’s fairly obvious that two of the highest usage players in the receiving game in the NFL were injured (Saquon Barkley and Christian McCaffrey). Also, there’s no prize for guessing that Derrick Henry is running back three. Henry is a much lower receiving game player than average in the top five. That’s just not his game.
At tight end, Robert Tonyan (TE4), also had a very low target share compared to average. That’s because of his high touchdown role. Mike Evans (WR12), has a similar effect and for the same reason, at the wide receiver reposition.
But the few outliers really don’t cause the overall trend (*cough* probably COVID-related *cough cough*).
Production in 2020
Did this affect the points we were getting? Yes, there was a much bigger divide between the top tier of producers and the second tier. At each position, the PPG outside of the player ranked sixth overall seems lower than average – making for a very “studs and duds” type experience. Wide receiver is slightly closer to average but it’s also noticeable those in the top five were higher than average making for the same effect.
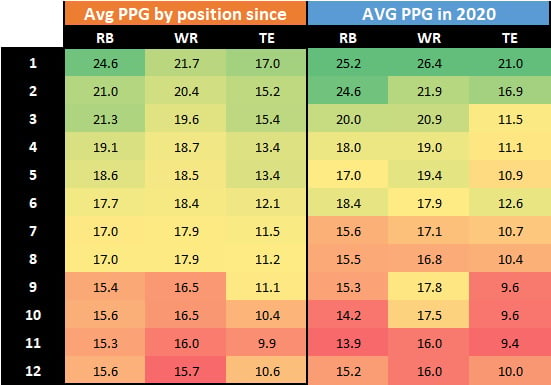
Having said that, and referencing back to the first table, wide receivers have consistency being getting at or below the average in target share, whereas it is only 2020 that shows a dip in receiving usage for running backs. I’d expect running back production to bounce back more moving forward.
This is backed up by the fact that, although for the first time in a while top wide receivers actually outproduced top running backs on a PPG basis, the running back position continues to see an edge in volume (or expected points per game, EPG).
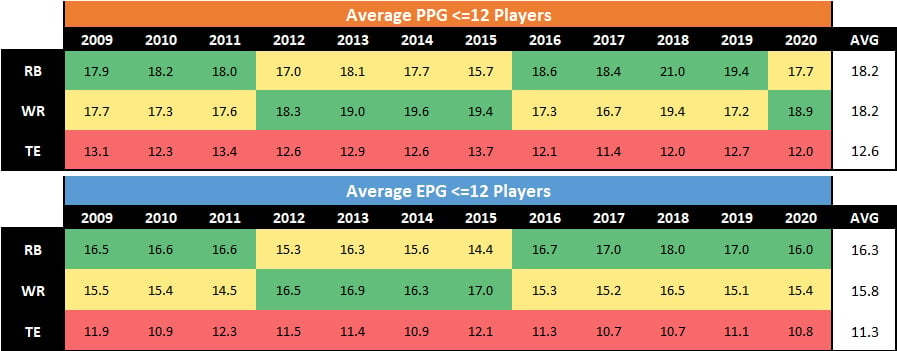
In other words, while I think we should continue to expect a “renaissance” of a sort at wide receiver – which has been lagging the last couple of seasons anyway – I also think we should expect running backs to continue being the dominant “winning” force. Not just for positional scarcity but production ceilings as well.
Age in 2020
I feel like I’ve spammed you all with a lot of images this week. I just felt like the visuals would be helpful while talking more broadly about averages.
But, if you can hang with me for one more, I think age is, as always, going to be a big conversation this off-season. We have a lot of new exciting young players at every position to consider in dynasty leagues. At the same time, we still have a few “old” vets dominating or due to return from limited injury.
Unlike most of the dynasty community (it feels that way), I find myself opposed to the idea that “young players are better” which seems to be dynasty cannon at this point.
So, allow me to try and start us off on that conversation on a sound, data-based footing. Young players have more value, and should. They will have more value moving forward, even if they struggle and you have more time to wait for them to “turn it around” if they do, without losing all your value. This makes “investing” in older players much more immediate and results based because the consequences for a team if you “miss – i.e if your old player struggles like Julio Jones in 2020 – don’t have any time to recoup value.
BUT
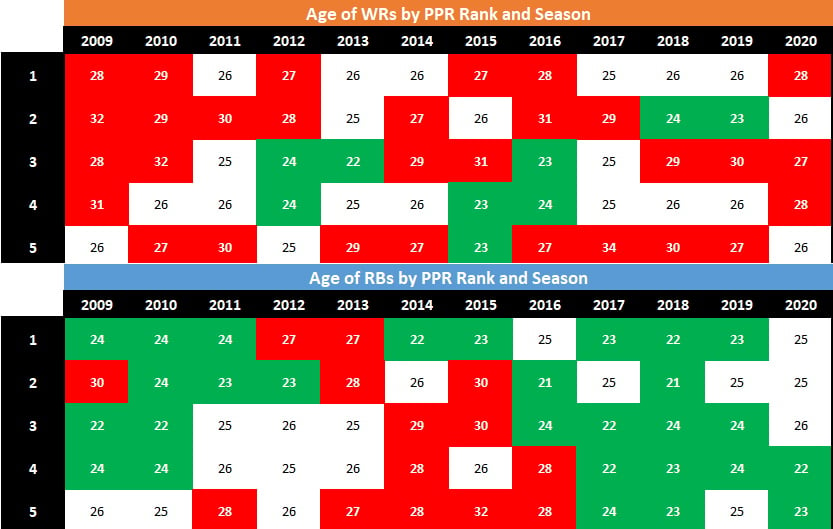
Being an “old” and a proven productive player is not a bad thing. In fact, it puts them in a higher hit rate group for valuable, fantasy-relevant seasons than younger players. For example, around 36% of top-five seasons at wide receiver come from players over the age of 27 since 2009, whereas around 15% of seasons come from players 24 or younger.
Does that mean I think DeAndre Hopkins is greater than DK Metcalf in dynasty? I am, crazy? Not at all. Value matters and I don’t think the number 24 is magic, it doesn’t make Metcalf any less talented. But age 29 (next year) doesn’t make Hopkins any less talented either. In other words, I think the difference is going to be in value, and length of career left (ignoring injuries for both) not their chances of producing in 2021.
And, finally, just because I like triggering the “age hoarders” among us, here’s one last table showing the age of all players in the top five at both wide receiver and running back.
Age 24 and under is highlighted in green, whereas ages 27 and older are highlighted in red.
If you are interested in any of these stats or specifically seeing who ranks where in 2020, feel free to check out my data linked at the start of the article, or just @ me some time. Happy to help.
That’s about all I have time for this week. Hope you found some of it useful, interesting and entertaining. Be sure to let me know about it in the comments below or on Twitter, anytime.
Happy New Year, and I’ll see you again next week.
Thanks again,
Peter Howard.
@pawhody
Addendum: The Stats explained
Real quick, here are the stats I’m using this week and what they are good for.
YD/TM Att: Yards per team pass attempt
This takes the Pass and Rush attempts of the player’s team each week and divides the player’s total yards against it. It’s a simple, yet powerful combination of efficiency and volume. It has a high R squared value in stickiness (it stays relatively consistent week over week and year over year).
It’s a good statistic to sort players by within a position.
PPG: PPR points per game
Fairly common stat that’s often undervalued these days. Depending on the sample, PPG is actually the stickiest and most accurate stat for predicting production.
EPG: Expected Points per game
This is based on rotoviz.com’s expected points formula (which I don’t know) but essentially measures how “valuable” the touches a player has received. It can be seen as a more accurate volume metric removing the player’s “efficiency” from the equation and just looking at how much value they are “given” by the team for fantasy points.
FPOE/G: Fantasy points over expected per game
Also a rotoviz stat, it gives us an idea of if a player is underperforming (negative number) or overperforming (positive number) their “given” volume. In other words, how efficient they have been.
TD Rate: Yards per Touchdown
Players typically average between 100 and 200 yards per touchdown. To be more accurate, if you’re like that, in 2020 (with more than 20 targets) wide receivers are averaging around 175 yards per touchdown, RBs are averaging 130 yards per touchdown, and tight ends are averaging 160.
Essentially, outside of this range, it tells us who may “regress” in touchdowns in the coming weeks.
Percentage of games with seven targets or more:
This one is fairly self-explanatory. I use it as a context check for target share. A high target share in a low passing offense isn’t as “good” as a lower target share in a high passing offense in terms of expected targets.
- Peter Howard: Dynasty Fantasy Football Superflex Rankings Explained - March 6, 2024
- Dynasty Target and Regression Trends: Week 15 - December 23, 2023
- Dynasty Target and Regression Trends: Week 14 - December 16, 2023


