We All Need Someone to Lean on, Part One: Young Quarterbacks and the Dispersal of Targets
Editor’s note: This is the first piece in a six-part series. Be sure to check out the remaining parts at DLF coming soon!
With a few quarterbacks taken in this year’s NFL Draft and another handful of rookies entering their second year, there are two questions we could pose:
1. What should we realistically expect in year one that could show the potential for growth in year two? Are there specific things we should watch for? Are there specific positions that quarterbacks target more in year one than in year two?
2. Should we invest in the receiving options they will be throwing to or wait for a potential discount later?
One could assume that there may be some growing pains and the price you are going to pay for young quarterbacks may not be worth it. This is not in any way to say “do not invest in the QBs themselves”. Growing pains are to be expected, but, when you pay for a locked-in starter for fantasy purposes, you want reliability.
With the weekly variance that already takes place with some of the names we rely on the most at the position, there are added reliability concerns with a young quarterback at the helm.
In part one of six, let us look into this and see what we can dig up.
Quarterbacks: By The Numbers
Since 2014, 27 QBs have been drafted into the league who have started at least five games by their second year in the league (first year for 2019 rookies). Of the 27, five were drafted last season and will likely all be the team’s primary option at the position moving forward.
QBs Drafted By Round Since 2014 (minimum five Games Started)
One: 18 (66.25% of potential games started in year one) (14 non-rookies started 85.62% of games in year two)
Two: 3 (75% in year one – rookie Drew Lock had five starts) (Year two – Derek Carr started 16 games, DeShone Kizer zero)
Three: 3
Four: 1
Five: 0
Six: 1
Seven: 1 (Rounds three-seven: 39.37% of potential games started in year one – includes 2019 rookies. 66.25% of games started in year two)
The numbers may be a little deceiving because there are extremes – Patrick Mahomes starting one game as a rookie, Kizer not starting any in year two – and small sample sizes. But we can look at it like this as well…
QBs Drafted By Year Since 2014
2014: 14
2015: 7
2016: 15
2017: 10
2018: 13
2019: 11
61.5% of the quarterbacks taken since 2014 failed to start five games by their second season. Those are not good odds to start with so moving forward, we are just going to look at the 20 quarterbacks taken in the first or second round (excluding Kizer and his zero second-year starts) and the weapons they were throwing too. We have four 2019 rookies who fall into these thresholds and a few 2020 prospects who might have the potential to reach the five-game start level.
Our QBs in focus:
- Baker Mayfield
- Blake Bortles
- Carson Wentz
- Daniel Jones
- Derek Carr
- Deshaun Watson
- Drew Lock
- Dwayne Haskins
- Jameis Winston
- Jared Goff
- Johnny Manziel*
- Josh Allen
- Josh Rosen
- Kyler Murray
- Lamar Jackson
- Marcus Mariota
- Mitchell Trubisky
- Patrick Mahomes*
- Sam Darnold
- Teddy Bridgewater
*Manziel and Mahomes had very small sample sizes in year one and will be removed from the study.
Rookie QBs: From Year one To two

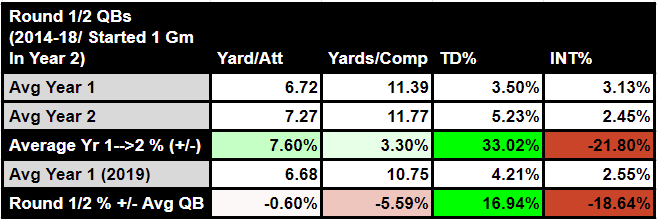
You can see that the 2019 class was ahead of schedule in a lot of areas when compared to previous classes (2014-18) and comparable to the second-year average from the sample of previous classes. They took less risk as you can see with the drop in yards per target and attempt but this led to better protection of the ball and a big jump in TD efficiency.
This should leave a positive outlook for the upcoming season but we are really here to find out what this meant for the top pass-catchers. Did the volume get spread out or was it funneled to the most reliable option regularly?
The Weapons
We have to exclude Patrick Mahomes and Johnny Manziel from our QBs at this point because they did not have enough of a sample size in year one to accurately assess the receiving weapons. In both cases, we know exactly what happened next. This leaves us with 18 total, including the four 2019 rookies.
Market Share Breakdown
(Note: Must be a start by QB, and receiving weapon must have played in that game.)
- Target Share – Percentage of team receptions.
- Yardage Share – Percentage of team yards receiving.
- TD Share – Percentage of team touchdowns receiving.
- (Average) Overall Market Share – The average of the player’s Target, Yardage, and TD Shares.


Above, we can see the breakdown of the positions that were targeted the most by QBs with at least five games started in their first season (2014-present). First-year quarterbacks target their number one option 23.14% of the time but the rookies in 2019 were slightly ahead of that – 23.60% – and targeted their second and third options more than that of a second-year QB. The top target also received nearly 5% more of the yardage but did score a slightly lower percentage of the TDs. Strangely enough, first-year QBs found their third most targeted option for yardage and touchdowns more frequently than their second option.
This was far from the case in 2019. The shares drop pretty steadily with the exception of one. First-year QBs actually connected with their second option for a higher percentage of the TDs than their first option. You may say: “well, they are likely targeting tight ends and running backs more frequently as we saw the yards per attempt/reception metrics slightly lower than average but far more efficient”. This would be false though, as we see above. The second option in 2019 was a wide receiver 100% of the time while the third option who scored less often was a WR 50%. Year two is where the second option saw the biggest jump and the third option becomes more of the third option historically. The top target sees a solid increase still but the second in line gets the biggest boost all around on average…
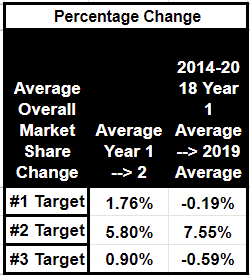
Again though, 2019 was ahead of schedule…
Fantasy Breakdown
(Note: 16-game pace based on per-game averages in games both QB and receiving option played together and QB was starting)
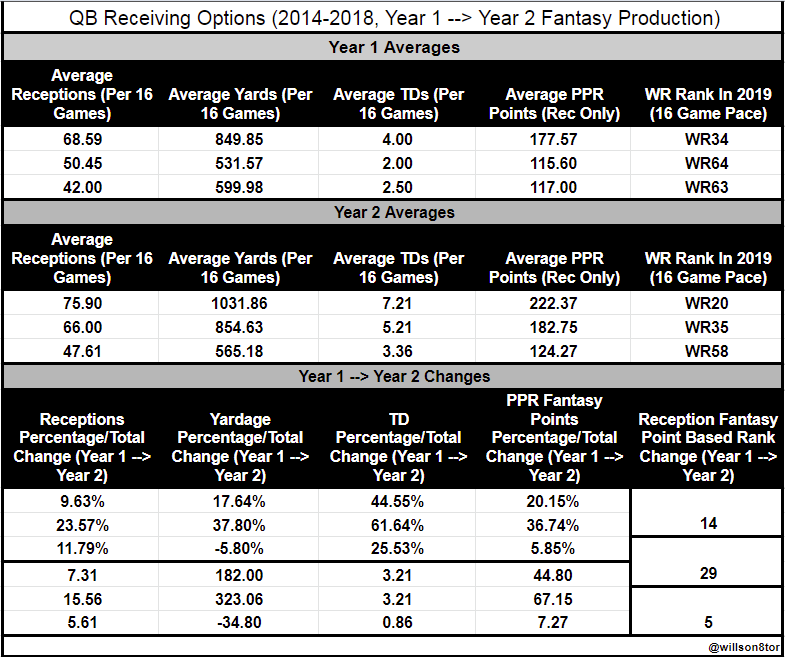
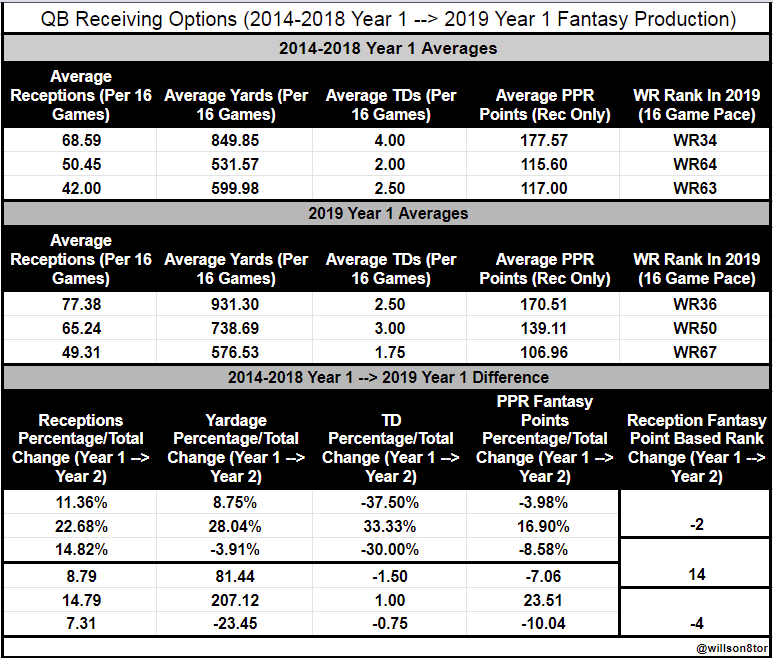
Here, we get to see the real thing we are all here for – the end game of all this data. We can see here that on average, a first-year quarterback’s top target in the offense produces a back-end WR3 season. The second most targeted player (based on receptions alone – does not include rushing production) on average has been anything but a usable fantasy asset. In the second year though, the top receiving option sees an average jump of 14 spots in the ranks to a mid/low-end WR2 and although the third option produces minimal fantasy value still, the second most targeted receiver becomes a very low-end WR4/high-end WR5.
This may not sound like much but remember, this is the average. Many have exceeded it and in a deep league, WR50 is likely being rostered in a redraft format. They are certainly owned in a dynasty format.
Wrapping it Up
Remember the second-year jump! If trends hold, we could see multiple usable fantasy options for most, if not all of the second-year QBs we will cover in parts two-five in the series when we look at applying this to the 2020 season and the 2019 rookies. Later, we will look at the potential first-year starters for the 2020 season in part six. Thank you for reading and stay tuned!
You can follow me on Twitter (@willson8tor) – as well as all the other great members of the DLF family – and on dlfstg02.dynastyleaguefootball.com, where there is no off-season.


