Dynasty Strategy: 2020 Strength of Schedule by Position
It has a long time since I have written anything for you. I’ve been working on a few articles but to be honest, they are all uphill slogs. Long research projects can get that way. To take some time off from them, I made a strength of schedule grid for 2020. This was a good reference while I was working on 2020 projections and also, it was fun.
Let that be a warning: spend too long pretending to be a nerd and you eventually start enjoying some nerd-type things. Anyway, I thought you all might like to see the results, so here they are.
Process
Visuals for this are difficult. As you can imagine with four offensive positions for 32 teams over 16 weeks, the table gets hard to screenshot. Instead I’ve just gone with showing you the results in Arizona as an example, as they are the alphabetical first team on the list.
I collected data on PPR points scored by each position on a week-by-week basis between week one and 16 in 2019. I used RotoViz’s roto-screener app to do this.
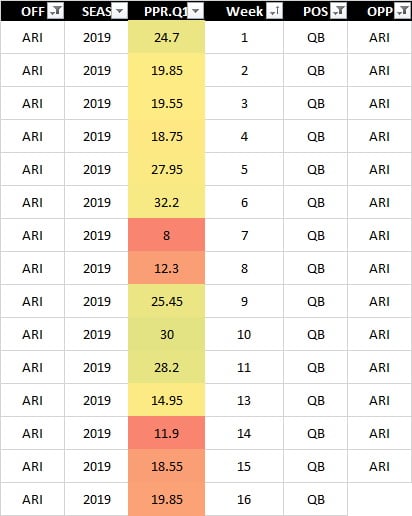
I then mapped those points against the 2019 schedule to figure out which team’s position was scoring which PPR points against which defense.
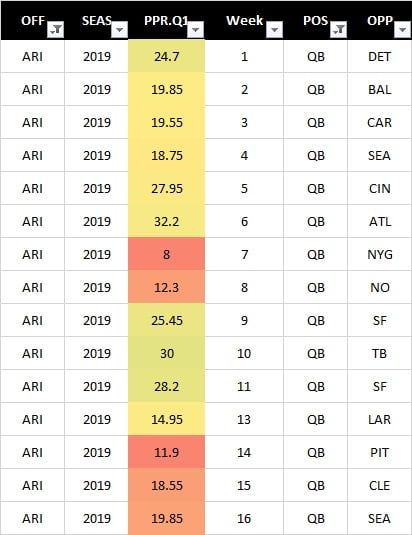
I did this for all 32 teams and all four offensive skill positions in fantasy football. Next, I had to map those PPR points against the 2020 schedule from pro-football-reference.com.
This is another tricky visual so here, I am just showing you the first six weeks of Arizona’s schedule and the average PPR points against each position in 2019.

I also calculated the average points against per position and then compared each team’s “points against” to that average. This creates a PPR points over or under average.
For example, Detroit faced Arizona in week one of 2019 and they scored 33 quarterback points against the Arizona defense. That’s 13 points over the average score for the position in 2019. The average scored against Arizona in 2019 was 26 points, which is six points over the average for the entire year.

We can then import that into our 2020 season grid and get the average view of the PPR points scored against their 2020 opponents last year, as well as their points over and under average. Like so:
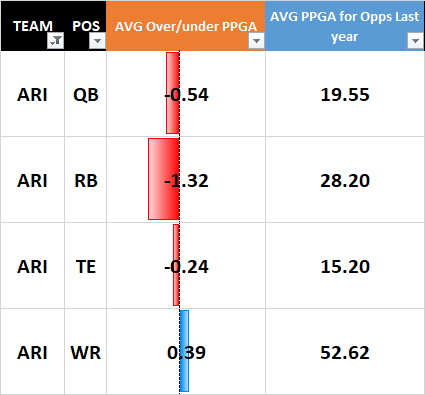
Note these are the points allowed in 2019 by the teams Arizona will face in 2020. Whereas, in the last picture, we were looking at what Detroit had faced going against Arizona in week one in 2019.
A Word of Warning
I tend not to utilize strength of schedule data in projections or heavily in my opinions. Frankly, defenses and the results against them change a lot. There are a lot of moving parts on both sides of the ball, and they are not “sticky” numbers.
However, at least for the first four-to-six weeks, data based on last year can help provide an edge to seeing easier or lighter schedules.
Results
Okay, so what does all this mean?
When I map out the entire 2020 season and put it all in a neat and tidy table, we can rank each scheduled by position organized by quarterback schedule:
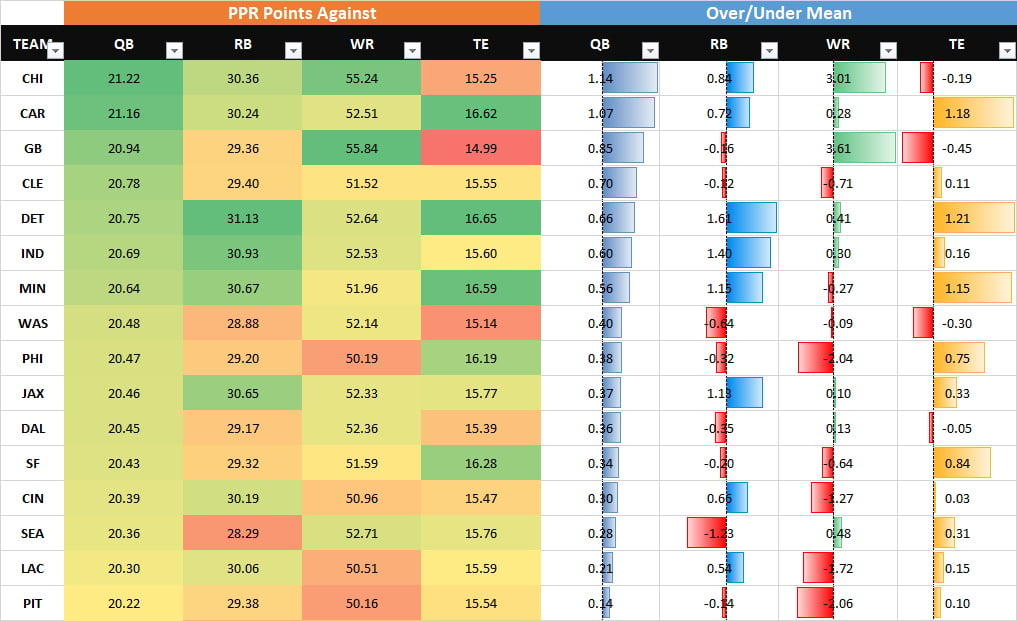
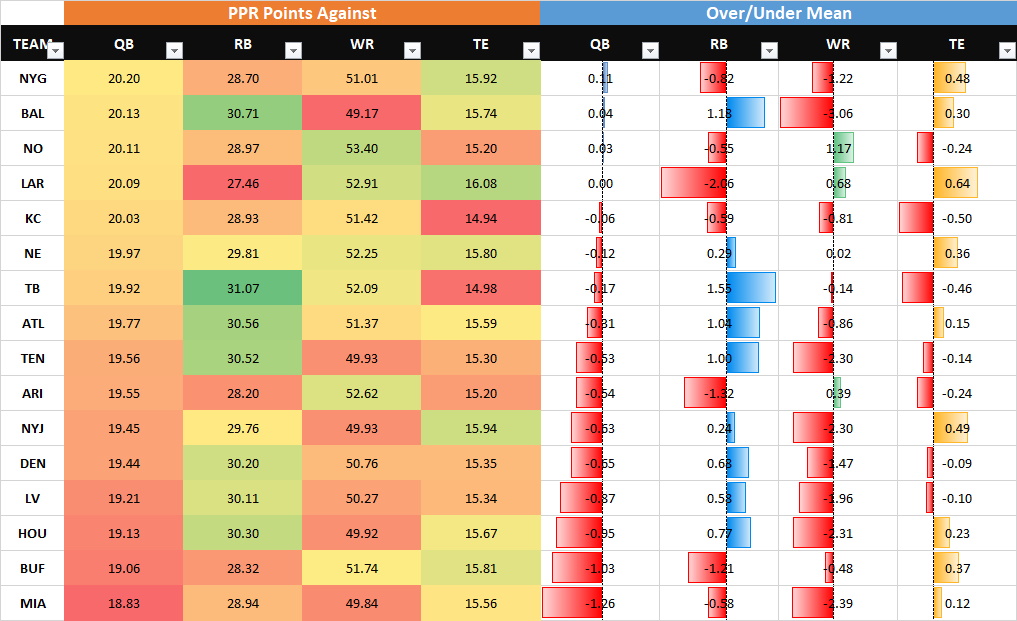
We can also see it play out on a week-by-week basis. For example, Chicago’s “good” quarterback schedule largely plays out over the first few weeks of the season. This is especially important since this data will be “old hat” by the time we get to week four.

Takes and Take-Aways
Carolina has a great start to the season based on this, with an “easy” start and the second-best quarterback schedule overall.
At running back, Detroit also has the “best” schedule overall but I think the most interesting result comes from Baltimore. They have the fourth-best RB schedule overall and start the season facing Cleveland, Houston, Kansas City and Washington who all allowed at least five points or more over average to the running back position in 2019. Baltimore is already a running dominant offense, so Mark Ingram and JK Dobbins could feast early.
San Francisco, while only having the 17th-best wide receiving schedule, starts the seasons off versus five straight plus matchups. Deebo Samuel may have a great chance to continue his solid rookie season early in 2020, and maybe Kendrick Bourne can keep holding that UDFA flag high. Although, I imagine most will be more interested in the rookie Brandon Aiyuk and if he can fare better than his teammate (and fellow underproducing college player) Dante Pettis.
Yes, I took the time to lay some Pettis and Aiyuk shade in here. Bourne for life, baby.
I didn’t notice too much to get excited about at the tight end position, which seems typical. Although George Kittle, Zach Ertz/Dallas Goedert as well as the Rams duo of Tyler Higbee and Gerald Everett all start the season off strong in their first game.
While not a fan of Hayden Hurst, Atlanta’s tight end schedule also had some highlights and very few below-average games, despite having a middling overall schedule. Personally, I’m rooting for Jaeden Graham to emerge, because he’s been decent and costs almost nothing in dynasty right now.
Okay, so, looking over a big static table isn’t fun or very utilitarian. So I put this all in a google sheet that you can sort (by position) and see the week-over-week patterns.
You can find it here: https://docs.google.com/spreadsheets/d/17iczmp2oR8sDaTe8YraFosIJm_Lmv4WqD8cXkHXObRY/edit?usp=sharing
Be sure to go to the “file” menu and chose to “make a copy” of the sheet, so you can have your own version and filter, edit and doodle all you like. I restrict editing access to the master copy so that everyone sees the same thing whenever they look, and no one deletes anything by mistake before someone else can see it.
Anyway, I hope you found this useful or interesting. Thanks for checking it out.
You can find me on Twitter @pahowdy
- Peter Howard: Dynasty Fantasy Football Superflex Rankings Explained - March 6, 2024
- Dynasty Target and Regression Trends: Week 15 - December 23, 2023
- Dynasty Target and Regression Trends: Week 14 - December 16, 2023


