TD Regression Deep Dive: Wide Receivers (Part One)
Welcome back to the TD Regression Deep Dive series. In this third installment, I cover the next position group: wide receivers. If you missed the first two parts, please take some time to read them as my methodology is consistent except for a couple small modifications.
TD Regression Deep Dive Series: Running Backs (Part One)
TD Regression Deep Dive Series: Running Backs (Part Two)
I broke down this process on Twitter for both running backs and wide receivers (@MikeMeUpP) so this may look familiar, but I will expand on some aspects I wasn’t able to get into on Twitter given the character limitations. Without further ado, let’s dive right in.
Step One: TD Dependency
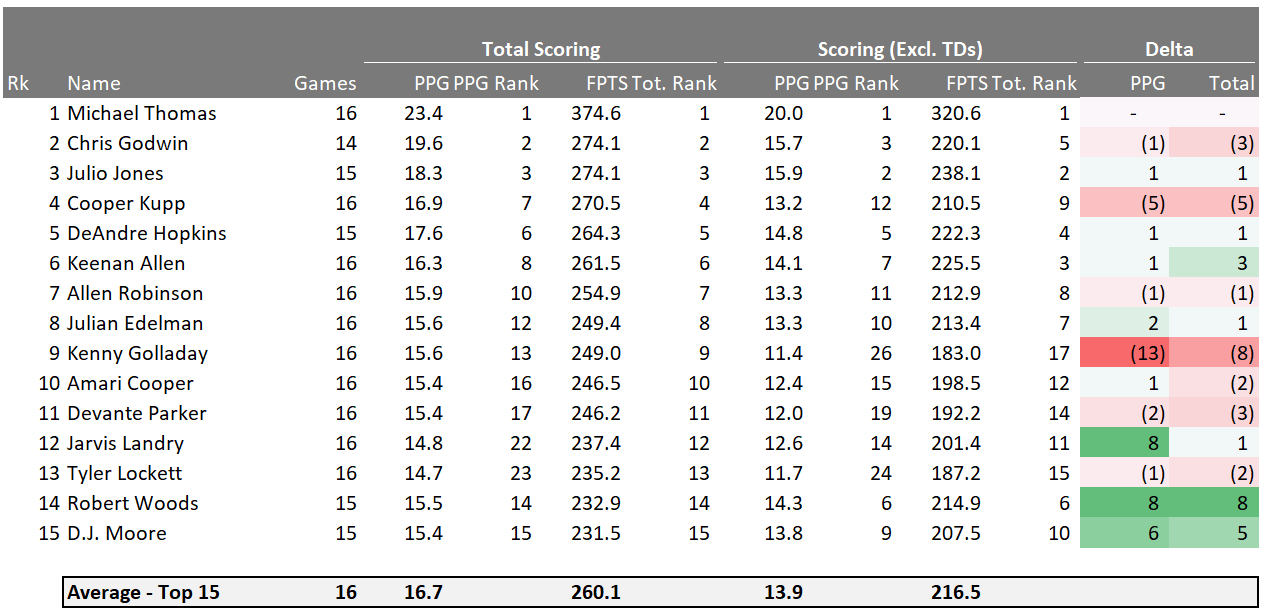
The table above shows how the top-15 wide receivers scored in 2019 including touchdowns versus excluding touchdowns. The point is to show to what extent each player is dependent on touchdowns, i.e., to identify the players who are most impacted by touchdown regression.
The most touchdown dependent wide receivers:
The least touchdown dependent wide receivers:
Not many surprises here, but definitely a couple of interesting takeaways. First, it’s interesting to see two players on the same team but on opposite ends of the spectrum in Kupp and Woods.
Kupp has always been one of Goff’s favorite red zone weapons going back to his rookie season and Woods has never really been a weapon there. This trend may continue going forward, although I expect Woods to add a couple more touchdowns to his stat line based on his yardage and history.
Landry also showed up, which makes sense to me. Outside of the outlier year in Miami where he scored nine touchdowns, he makes his money by accumulating catches and is not a true threat in contested situations. Dynasty darling Moore is in this group as the true WR1 of the Panthers in only his second year. If he is able to unlock touchdown upside going into next season, he should easily crack the top ten as a 23 year old. Sign me up.
Step Two: TD Distribution
The next step of the process digs into the breakdown of touchdowns scored inside 20, 10, and 5 yards.
Why is this important to look at? As we all know, the likelihood of converting a TD grows substantially the closer players get to the goal line. I included inside 20 yards for wide receivers because the dropoff in efficiency from 10 to 20 yards is not nearly as drastic as it is for running backs. If we think about this conceptually, it makes sense because wide receivers benefit more from additional space as it opens up the route tree and allows them to gain separation.

Now let’s take a look at how this shakes out for the top-15 wide receivers from 2019:
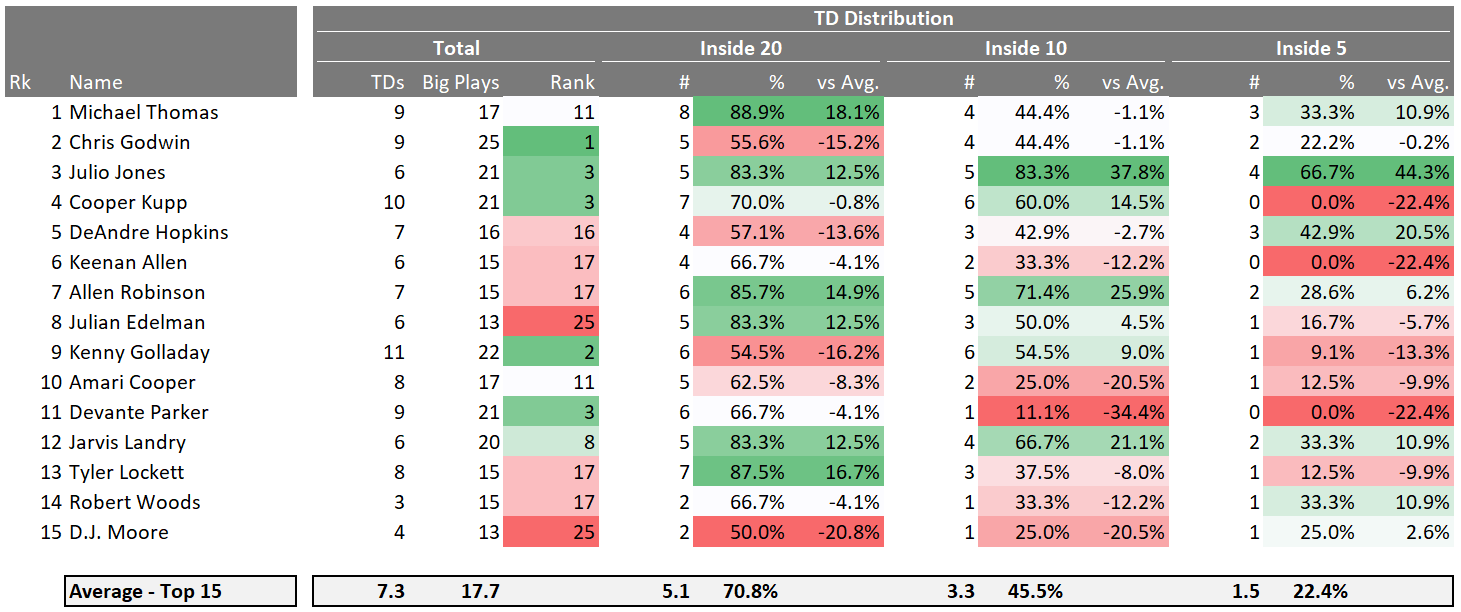
The way to interpret this table is those with a lower percentage of their touchdowns scored inside 20, 10, & 5 are potential candidates for regression as those touchdowns are less sticky and more difficult to repeat year-over-year.
I have also included a column for the # of “Big Plays.” I define these as receptions or carries for more than 20 yards, and the respective ranking for each player compared to all other wide receivers in the NFL is also shown. Players who have a tendency to break big plays are more likely to do so again. I don’t think this completely negates the potential for regression but it may limit its impact.
Based on the above, potential candidates for regression along with their big play rankings are:
- Amari Cooper – 11th
- Kenny Golladay – 2nd
- Chris Godwin – 1st
- DJ Moore – 25th
- DeAndre Hopkins – 16th
I was surprised to see Godwin on this list as he’s not the first name that comes to mind when I think of deep threat. If anything, I would’ve thought Mike Evans is the true deep threat on the team, but Godwin certainly excelled in this department in his breakout season.
Golladay has shown up in both categories up to this point. Although he’s known as the deep threat, it’s definitely something to monitor going forward.
Hopkins is the concerning name for me here. Similar to Godwin, I’d say his teammate Will Fuller is the true deep threat on the Texans. We’ve seen Hopkins’ role change this year as he was only getting short passes. His average depth of target dropped over 13% from 11.9 last year to 10.3 in 2019 per NFL Next Gen. If the trend continues, I’m concerned about his ability to sustain his touchdown output.
Meanwhile, touchdowns for the below players should be much easier to sustain:
- Michael Thomas
- Julio Jones
- Allen Robinson
- Julian Edelman
- Jarvis Landry
Step Three: Red Zone Efficiency
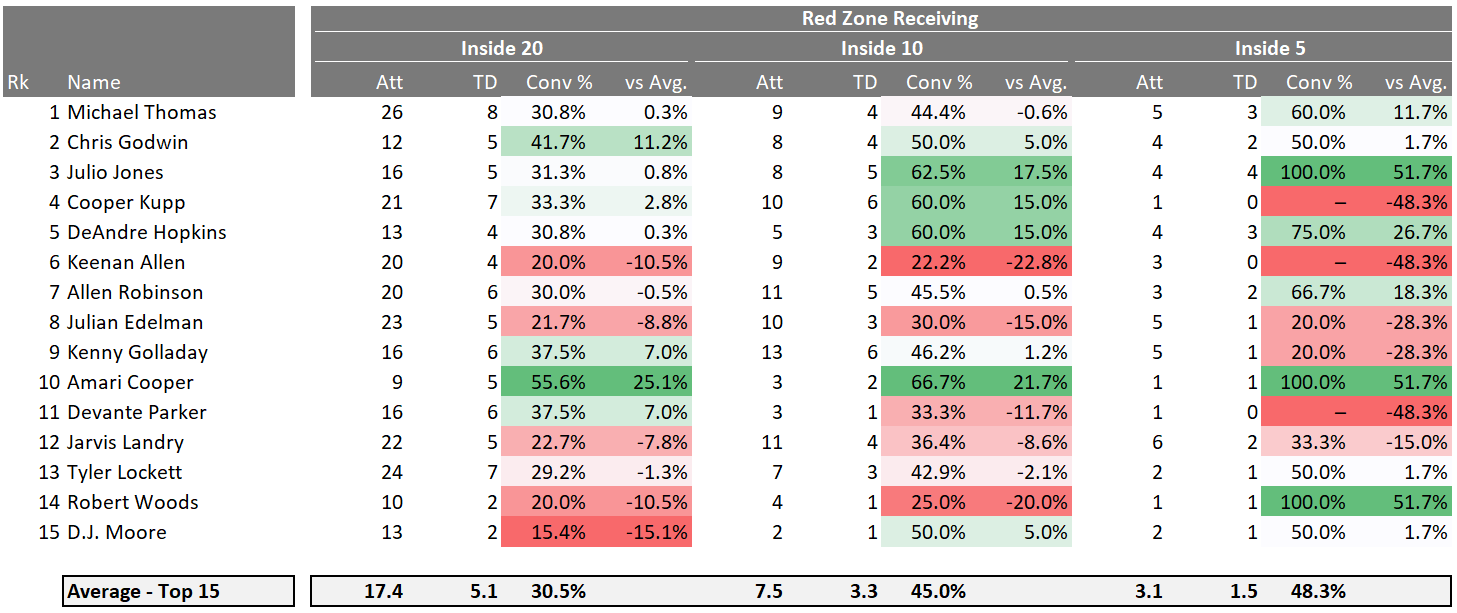
The table above shows the number of attempts and corresponding touchdown conversion percentage for each player.
Based only on the table above, the potential candidates for negative regression are:
- Amari Cooper
- Julio Jones
- DeAndre Hopkins
The potential candidates for positive regression are:
- Keenan Allen
- Julian Edelman
- Jarvis Landry
- Robert Woods
You’ll notice Landry and Woods are players who constantly appear on the positive regression side of the analysis. It’s no coincidence they’re two of my biggest dynasty buys right now. They both consistently outproduce their cost every year. I’ll happily go on a shopping spree for them this off-season. Watch for more the details in the next part of the series.
Below is a quick summary of what we covered so far in terms of the potential areas for regression for each player:
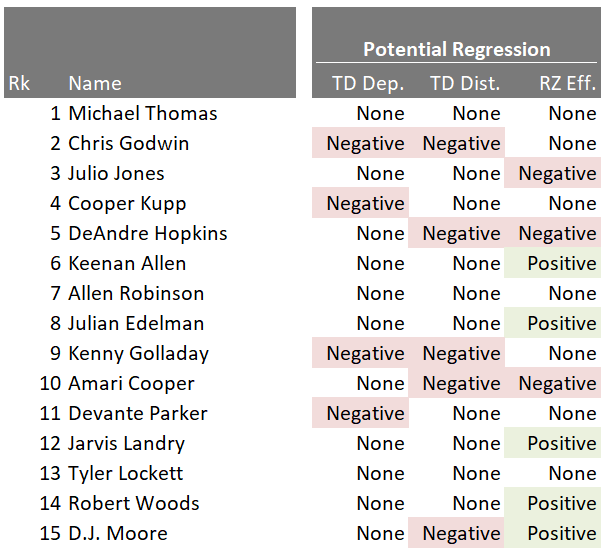
In TD Regression Deep Dive: Wide Receivers (Part Two), I provide more qualitative context by taking a look at each player’s historical red zone efficiency metrics along with my thoughts on their outlook for 2020. I also tie it all together by providing buy, sell, or hold recommendations. See you next time!
- Dynasty Fantasy Football Rookie Update: Clyde Edwards-Helaire, RB KC - May 15, 2020
- 2020 Dynasty Capsule: Cleveland Browns - February 20, 2020
- 2020 Dynasty Capsule: Tampa Bay Buccaneers - February 19, 2020


