New Dynasty Tool Tutorial: How to Use the CFB MS Metric Plot
As part of DLF’s recent acquisition of FFStatistics, we are pleased to announce that the integration of tools has begun and they will soon be readily available to our premium subscribers. As each new resource is released, it will be accompanied by a “how-to” in order to familiarize our readers with the best way to utilize them for fantasy purposes. We start with the CFB MS Metric Plot.
To find this tool, simply choose the “Tools” option from the banner menu and then choose College Market Share App.
What is CFB MS?
If you spend any time at all on Twitter, you have likely come across the abbreviation “MS” at some point. Quite simply put, it just means market share or what percentage and opportunity a player had in a certain stat category of their team’s offense.
This is typically used for wide receivers to determine how much they were involved with targets, receptions, yards, and touchdowns over the course of a season. Market share can also be used for running backs as well but really helps determine which pass catchers stand out amongst the crowd because of the abundance of wideouts on the field for any given play.
Here is a breakdown of the basics:
Market Share of Receiving Yards = Players Receiving Yards/Team Passing Yards
Market Share of Receptions = Players Receptions/Team Completions
Market Share of Receiving Touchdowns = Players Touchdowns/Team Passing Touchdowns
It also helps determine value on offenses that are not as prolific passing the ball as others. Regardless of how much a team throws the ball, anything equal to or above 20% is considered good. If a receiver approaches the 30% threshold, it is considered outstanding.
If you are interested in learning more about market share, Jesse Reeves gives an in-depth description here.
How to Use the CFB MS Metric Plot
To start, we can look at how the top four rookie receivers in yardage this past NFL season fared in college. Here we have AJ Brown, DK Metcalf, Deebo Samuel, and Terry McLaurin. To get the results shown here, simply select the WR position from the drop-down box in section #2, select the receivers you wish to query in section #3, and then select the category you would like to filter in section #4.

We can see here the surprise of the bunch was McLaurin. The Washington Redskins speedster burst on the scene early, hit a lull at the midway point, and then finished strong. Brown and Samuel could have been predicted to perform in their rookie seasons based on this data.
Historical Data
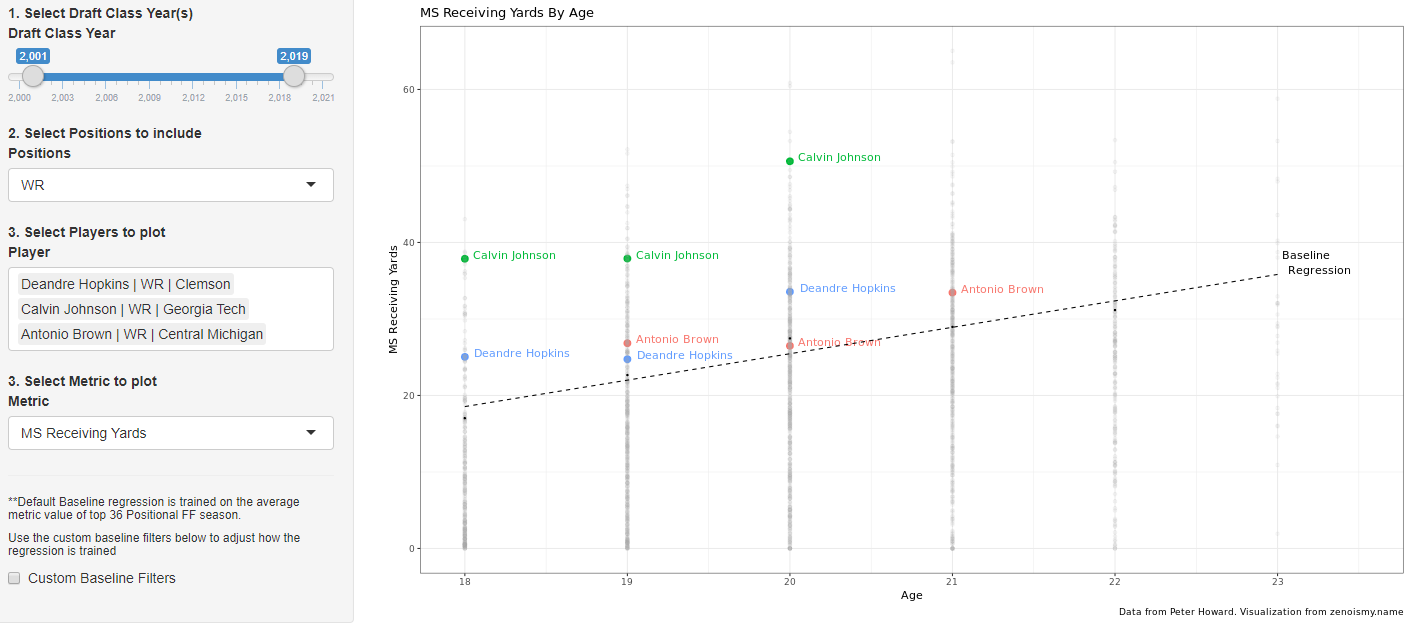
You can also run this data all the way back to 2001. A look at some of the perennial stud receivers in both fantasy and the NFL shows how this data truly does work. This chart shows why it was no shock that Antonio Brown, Calvin Johnson, and DeAndre Hopkins all become stars at the next level. The selection process for these players is the same, you just need to slide the draft class year in section #1 to the desired year you wish to populate from.
As you can see here, the option is available to compare from multiple draft classes over multiple years.
Is CFB MS Fail-Proof?
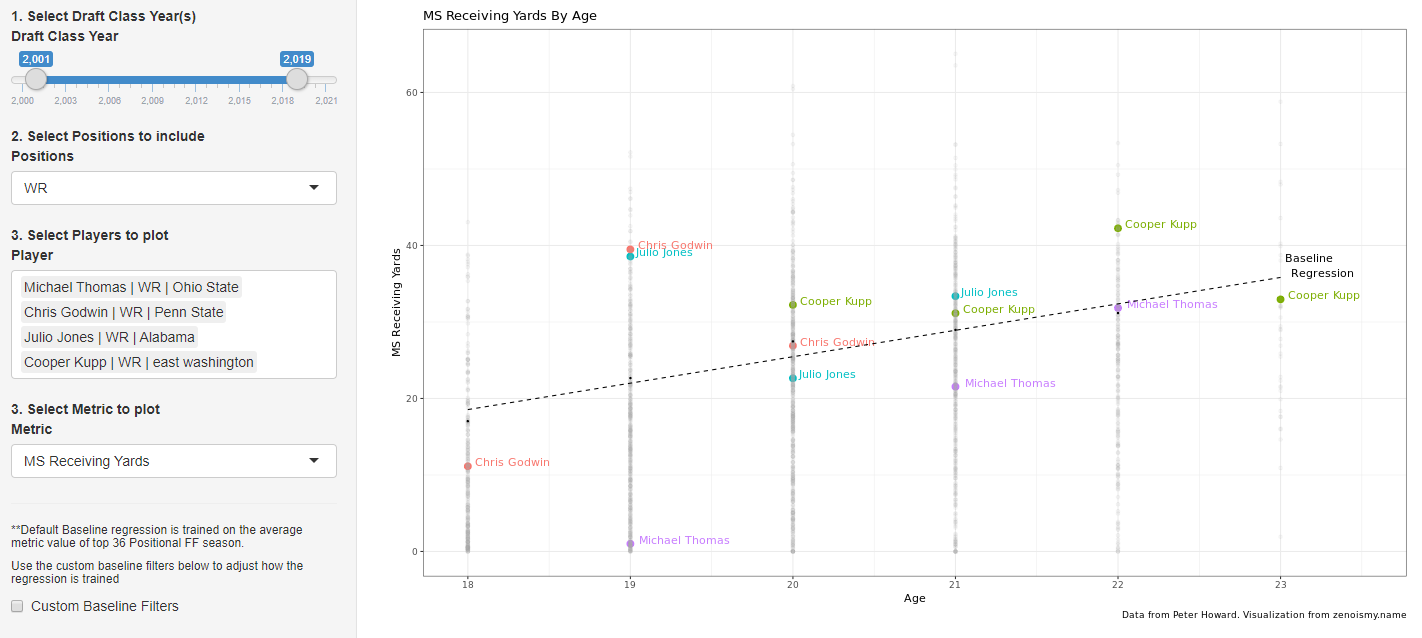
Of course not. As is the case with any data, there are outliers. This next table looks at the top four PPR receivers from the 2019 NFL season. Included along with Michael Thomas are Chris Godwin, Julio Jones, and Cooper Kupp. You can see where market share is a pretty good predictor for success and an invaluable tool to use when evaluating rookie prospects for your dynasty leagues.
What Else Can It Do?
The first three tables displayed some wide receivers and the market share yardage they had at certain ages in college. As mentioned above, you can also use the tool for running backs. Change the value in the drop-down box in section #2 to RB. You can then begin to look at rushing yards, receptions, and touchdowns at the position.
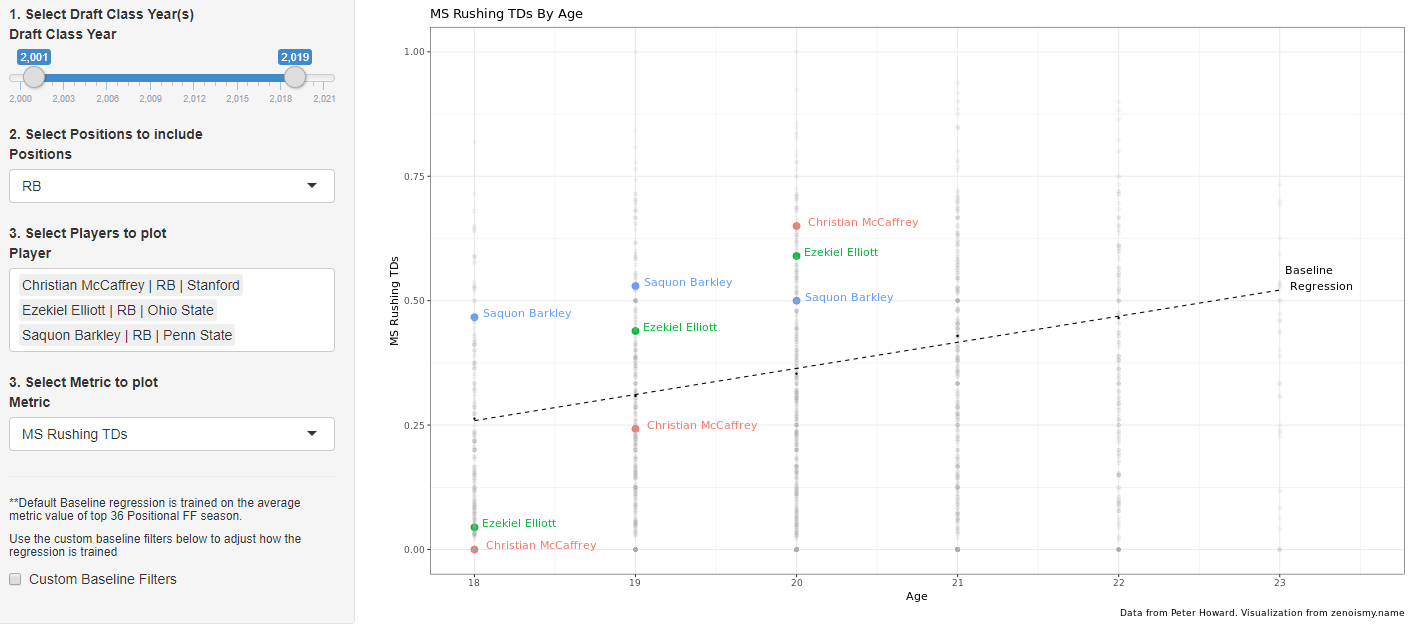
Here we will look at some top fantasy rushers to see how they produced in college as opposed to their first few years in the league. Let us peek at touchdowns instead of yardage. We have Christian McCaffrey, Saquon Barkley, and Ezekiel Elliott in the sample below.
Close examination shows that Barkley accounted for 50% of the Penn State rushing touchdowns in 2017. While touchdowns are certainly highly volatile, the domination displayed at the college level indicated that the trend would likely carry over to the pros.
Wrapping It Up
This is the first of many tutorials on the new and exciting tools that will be integrated into the premium content at DLF. We hope you found this lesson helpful. If you have any questions on how to use this or any other outstanding features on our site please message me on Twitter at @FFJeffSmith. Thank you for reading.
- 2024 Coaching Changes: The Dynasty Impact of Antonio Pierce to the Las Vegas Raiders - April 19, 2024
- 2024 Coaching Changes: The Dynasty Impact of Dave Canales to the Carolina Panthers - March 24, 2024
- Past/Present/Future Rookie Pick Value Recap - March 14, 2024


