Touchdown Scoring Rates Are a Cheat Code for Dynasty Owners
Trying to predict the future is hard. As a community, we devote most of our off-season to it knowing that we’ll be wildly wrong in many, many ways. Except for in broad ways, it’s pretty tough to make perfect predictions at scale about football.
There has been lots of thinking and work done in recent years about the concept of antifragility – the notion that things can and will go wrong so building a roster that will be able to cope with injuries is smarter than building a roster built to live or die on the back of a few star players. This is, of course, the classic ‘studs and duds’ approach dressed up in longer words.
Related to that inherent unpredictability is the search for indicators or variance. What facts and numbers and traits can we identify that suggest a player might be subject to a large swing (either up or down) in the next season?
This article is about one that everyone knows about, but we seem strangely reluctant to pay too much attention too – touchdown scoring rate.
To begin with we need to define TD rate. For this writer, it is simply: “how many TDs a player scores expressed as a percentage of their touches”.
It’s not good enough to simply look at the total number of TDs players score because (like yardage) it’s linked to touches. As always, opportunity and volume tend to define all the normal football stats we like to look at.
The problem is that (unlike yardage) the link between TDs and touches is not that strong. Here’s a quick look at the relationship (split out by position) for the last ten years.
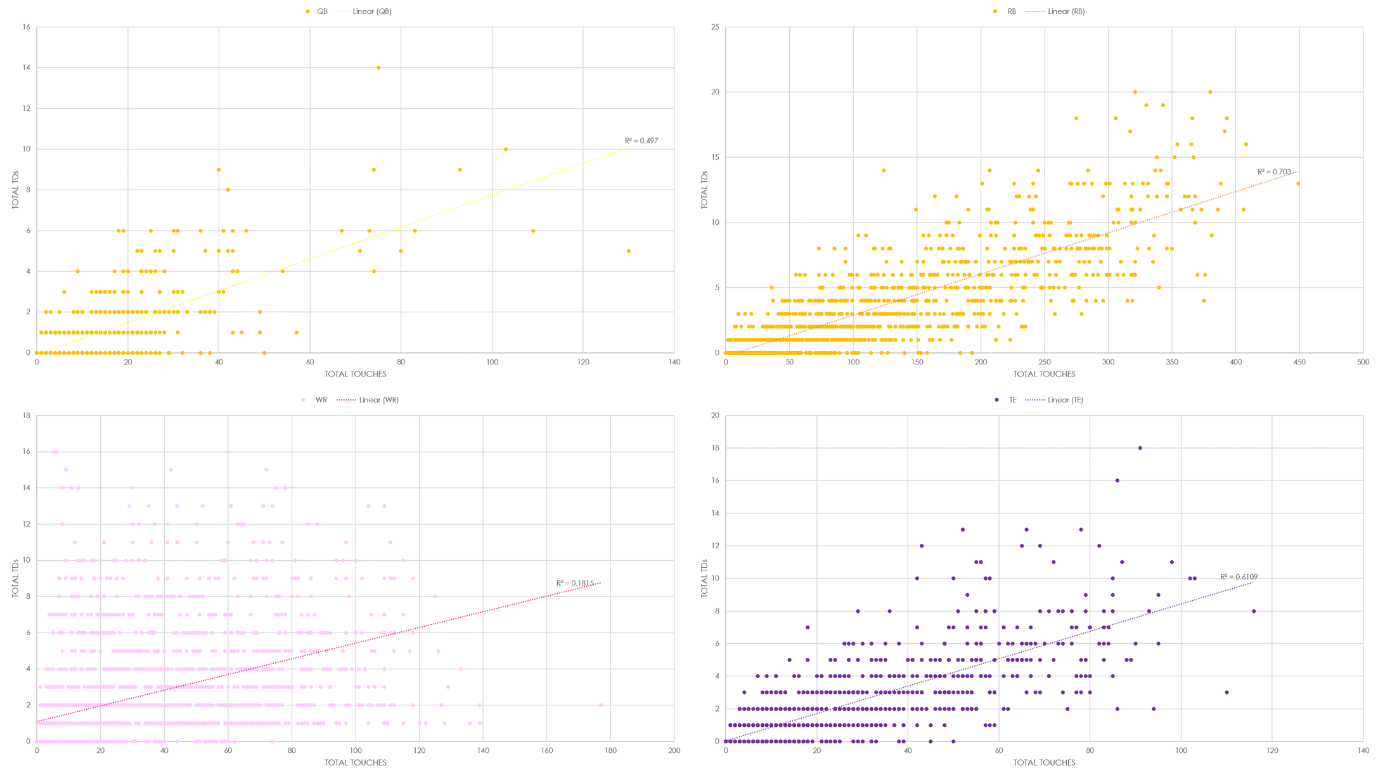
It’s not particularly strong for any of the positions, which is the point here. TDs are a major part of fantasy scoring, so when we look at total points it’s included. But there is a loose relationship between volume and TDs. It’s possible to score plenty of TDs on relatively low touches.
Mike Williams scored 11 TDs from just 50 touches last year, while his team-mate Keenan Allen scored just six times from 106 catches. Sometimes this is due to how a team uses player in the red zone. That’s certainly the popular contention, but it’s often not true. Allen received more red zone targets than Williams last year. Touchdowns are hard to predict.
This is where the exploitable opportunity comes in. Dynasty owners think TD rates are more predictable than they actually are and therefore, don’t factor in changes of TD rate. By identifying obvious cases of regression/progression, you can find opportunities to trade smarter.
The reason it fluctuates so much is that TDs are an incredibly small data point. A running back might touch the ball 200 times in a season (20 backs had that many touches in 2018) and a wide receiver 70 (27 receivers had that many or more in 2018) but touchdowns are rarer.
Only 22 players had double-digit rushing/receiving TDs in 2018. If we take all players in 2018 with five or more touchdowns (excluding passing, defensive and special teams scores), then they made it to the paint on about nine percent of their touches. The variance of a smaller number is always higher, so TDs are inherently less predictable than touches or yards.
On top of this, scoring TDs is often just down to individual decisions. A coach is deciding whether to run or pass on first-and-goal from the one. Just by having a slight tendency towards certain decisions in a given game or year, the players in question can easily end up with several more or fewer scores.
That can be a little difficult to swallow as our footballing instincts tell us that players score at a relatively stable degree. We think some players are just good at scoring, we talk about tall receivers as red zone threats, we refer to goal-line and short-yardage backs. Unfortunately, this is less pronounced than we believe it is.
To prove this, here are a few high-scoring players from the past decade who show just how much TD rate can go up or down.
Cam Newton, QB CAR
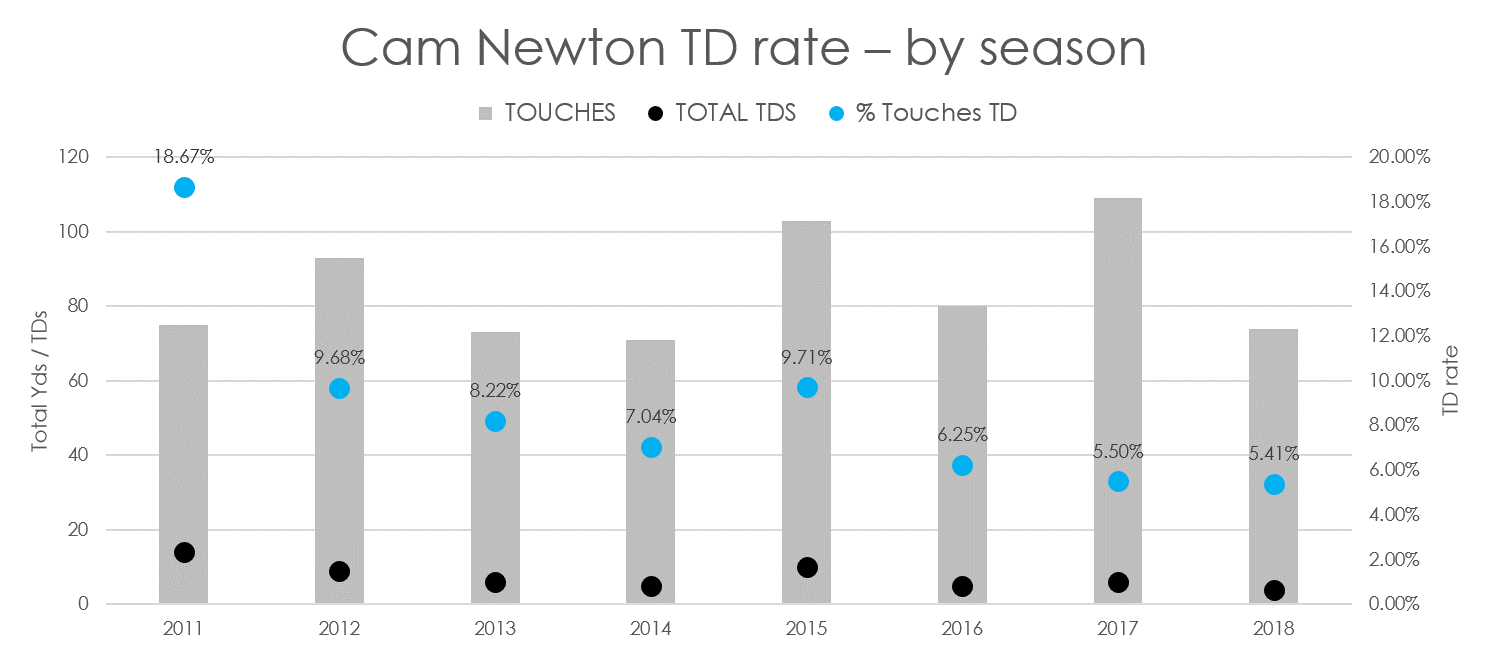
Newton managed a scarcely believable 14 rushing TDs as a rookie. Lo and behold, it proved to be enormously unrepeatable. He’s still a fantastic rusher but he’s averaged just over six TDs a season since that rookie year
Russell Wilson, QB SEA
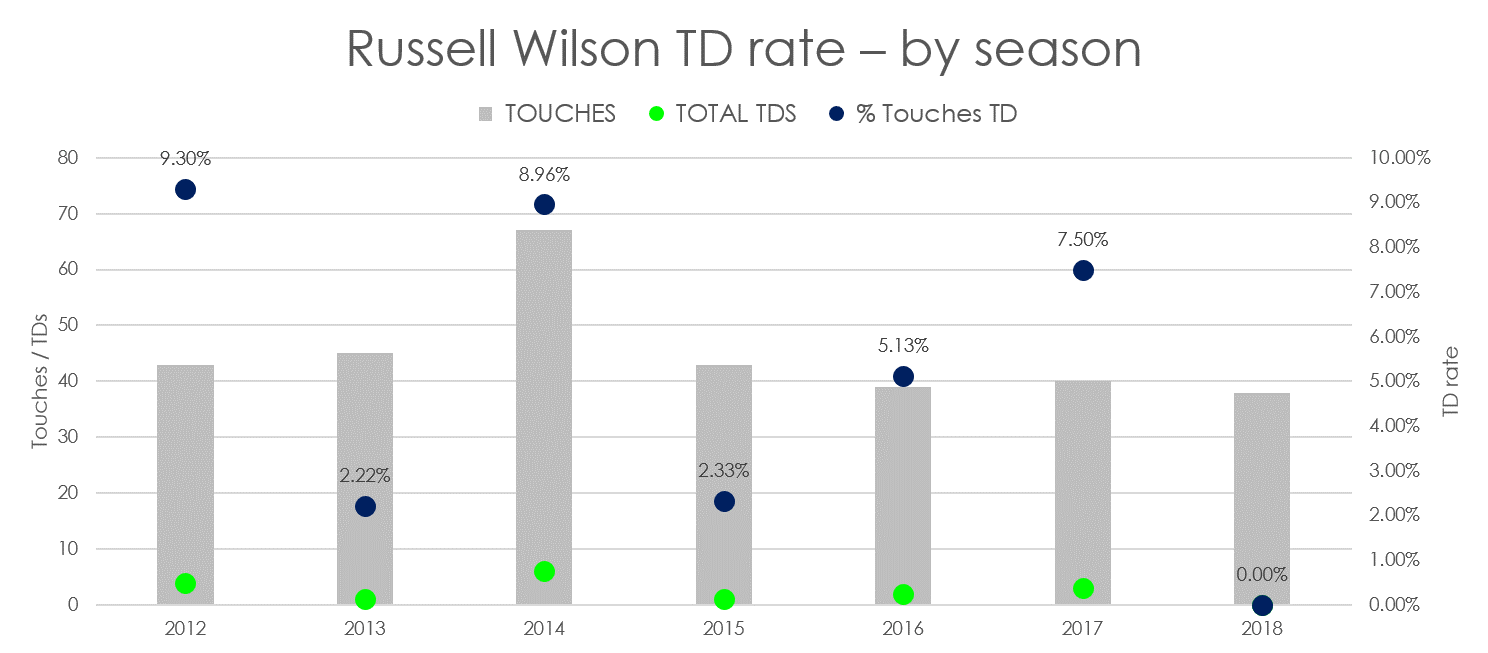
Wilson is a fine rusher but the seasonal fluctuation here is wild. His first four seasons saw four, one, six and one scores on the ground – very tough to predict and a massive difference in fantasy scoring.
Todd Gurley, RB LAR
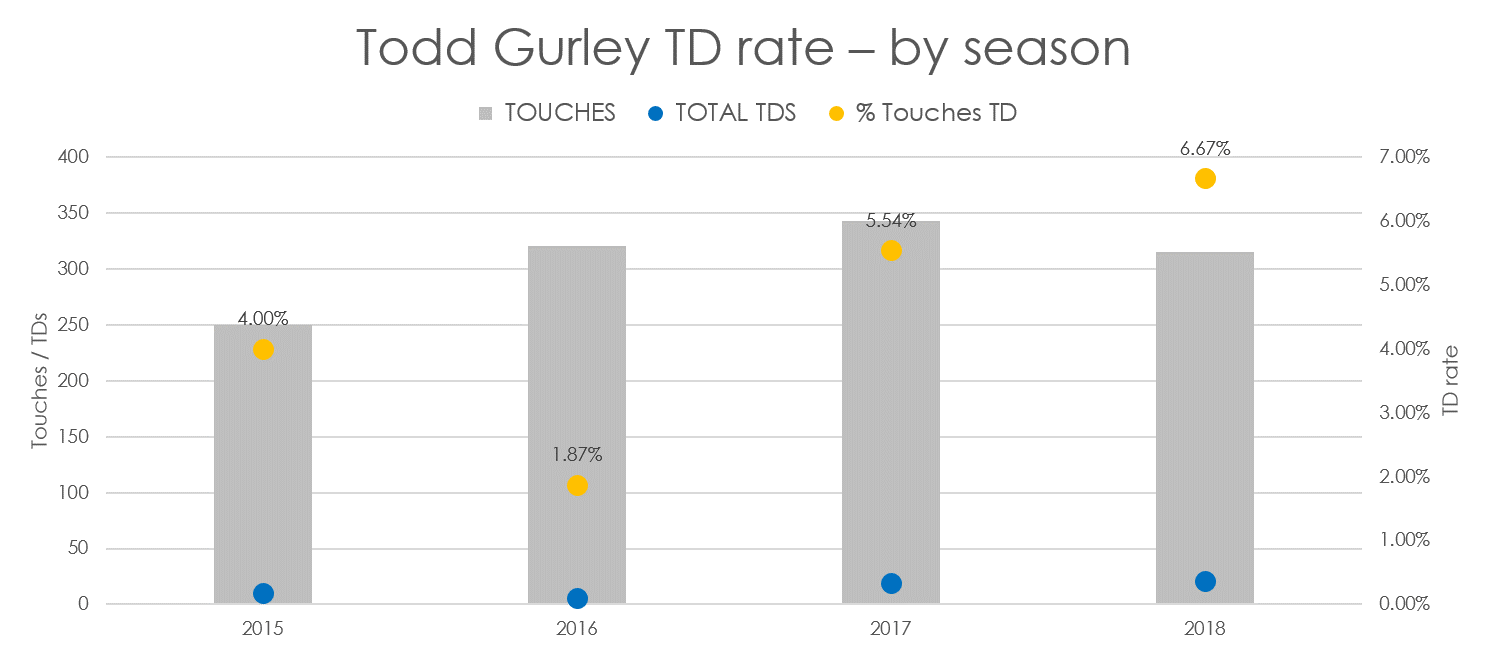
In his second year, Gurley he had just 82 fewer yards from scrimmage than as a rookie. But his value was perceived as taking a big hit – primarily because he scored six TDs instead of the ten he managed in his first year. That shot up to 19 in year three and the rest is history. Looking back the low TD rate in 2016 was an exploitable opportunity.
LeSean McCoy, RB BUF
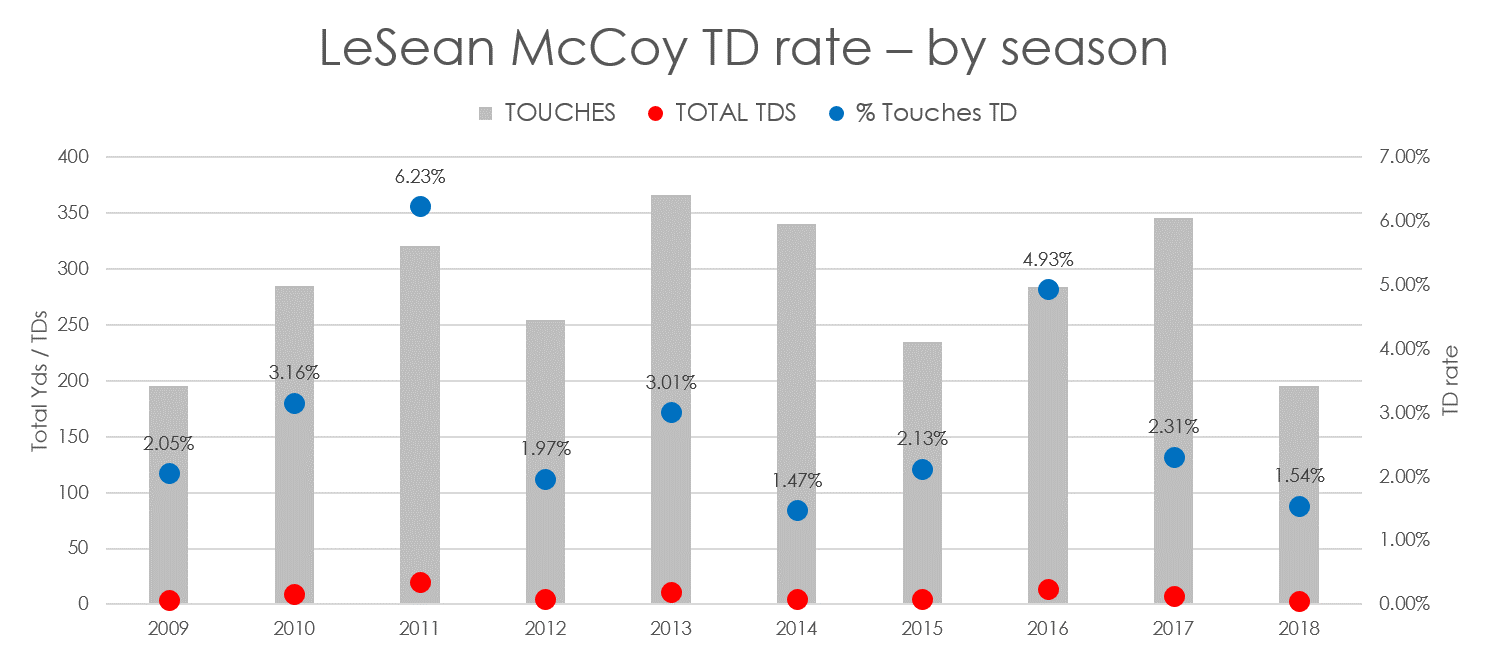
After both 2011 and 2016, ADP for LeSean McCoy was sky-high. However, the fact he managed 20 and 16 TDs in those years was not reliable.
Nelson Agholor, WR PHI
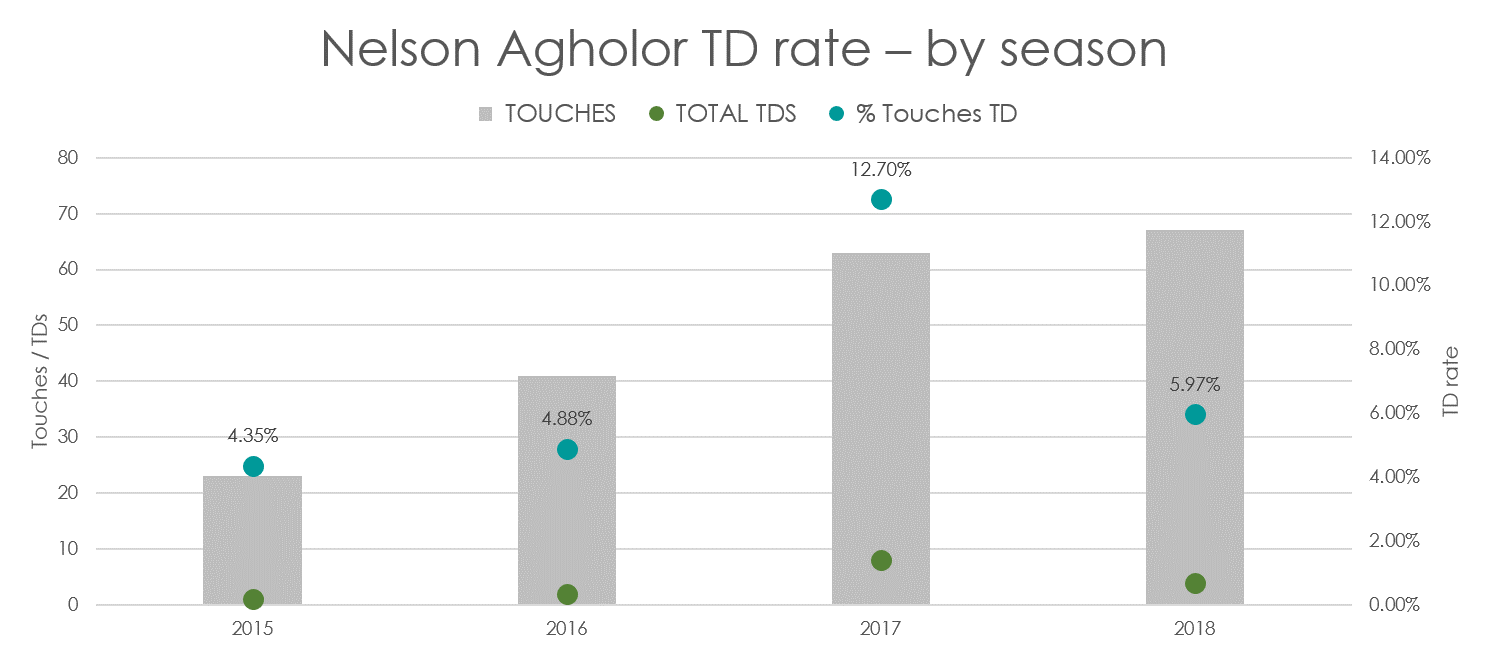
After his first two years, people thought Agholor was terrible. Then he produced eight TDs and his value shot up, before being dashed again on the shores of rationality.
Antonio Brown, WR PIT
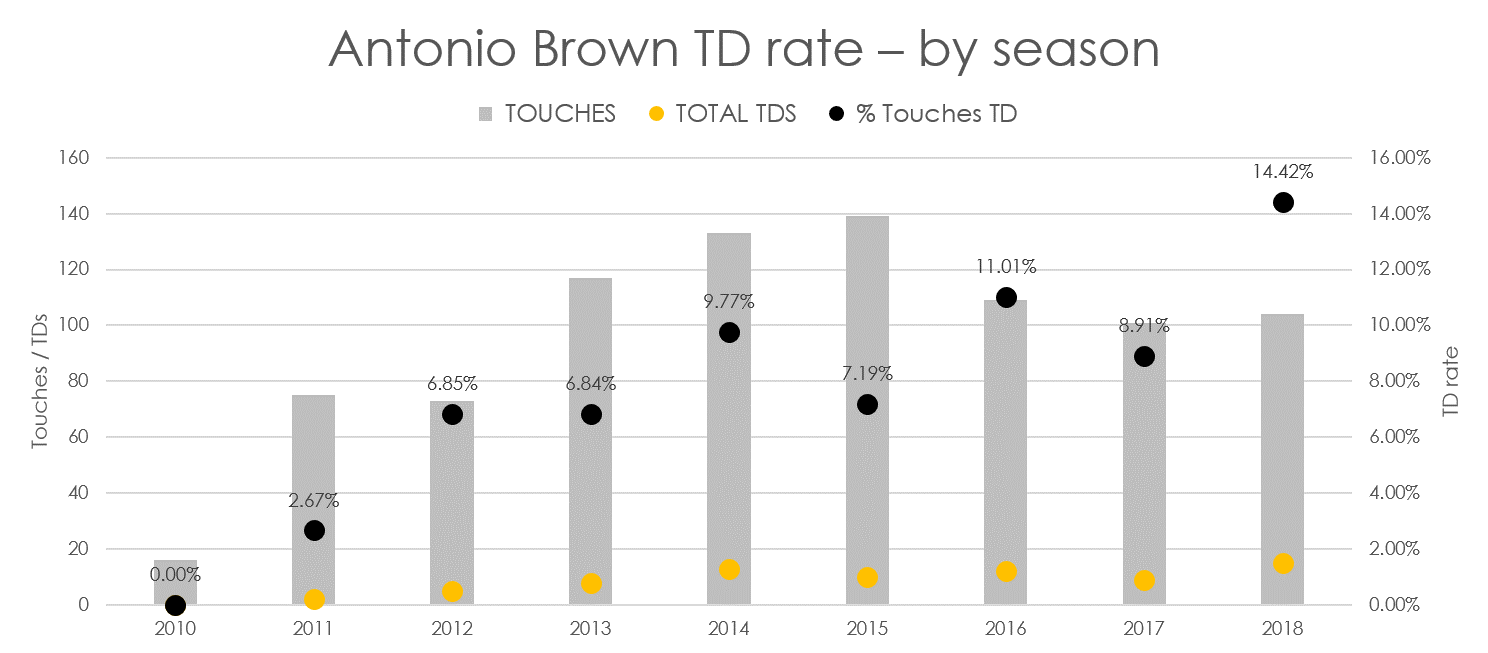
Plenty of people think Brown could equal or even better his scoring rate in Oakland. That’s vanishingly unlikely I’m afraid.
Jimmy Graham, TE GB
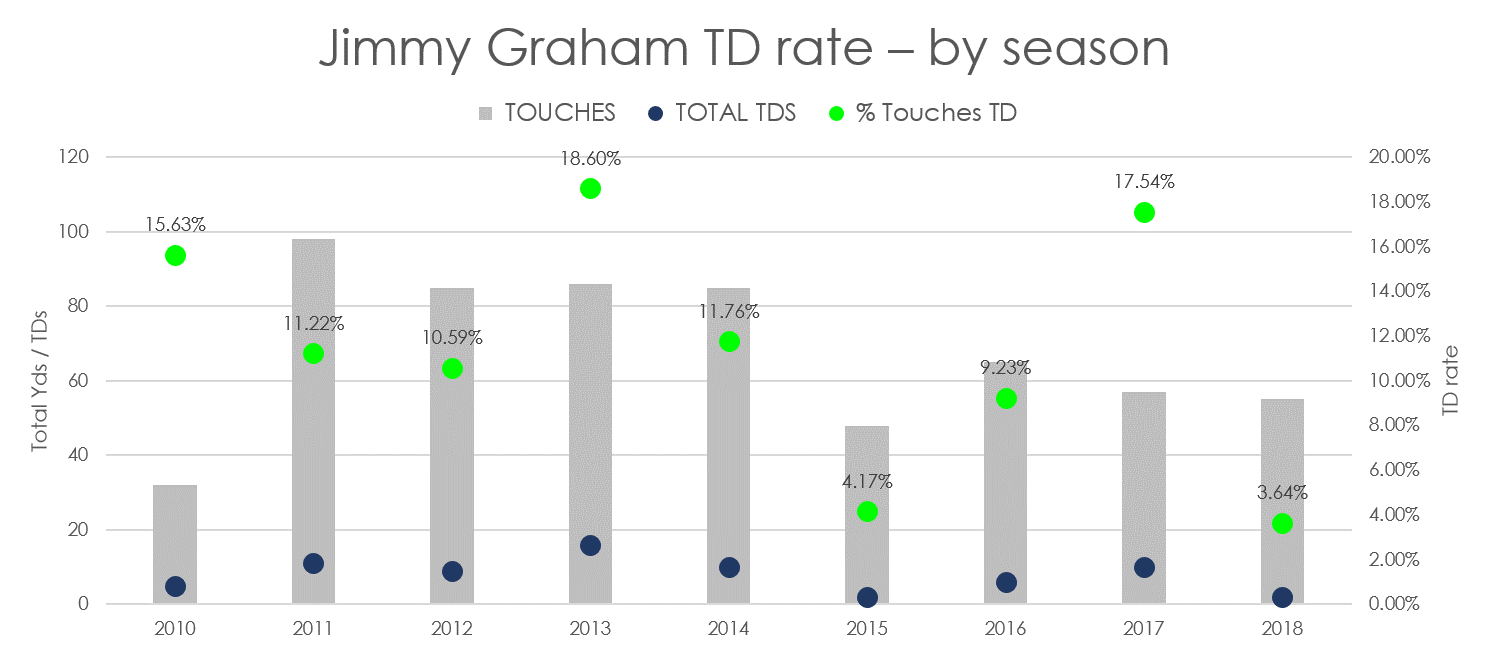
Graham has been a great scorer through his career. 2015 was the first year he spent in Seattle. Remember everyone complaining about how badly they used him? And then his last year in Seattle (2017), he scored ten TDs and everyone thought he’d do the same in Green Bay.
Rob Gronkowski, TE FA
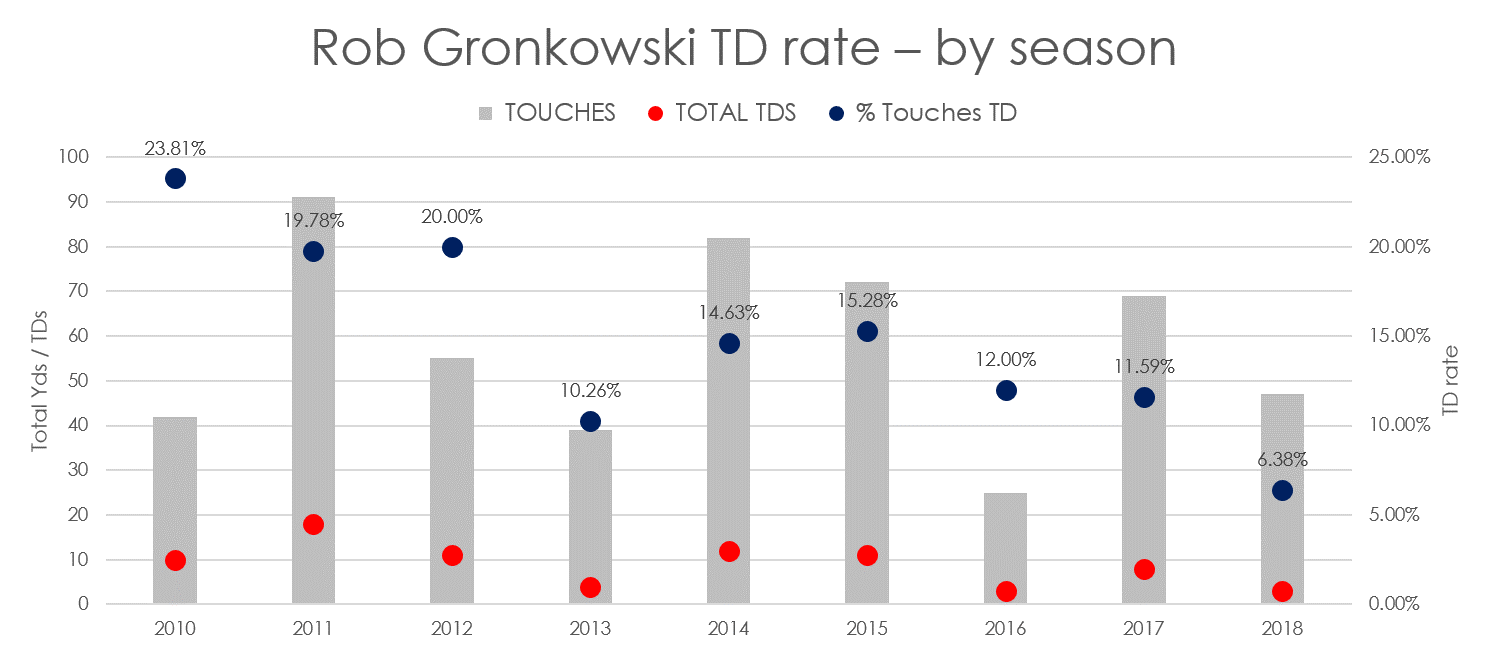
Gronkowski had an amazing career, but his TD scoring was a little erratic. Remember this is compared to snaps, so his injuries shouldn’t affect. But here you can see a clear slide through his career.
Sell high players based on 2018 TD rates
So, the first thing we can do is look for players who had an unusually high TD rate in 2018. These are all sell candidates because the general populace will mostly think they can do the same again. It’s possible – some players can and will repeat high TD seasons. But not most of them. By definition, outliers tend to regress.
Josh Allen, QB BUF
There’s only one real option here. Allen had 89 rushing attempts/scrambles as a rookie and scored eight TDs on them. That’s about nine percent. Cam Newton has only finished with a higher TD rate than that in three of his eight seasons.
Todd Gurley, RB LAR
Gurley managed a stunning 21 TDs on 315 touches. Even without any health concerns, I doubt he could match that sort of volume or ratio.
James White, RB NE
White scored 12 times on just 181 touches. He could match his yardage total but he’s unlikely to score so freely again.
Derrick Henry, RB TEN
The big man scored 12 TDs on a relatively low 230 touches and got four of them in one game. Aside from the off-season coachspeak about how much work he’s going to get, he’ll struggle to hit the same TD rate.
Antonio Brown, WR OAK
Brown managed his 15 TDs on 104 touches last year. That 14%+ ratio is asking a lot.
Mike Williams, WR LAC
As above, Williams had his breakout season by scoring 11 TDs on just 50 touches. That’s astonishing. He could easily have a lot more catches in 2019 but he’d need to double the number to feel confident about repeating that touchdown rate.
Tyler Lockett, WR SEA
Lockett finally paid back all the patience invested in him but looking closer he managed was sixth in WR TDs but just 28th in WR touches. That is unsustainable.
Calvin Ridley, WR ATL
Ridley had exactly the same number of touches and scores as Lockett (ten from 69). He’s another player who feasibly could see more volume but is likely to be less efficient.
Eric Ebron, TE IND
Ebron is the poster child of this article. His defenders will tell you how much Andrew Luck loves throwing to TEs and how good he was in 2018. But 13 TDs on just 66 touches is not repeatable.
Cameron Brate, TE TB
Brate is a good player and very efficient (compared to other TEs) given he lines up mostly in the slot, but his six TDs from just 30 touches is very unusual. He’ll need a lot more catches in a crowded offense to match that total.
Buy low players based on 2018 TD rates
Lamar Jackson, QB BAL
It’s very trendy to bash Jackson this off-season. This is one place you’ll see positivity. He only scored five TDs on his massive 130 rushes last year. We all expect him to rush less but expecting more scores per rush is also very sensible.
Russell Wilson, QB SEA
Wilson had the sixth most rushes of all QBs in 2018 but did not score a single rushing TD for the first time in his career. Expect that to change in 2019.
David Johnson, RB ARI
Johnson managed ten TDs in 2018 which isn’t bad at all, but his rate was just 3.2% – less than half of Gurley’s. Expect better scoring in Kliff Kingsbury’s Air Raid offense.
Ezekiel Elliott, RB DAL
Elliott led all RBs in 2018 with 381 touches – a monster workload. But he managed just nine TDs. Put another way, he had 29 more touches than Saquon Barkley but six fewer scores. He’s a clear candidate for more scores if he can maintain health with that amount of touches.
Peyton Barber, RB TB
Barber is an unfashionable name – partially because his TD rate was just 2.4% in 2018. But he seems to be the lead back in a Bruce Arians offense. If he hits the same number of touches (254), we should expect four or five more scores.
JuJu Smith-Schuster, WR PIT
The most likable player in the NFL scored on just 6.3% of his touches in 2018. Expecting two more scores would not be unfair.
Taylor Gabriel, WR CHI
The Bears’ playmaking receiver managed just two scores last year from a whopping 76 touches. He actually had more touches and more yards than Larry Fitzgerald – but the low TD rate again makes people think he was bad.
George Kittle, TE SF
Kittle had an astonishing, record-setting season in 2018. He had almost 300 yards more than any other TE purely in YAC. Despite all that, he managed just five scores which were half that of Travis Kelce. Expect fewer long runs but more celebrations.
- Ten IDP Fantasy Football Stats You Need to Know after Week 16 - December 29, 2023
- Ten IDP Fantasy Football Stats You Need to Know after Week 15 - December 22, 2023
- Ten IDP Fantasy Football Stats You Need to Know after Week 14 - December 14, 2023


