How Well Do We React to New Rookie Information?
This 2019 season marks my third year of contributing to the DLF rookie rankings. Over time, I’ve had various questions and theories run around in the back of my head while adjusting those rankings. Perhaps the most common one has been: Am I overreacting? Is everyone overreacting? Are we wrong now, or were we wrong then, or are we merely less or more wrong now than we were?
While the dynasty community does its best to maintain patience with rookies, there are numerous examples of players with volatile year-one values. Of course, that’s generally for good reason, as players’ circumstances and expectations change quickly and easily. With this back-and-forth constantly in the back of my head, I decided to put six years of DLF ADP data to work and come to a better understanding.
I started simply, by looking at ADP from August (representative of the pre-season) through December (representative of the post-season/near post-season) of every player’s first five seasons. Now, we can see how well one period’s ADP predicts another period’s, by looking at their shared R-squared coefficient. (I thought about adding a correlation matrix with those R-squared values, but ultimately thought it was too messy to include). Let’s look at how strongly early ADPs relate to later ones, for all given players:
(For the uninitiated, R-squared basically means “how much one variable explains the variance in another variable.” An R-squared of 1 means one variable perfectly predicts the other, while an R-squared of 0 means that it doesn’t explain the other at all, and so on.)
These results are encouraging: The generally-increasing R-squared values, as we move on in players’ careers (as we move down the table), means that we do, indeed, get better at predicting success as we learn more about players. However, what’s more interesting to me is that those increases aren’t steady from period to period; for example, we see larger jumps in predictiveness from October to November than from November to December in Year 1. This indicates that there may actually be some time frames during which we should be paying particularly close attention.
First, you’ll notice a fairly significant increase in R-squared measures from August to October in Year 1, as owners digest rookies’ first months of regular season play — the part of the season that we’re in now. From those numbers, it seems that we have a better idea of which players will produce sooner and later than expected. For an idea of past examples of these players, I put together a plot of past players who have seen their ADP fall or rise “significantly” (defined, for math people, as the difference of their logged ADPs being greater than 0.33):
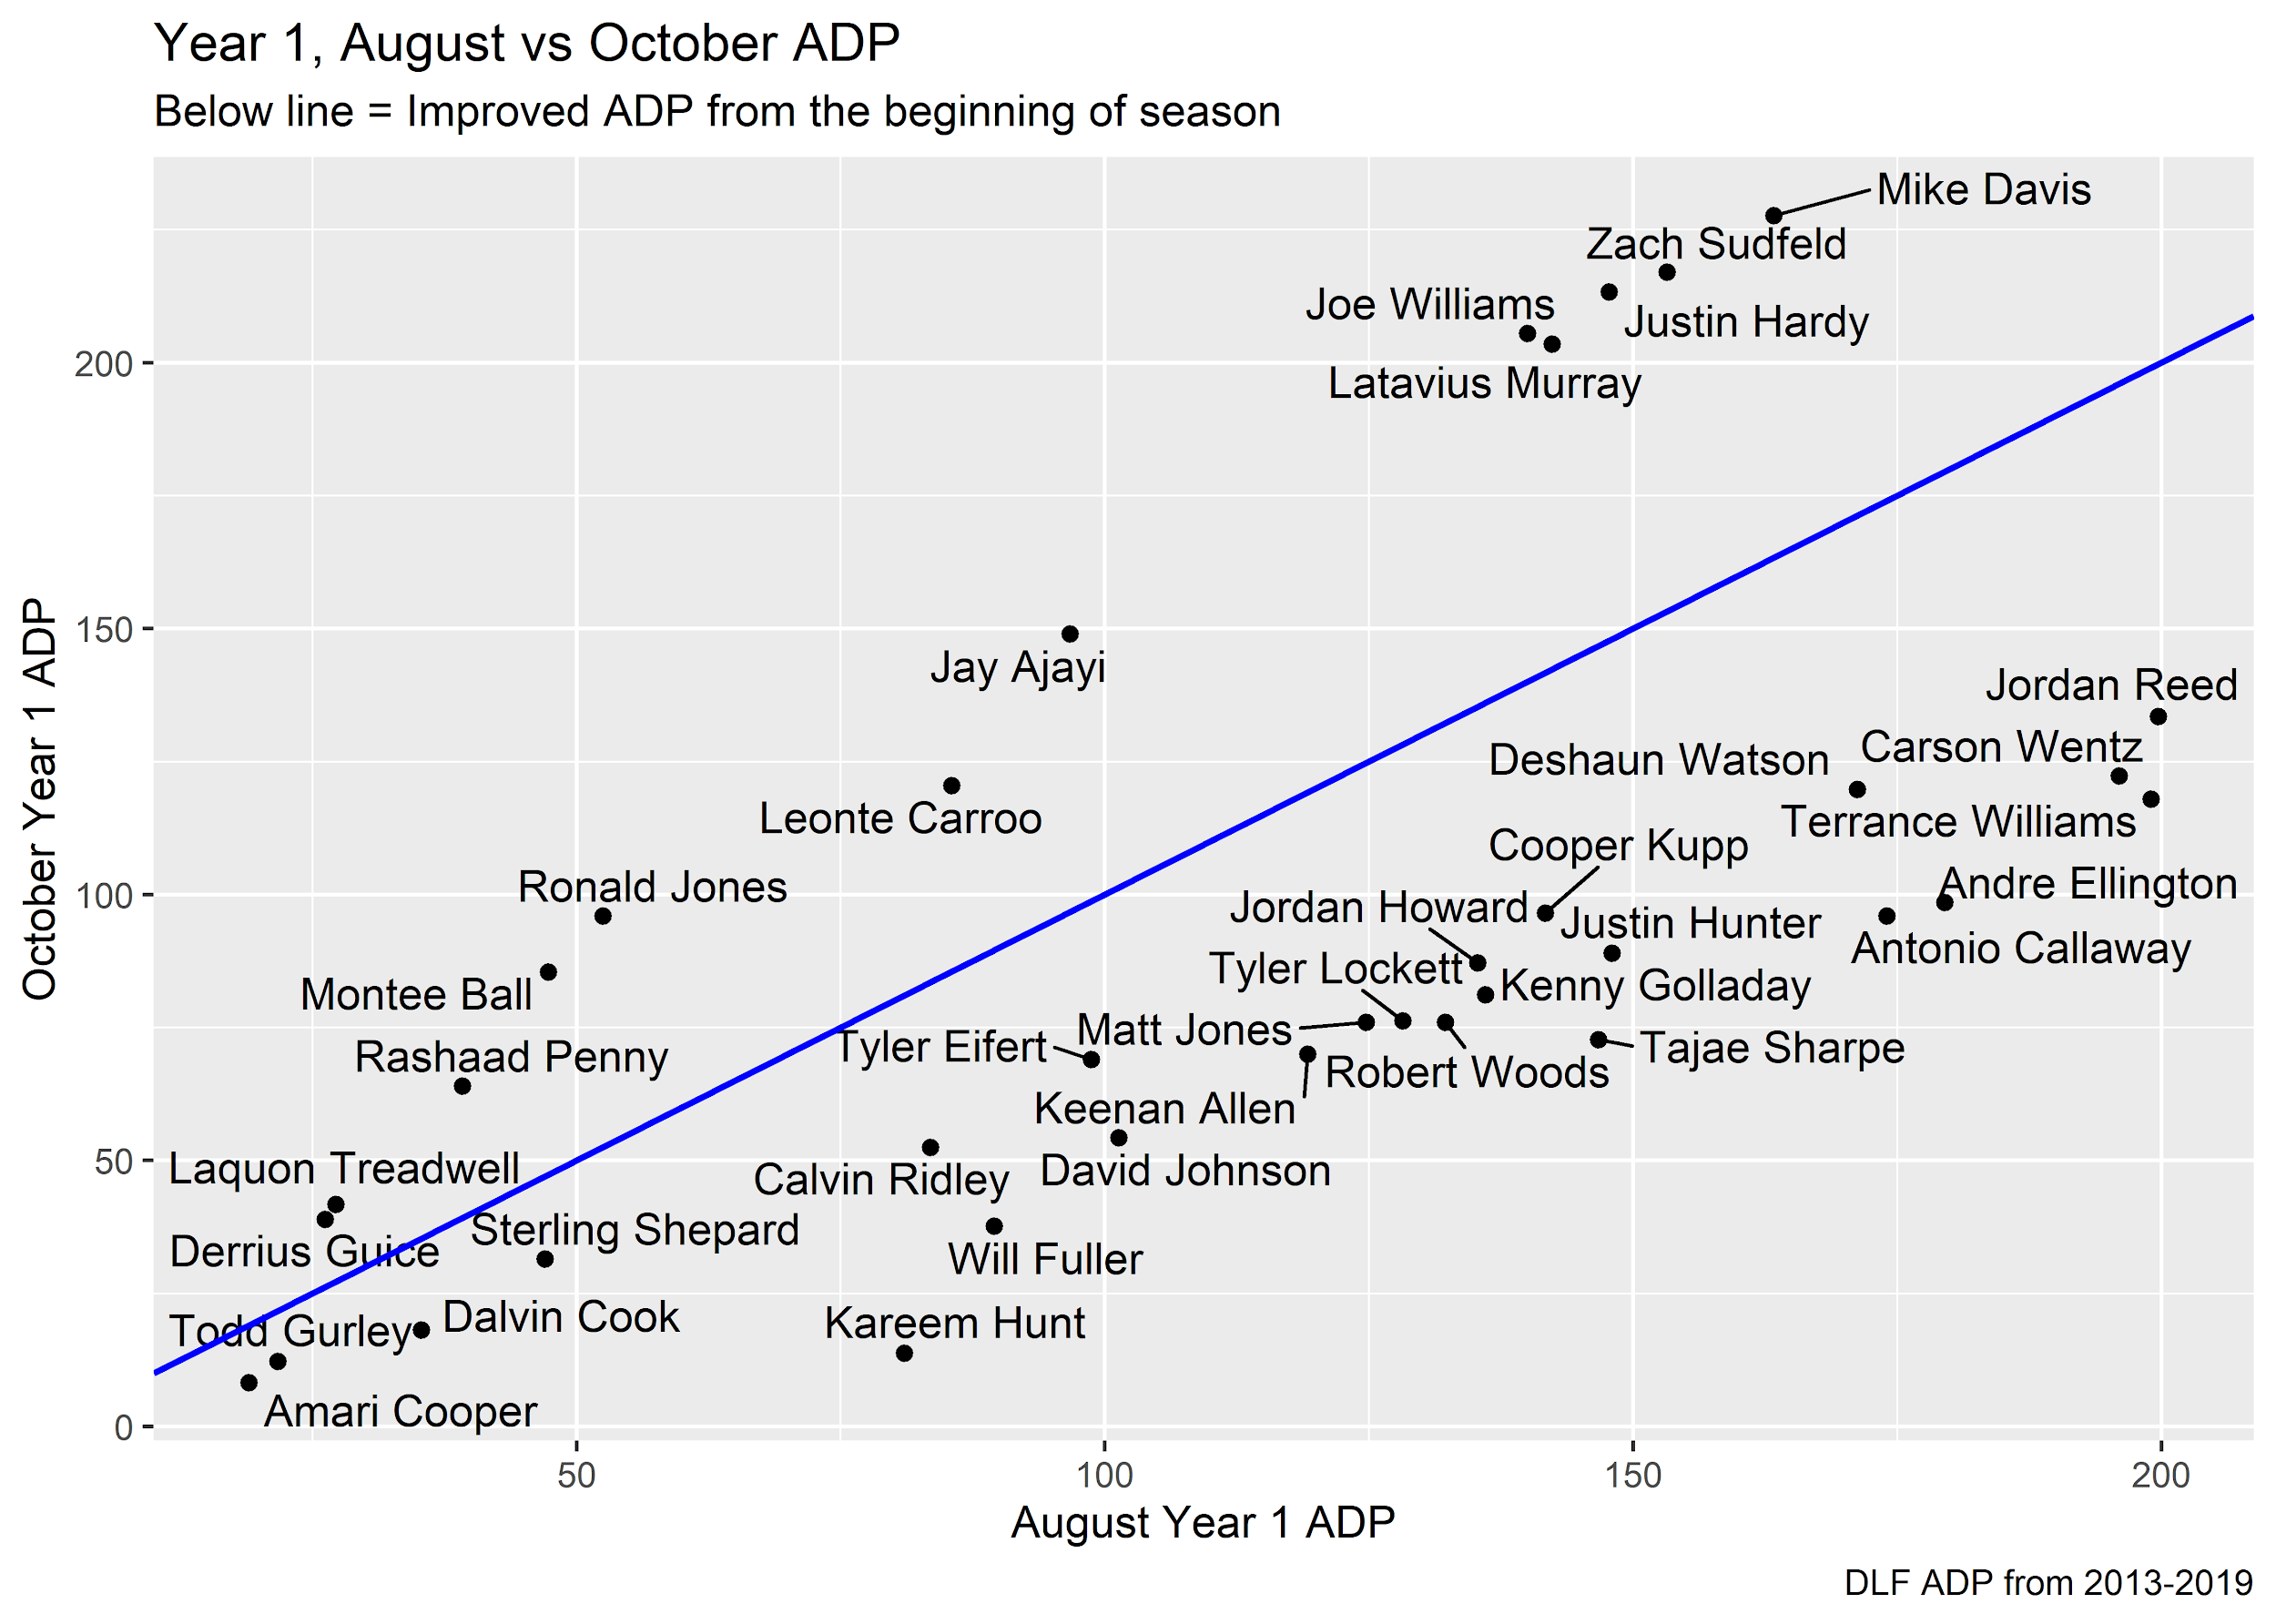
The players plotted below the blue line saw their ADPs “fall” (for example, from 100th to 50th) and their values increase from the preseason into October, while the players plotted above the line took a significant drop in value. Let’s call that first group “risers” and the second group “fallers.” There is no shortage of notable names on that graph.
Start by looking at the risers. With a passing glance, you’ll see some awesome breakouts, such as Keenan Allen, David Johnson, and Kenny Golladay. Each of them showed much more promise than expected heading into the season, saw their values increase, and have sustained that productivity quite well. But, look more closely, and you’ll also see plenty of cautionary tales: Terrance Williams, Matt Jones, and Tajae Sharpe. While those three certainly picked up steam early in the season, it uh, hasn’t quite worked out for them?
Now, observe the other side of the line, and you see a different story. Three highly-drafted running backs from 2018 will try to join Jay Ajayi and Latavius Murray as the only fallers to enjoy any level of meaningful success in the NFL. Some fallers, like cult favorites Leonte Carroo and Joe Williams, almost immediately dashed owners’ hopes, while others, like Laquon Treadwell, allowed for a much slower burn.
Regardless, it seems like the dynasty community adjusted pretty well to that new information. Out of 21 risers with three years to their name, 13 have gained and sustained significant value from where they were originally drafted, while just four experienced a significant drop. Meanwhile, seven of nine fallers flamed out in just three years. We generally have a good idea of when guys should be catching on, but we’ve had a great idea of when it’s not going to work out.
Next, look at the next step in time periods: We gain another set of useful information in the second month of the season, as the R-squared values see their greatest increase from one period to the next. Viewing a similar plot of risers and fallers, this time of year allows for owners to identify players who have settled into their roles, moved up the ladder, and put in good work. It also allows owners to see which players they might have gotten too excited about:
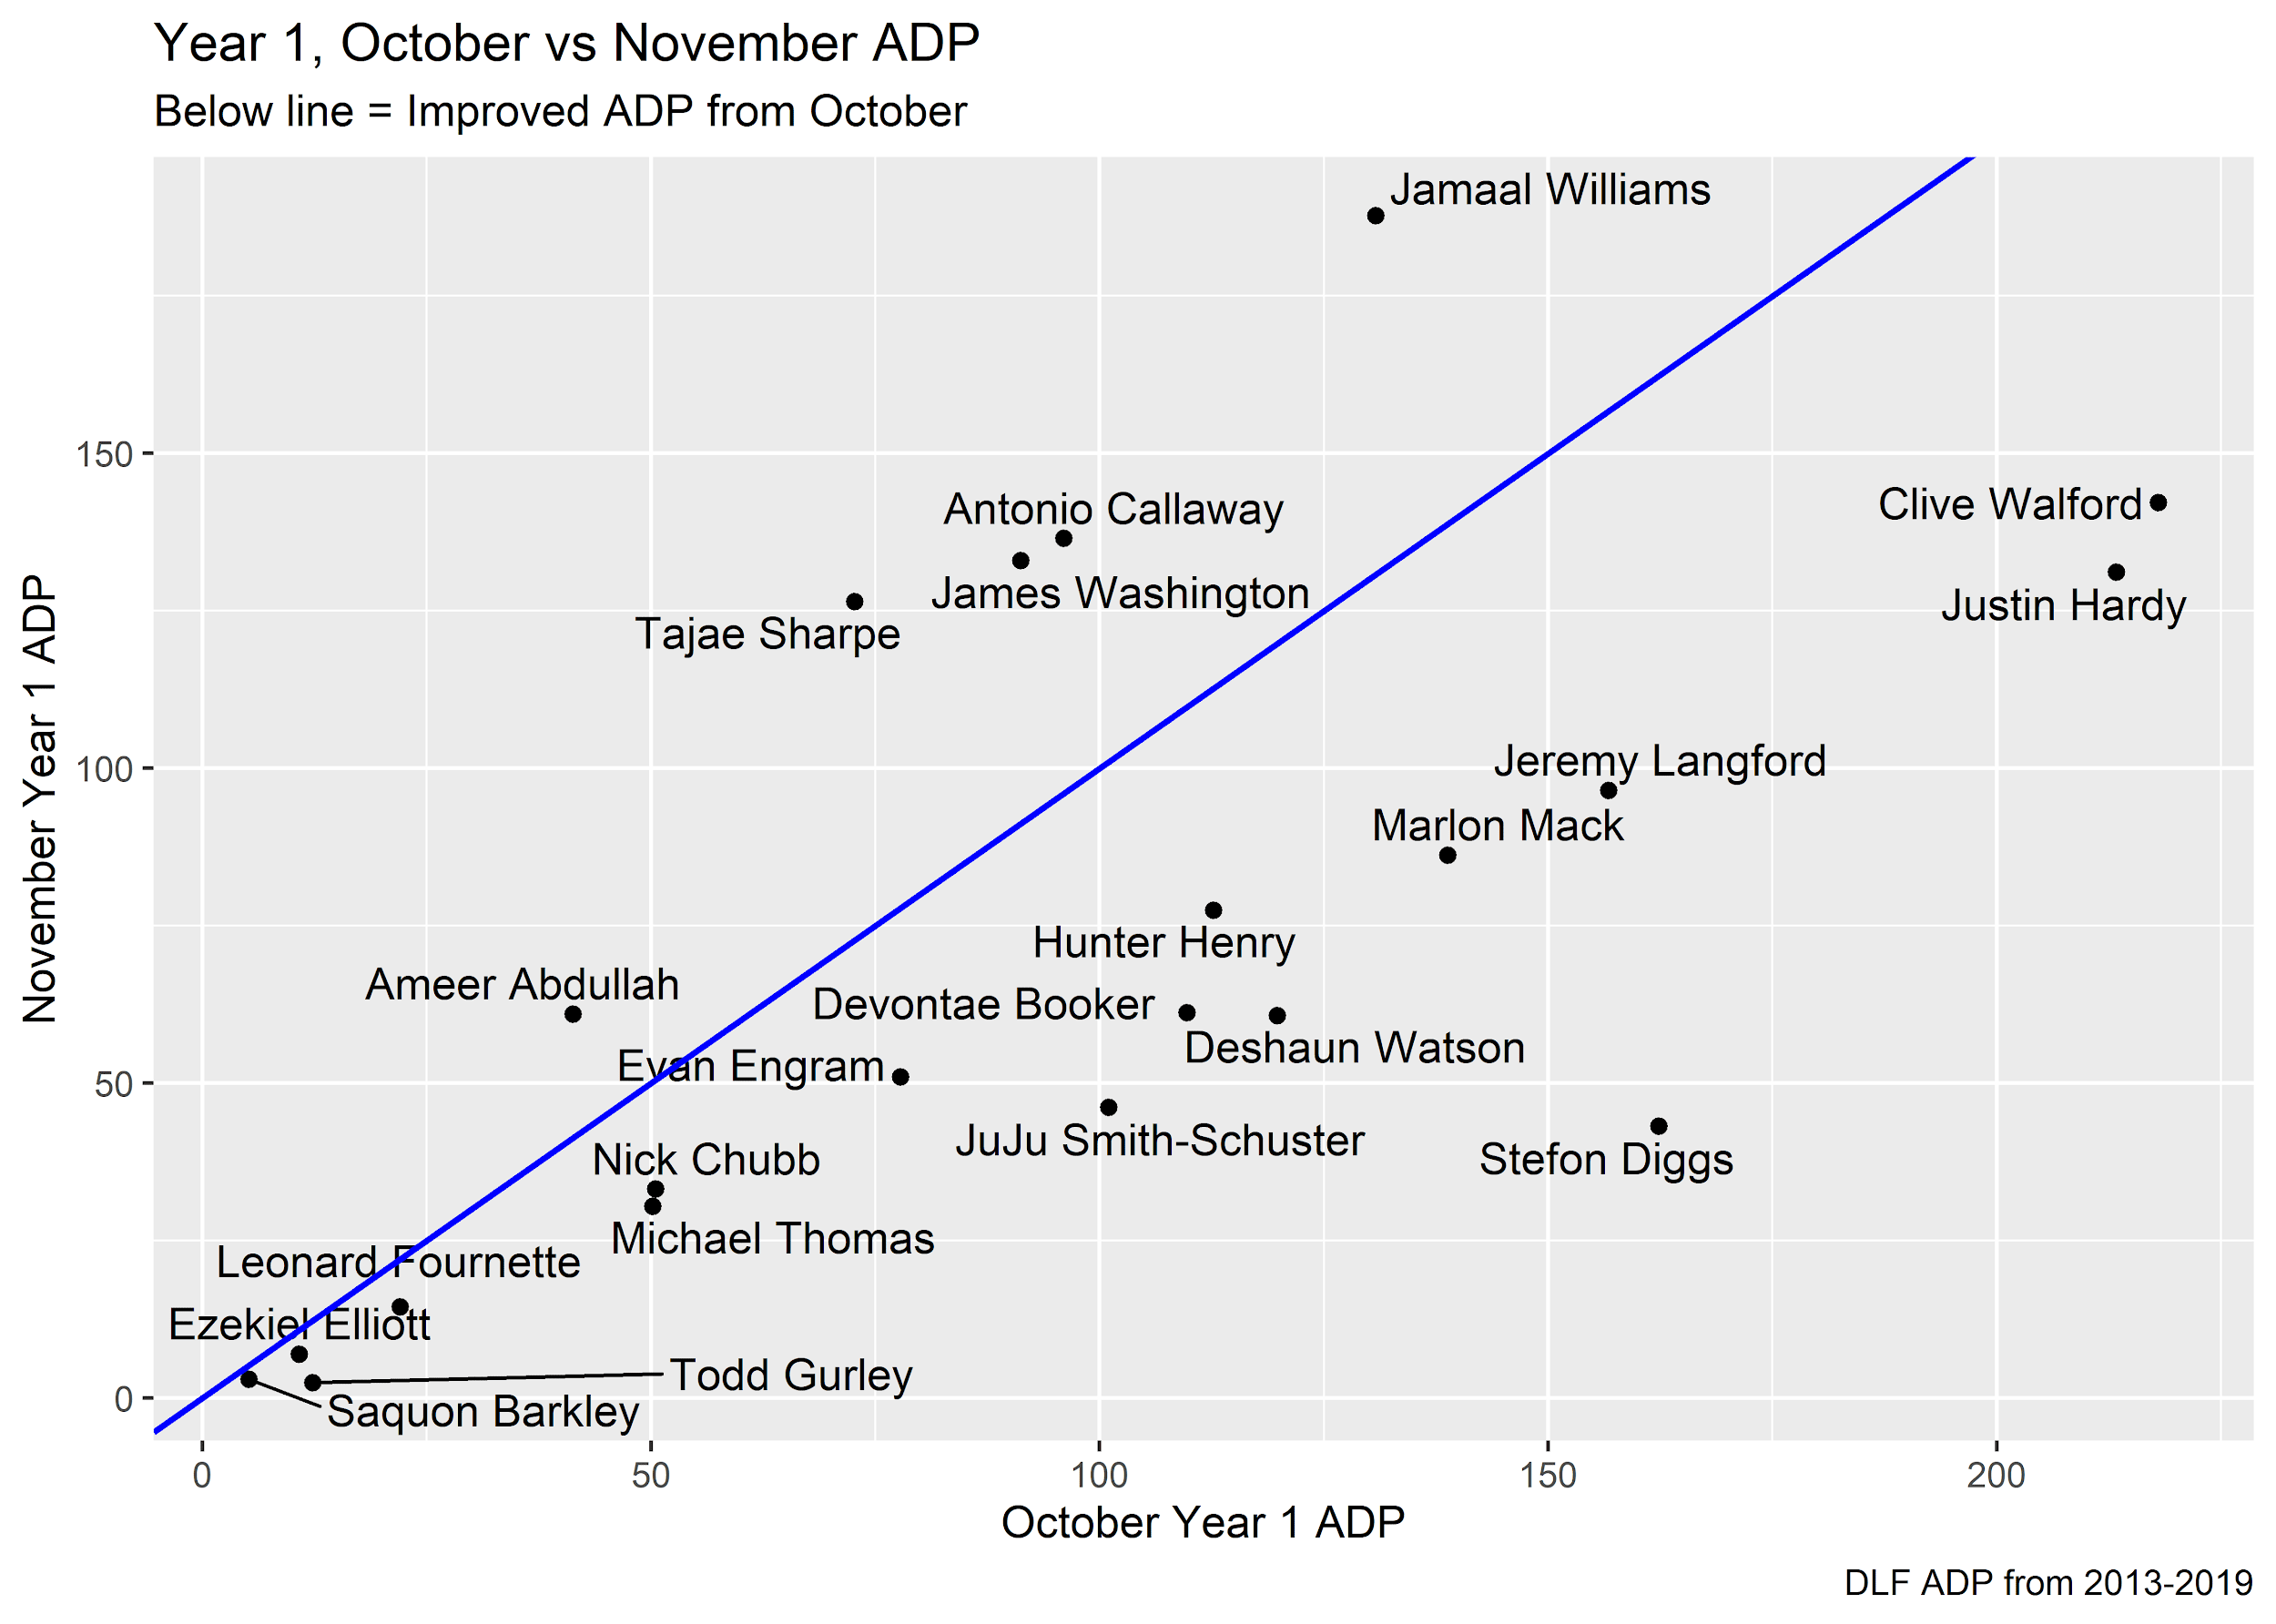
Michael Thomas, JuJu Smith-Schuster, and DeShaun Watson put in surprisingly productive rookie efforts. If you’re reading this article, you probably know that they’ve kept it up since then. However, some risers didn’t quite live up to new expectations: Jeremy Langford and Devontae Booker saw heavier workloads than expected in year one, but those were merely blips on the radar. Again, look at the other side of the line, and we see a couple good examples of owners perhaps getting out while they could. Additionally, you can even see the market correcting itself on two former risers, after it overheated on Antonio Callaway and after it remembered that Tajae Sharpe was a fifth-round pick from UMass. It’ll be interesting to see if James Washington ever materializes in Pittsburgh. Still, the message is similar here: We’re alright at identifying breakouts, and pretty correct when we give up on other players.
Finally, we see that the R-squared values don’t improve all that well after November and into the offseason. Looking at the “risers and fallers” plot for that time period helps explain why:
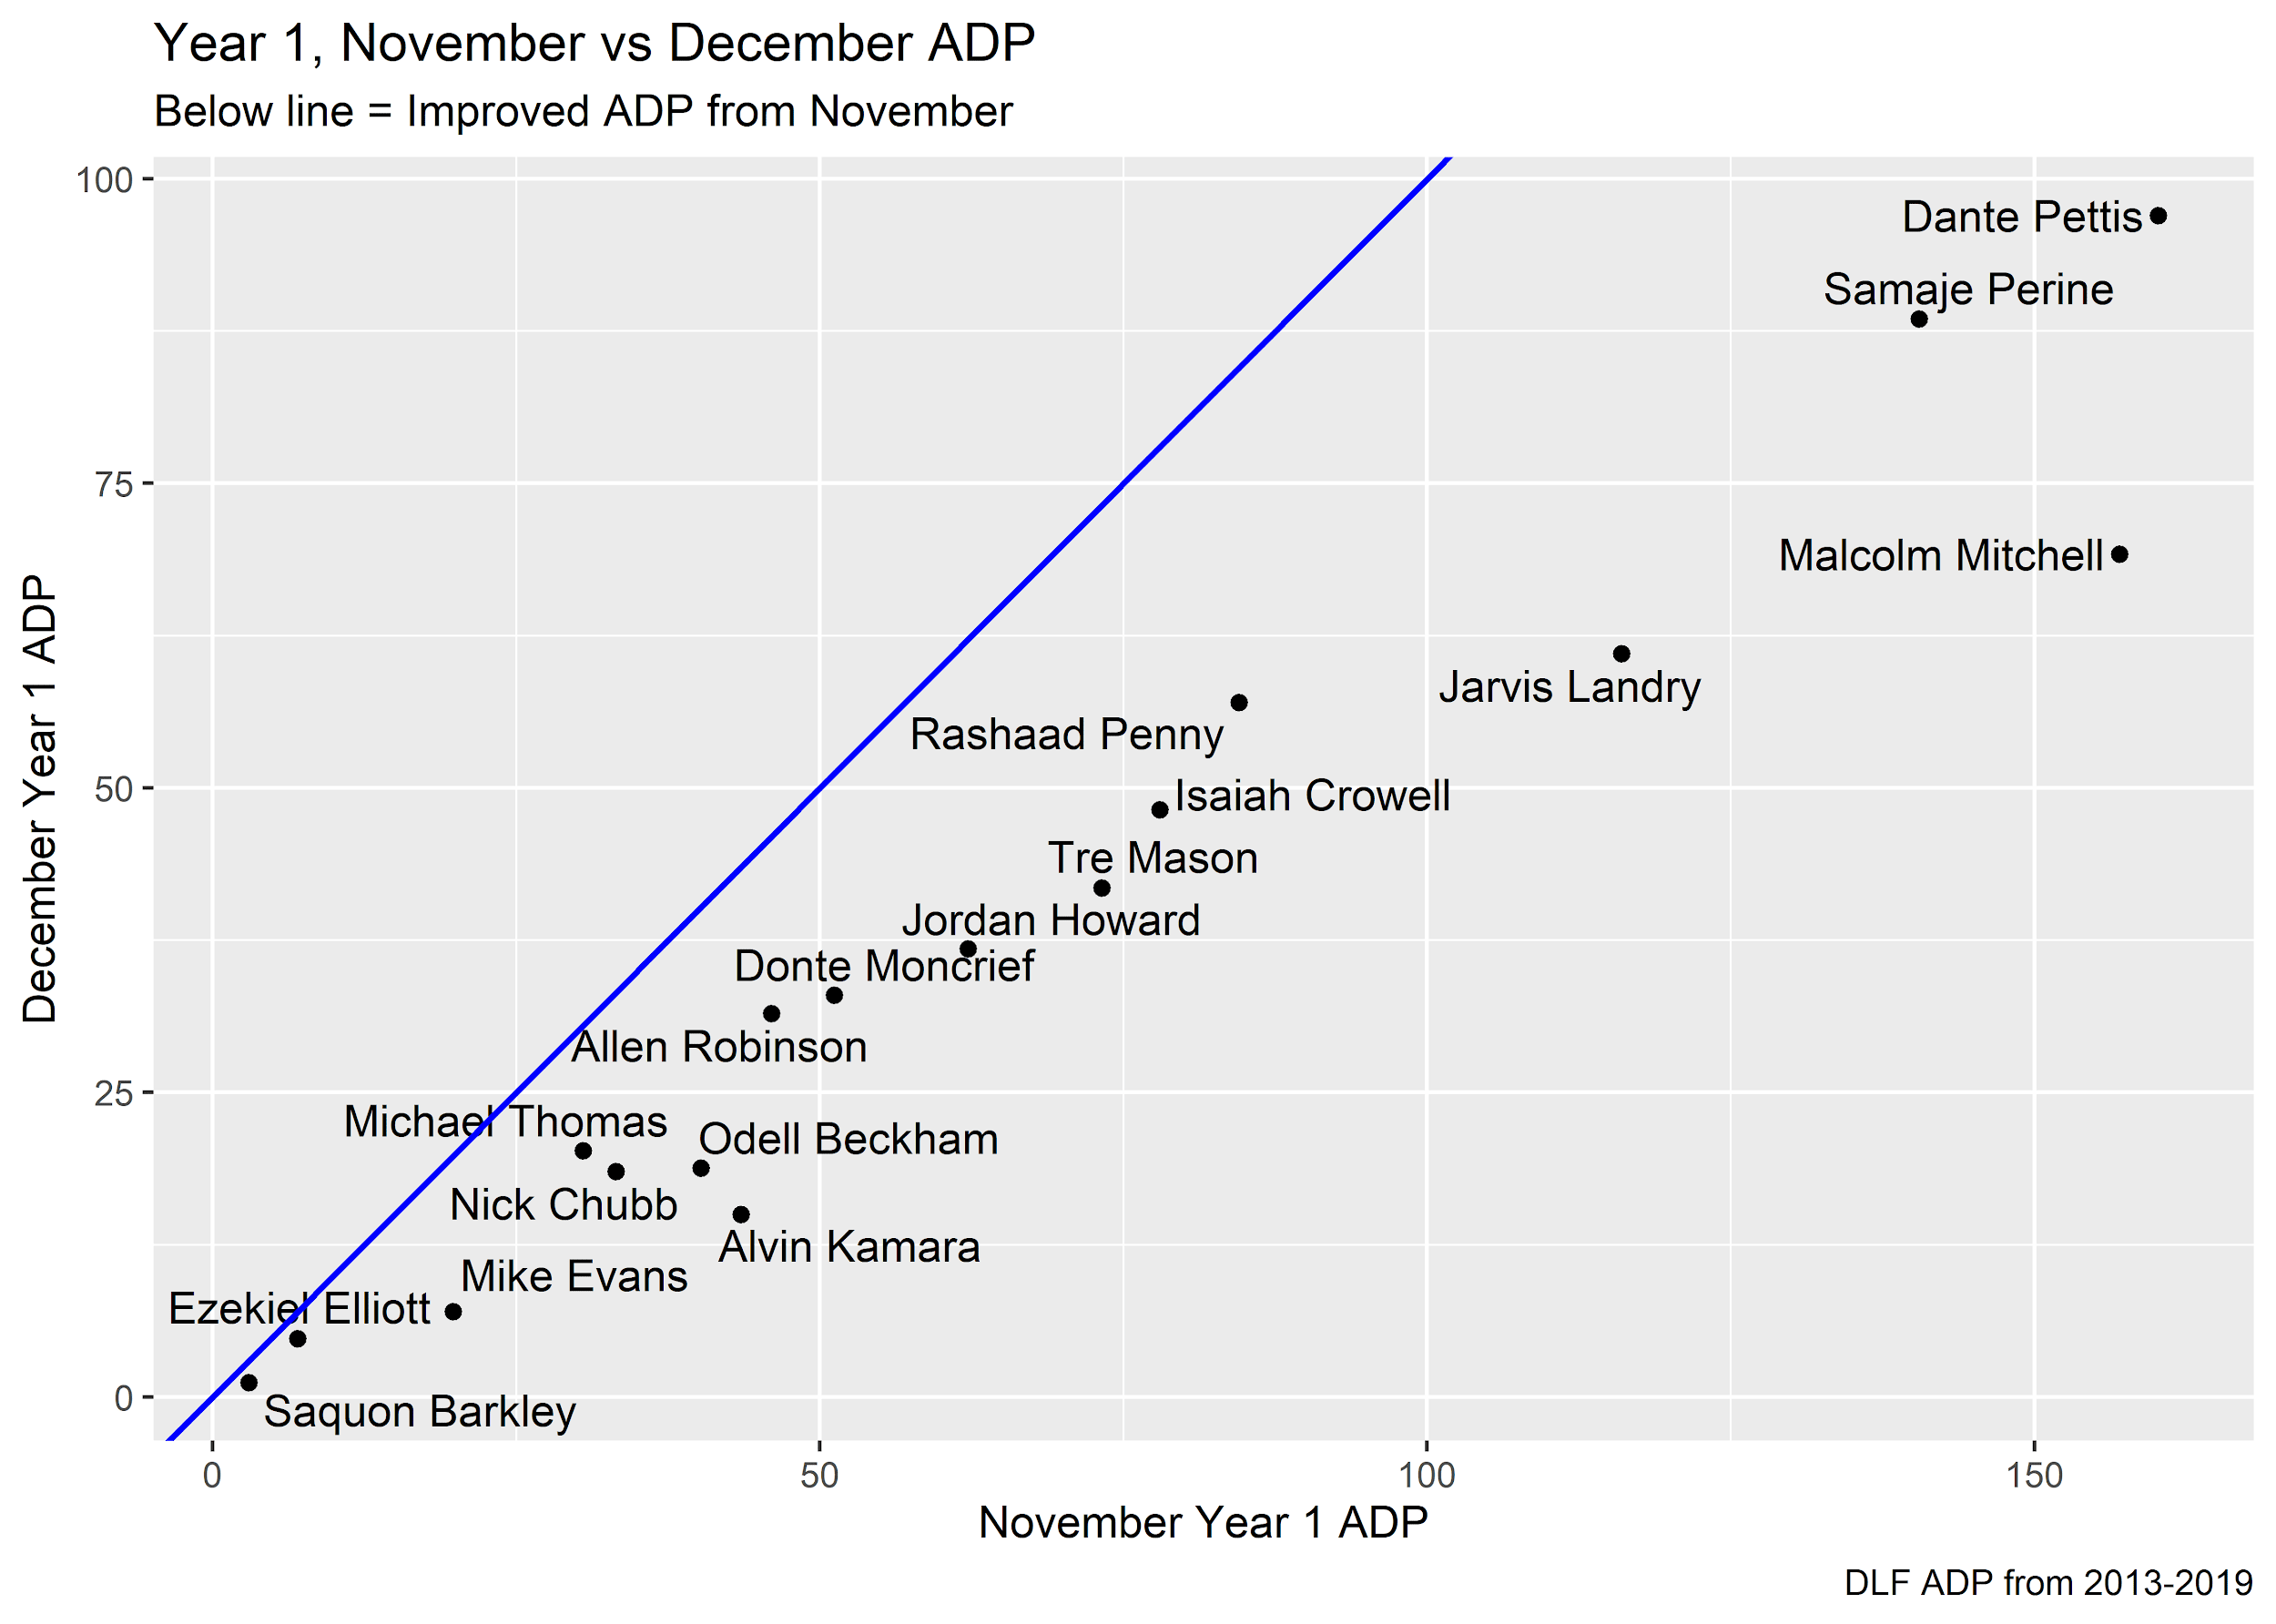
As we approach the end of the season, we prepare for the next season, which logically means that rookies experience some increase in value as they become non-rookies. Here, you’ll see that not a single rookie has taken a significant hit in value — there have only been significant increases.
Again, there’s good and bad on that graph: Alvin Kamara and Odell Beckham shot up into the first two rounds of startup drafts, but Tre Mason and Malcolm Mitchell were bumped up in anticipation of breakouts that never came. There’s plenty of optimism to go around at this time, and as a result, our risers haven’t fared quite as well this time around. Look a step further and you might see a trend: The top guys (players within the November top 50) have maintained value much better than the common folk. It’s an attractive narrative to say that we may be “getting cute” with those outside the top 50, but with just roughly 10 players per group, I’d refrain from making strong conclusions here. I’d feel better about saying, “don’t be optimistic just because the guy’s entering his second year.”
All in all, I do feel more confident in how we, the dynasty community, react to changing situations and signals. We’re fairly good at picking out early risers, and have been very accurate in weeding out the pretenders. There’s always room for improvement, as is the case here, but it looks like we’re usually headed in the right direction.
- Devy Fantasy Football: Top Five Quarterbacks - August 22, 2022
- 2022 Dynasty Fantasy Football Rookie Prospect: Drake London, WR USC - April 16, 2022
- 2021 NFL Draft Prospect: Elijah Moore, WR Ole Miss - April 2, 2021


