Dynasty Fantasy Football ADP Trend Analysis
Ryan McDowell has been dutifully collecting Average Draft Position (ADP) since 2013. Don’t you think it’s about time we see how good we are at drafting in dynasty and track the trends? Me too.
I collected all August ADP from DLF, put it all in a spreadsheet (like a nerd) and did some even nerdier things to try and discover an advantage in the numbers.
Here’s what I found.
ADP Hit Rates
First up, let’s recognize we don’t always draft players inside the top 12 in dynasty because we think that player will finish in the top 12. Youth and future projections play a role in our decisions. Now that we’ve said that, let’s see how well we have actually been doing drafting starters in our dynasty leagues.
I split the ADP in two for each position – top 12 and top 24 for wide receivers and running backs and top five and top 12 for quarterbacks and tight ends. In other words, this is trying to answer the question you might actually ask: “How often do we draft a player as a starter and they ‘hit’ that year?”

*Table made using DLF’s ADP for August drafts since 2014
As you can see, our ‘hit rates’ aren’t great. Even allowing for “we don’t always draft for this year” type of things, we’re probably hoping to do better than a 55% average. If you look at the averages at each level, you can see we do better with running backs and wide receiver starters, which is good since these are the most important in the majority of leagues. You can also see we are better at “predicting” the top 12 than the top 24.
Trends
While only five years of data isn’t enough to draw a lot of concrete conclusions, it’s clear we outkicked our coverage in 2018 for the top 12 players at running back and wide receiver.
As you’d expect, this is partly due to a lot of young players (which we love in dynasty) hitting inside the top 12.
If we compare the top 12 RBs in 2017 (in ADP) to those in 2018, you see a lot of younger players failed to finish inside the top 12 last year, although Christian McCaffrey did finish as the RB13 in 2017.

This has left me wondering if we can expect to be this successful in 2019, considering we average around 53%, but hit at 83% in 2018.
Here are the top 12 running backs and wide receivers right now according to August ADP. As a reminder, we usually have five-to-six misses (players who don’t finish in the top 12) every year:

We were also “unlucky” drafting the top 24 running backs in 2018. We missed ten times (players who did not finish in the top 24 but were drafted there), but remember we average around seven-eight misses each and every season.
One conclusion from this might be those snapping up running backs in the top 24 according to DLF ADP right now might be rewarded by some extra hits this year. However, despite 2018’s lack of success, the average draft round of running backs in the 13-24 range has barely changed at all from 2018 to 2019. Apparently, we have doubled down on our top 24 running backs.

This is part of a pattern over the last two years where we have been selecting running backs in the top 12 and top 24 over wide receivers. If I were to speculate, I believe this is the result of the 2014 wide receiver boom fading and its effect platooning over the last few years.
As such, it may be a good idea to switch course and take some value (since 2014) on top 12 dynasty wide receivers since we are getting them about three to five spots lower in our startup drafts.
As a result, I’d still recommend fading top 24 running backs selected before the top 12 or top 24 wide receivers. We hit on top 24 running backs less often on average and with the added value of wide receivers getting pushed down in ADP over the last two years, they are, historically, steals.
A game to play
So here is a very un-fun game inspired by Gabe Gering’s tweet (Gabe hosts The Open Bar Podcast on youtube.com):
Great project to realistically draft wide receivers:
Of the top 24 from 2018, pick about 13 that you believe will stick. Even if you’re feeling dangerous, don’t pick less than 9 or more than 15 – it’s never happened (since 2000). A thread that thirsts your interaction below 👇 https://t.co/u3W9Imvln7
— gabe #pelobun 🚴♂️ (@FFManBun) August 4, 2019
In preparation for 2019, a good exercise could be to go through the starters in DLF ADP and try to highlight the average number of misses for each category (who you think might or could miss).
To be fair, I think injuries likely account for a decent portion of the misses, so take it easy on yourself and remove two players from the average, but don’t list players you think will miss because of injury or holdouts.

Where Are “Sleepers” Drafted
For the purpose of this article, “sleeper” means a player who is drafted outside of a starting range at the position, but finish inside of it: A wide receiver not drafted in the top 12 who finishes eighth overall, or a running back who finishes 14th overall but wasn’t drafted inside the top 24.

A lot to unpack here, but essentially I’ve listed the number of players who finished inside the two main “starter” position ranks for each position (inside the top five and top 12 for quarterback and tight end – inside the top 12 and top 24 for running back and wide receiver as seen in the column labeled “Finished”) but were drafted outside of that position range in ADP.
So, seven running backs finished inside the top 12 in 2013, but were drafted outside of that ADP rank in August.
On the right, you can see the Coefficient of Variation (how similar the numbers are) over the last five years. The closer to 0% the number is, the more similar the numbers are.
Overall, I think the “sleepers” at each starter position range are remarkably stable year-over-year. We can say fairly confidently that we should expect between five and seven players to finish inside the top 12 among running backs who are drafted outside the top 12.
Again, we see how “lucky’ we were in 2018 with only three players sneaking into the top 12 at both wide receiver and running back last year.
So, my question is: where were these “sleepers” drafted?

Here I’ve asked the table to find how many players who finished inside the starter range were drafted inside the next range – top 12 running backs who were drafted inside the top 24, and top five quarterbacks who were drafted inside the top 12, and so on.
Essentially, we see about half the players who finish inside the highest range of starters come from the second range. Based on the average number of “sleepers” at each position, this gives us some guidelines of expectation for the number of sleepers and where they will be drafted.
- Two of the three top-five quarterbacks not drafted top five are drafted inside the top 12, leaving only one being drafted outside the top 12.
- Three of the six top 12 running backs not drafted inside the top 12 are drafted inside the top 24 and three are drafted outside the top 24.
- Three of the six top 12 wide receivers not drafted inside the top 12 are drafted inside the top 24, and three are drafted outside the top 24.
- Only one of the three top-five tight ends who finished inside the top five are drafted inside the top 12, this means two are drafted outside the top 12.
What’s striking here is that in 2018 none of the three “sleepers” who finished inside the top 12 at running back were drafted inside the top 24.
Looking through the list (Tarik Cohen, James Conner, and James White) it’s easy to see why these players were not drafted inside the top 24.
Looking at those who were drafted in the top 24 running backs, we see several struck by injuries (Devonta Freeman, Derrius Guice, Sony Michel, Kerryon Johnson, Jerick McKinnon), two slow starts (Nick Chubb, Derrick Henry) and one Chris Carson-ing (Rashaad Penny) that limited the pool of potential runners to break into the top 12. In other words, I think those drafted inside the top 24 should have more luck in 2019.
Also, don’t take your eye off the fact that three “sleepers” inside the top 12 come from “outside” the top 24.
Value over Time for Each Position
That’s some easy redraft stuff, you don’t come to DLF just to compare ADP to end of year rank over time. Let’s get interesting and see how the value of different positions changes over time – that has dynasty application.
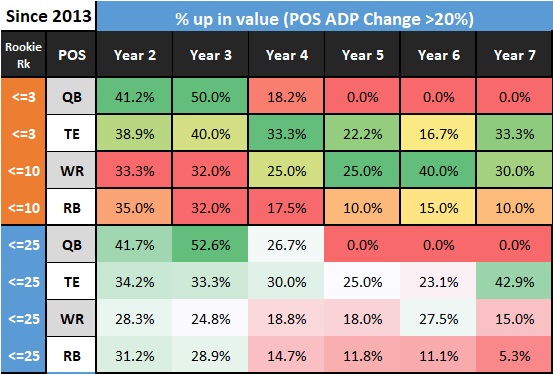
What I’ve done here is figure out the position rank of every player drafted in DLF ADP since 2013, and plotted how that value has changed over the seasons at each position.
I measured a value change as 20% of their initial position rank. If a rookie wide receiver was drafted as the 12th player at their position in their rookie year, they would have to rise more than two spots (WR10) before they are counted as having gained value.
On the other hand, a running back drafted as the 24th player at the position would have to climb 4.8 spots or more (RB19) before they would be counted as having gained value. This way, players who rise or fall outside the top 20 aren’t excessively discounted or valued.
I also divided it up between “high value” players in rookie drafts (those drafted at the top of the position) and all players drafted that year.
Conclusions
Quarterbacks
This position is the best bet to gain value in the first three years of their career in dynasty leagues. However, by year four, only 18% of them are still being drafted higher than in their rookie year – this gives us a buy and sell window for the position.
Tight Ends
This position grows in value through the first three years at the second-highest rate. In other words, they are good bets until year four. We also know most tight end breakouts happen after year three, although there is the occasionally year one (Evan Engram) and year two (George Kittle) breakout seasons. This creates a potential buy window for players about to enter their third or fourth year (Eric Ebron and Austin Hooper in 2018)
Wide Receivers
These players grow in value at the lowest rate. However, since most wide receiver breakouts happen in year two, this is good for us if we are buying. Also note that by year five, more wide receivers have gained value compared to their rookie ADP than any other position. They constitute slow burn value returns with big upside.
The likes of Kenny Stills, Robert Woods and Marquise Goodwin are creating a boost to wide receivers in year six as they find different teams and potential (or actual production) with their change of scenery. This quickly falls back as some (Woods) hit and others (Goodwin) falter. The off-season before year five might be a good time to re-invest in some wide receivers who have not yet hit hoping to profit from this value jump.
Running Backs
The brightest stars burn out quicker. As a position that breaks out earlier and more often in the first few years (but then quickly fades because of injury and subsequent draft choices), it shouldn’t be a surprise to see them outpace wide receivers in value through year two. However, by year three, this growth has mostly equalized and wide receivers have gained value at about the same amount. Selling running backs before their fourth year seems like a solid rule of thumb.
For more information or to let me know who you would pick to fail to meet their ADP in the top range or starters in 2019, hit me up on Twitter @pahowdy or in the comments below. Also, check out the other great DLF articles on sleepers, busts and players to be high on here at DLF to help find their potential replacements.
- Peter Howard: Dynasty Fantasy Football Superflex Rankings Explained - March 6, 2024
- Dynasty Target and Regression Trends: Week 15 - December 23, 2023
- Dynasty Target and Regression Trends: Week 14 - December 16, 2023


