Tier Drops from Heaven: A Different Way of Looking at Scoring
July is a time of reflection in the football world. Most of the league is on holiday and not very much happens. For analysts, it’s a time to indulge in interesting projects that often aren’t at the top of the list at other times of the year. This is one of those.
It is a look at how the various tiers (based on a standard, 12-team league) comprise scoring for skill positions. It only includes running back, wide receiver, tight end and fullback for now. Look out for quarterbacks in the future as they are a whole other beast.
Before we get started, this is assuming half point per reception for all players with all data coming from Pro Football Reference. Fumbles, passing scoring and returns have all been excluded. As have tackles and all defensive plays.
Running back
First up is the most badly-scored position in fantasy football. Whereas the NFL values RBs less and less, our hobby still largely revolves around them.
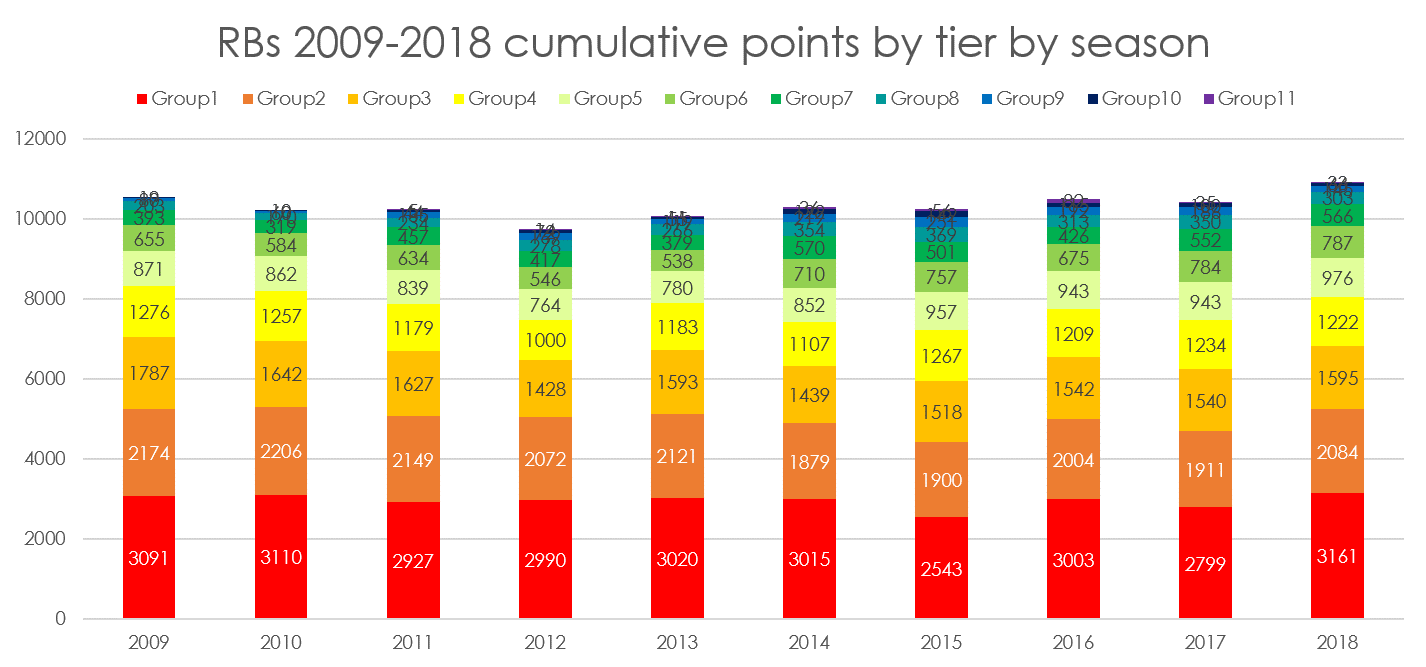
The first chart shows how the top ten tiers have scored over the past decade. This chart shows how the tiers form overall scoring as well as seasonal fluctuations.
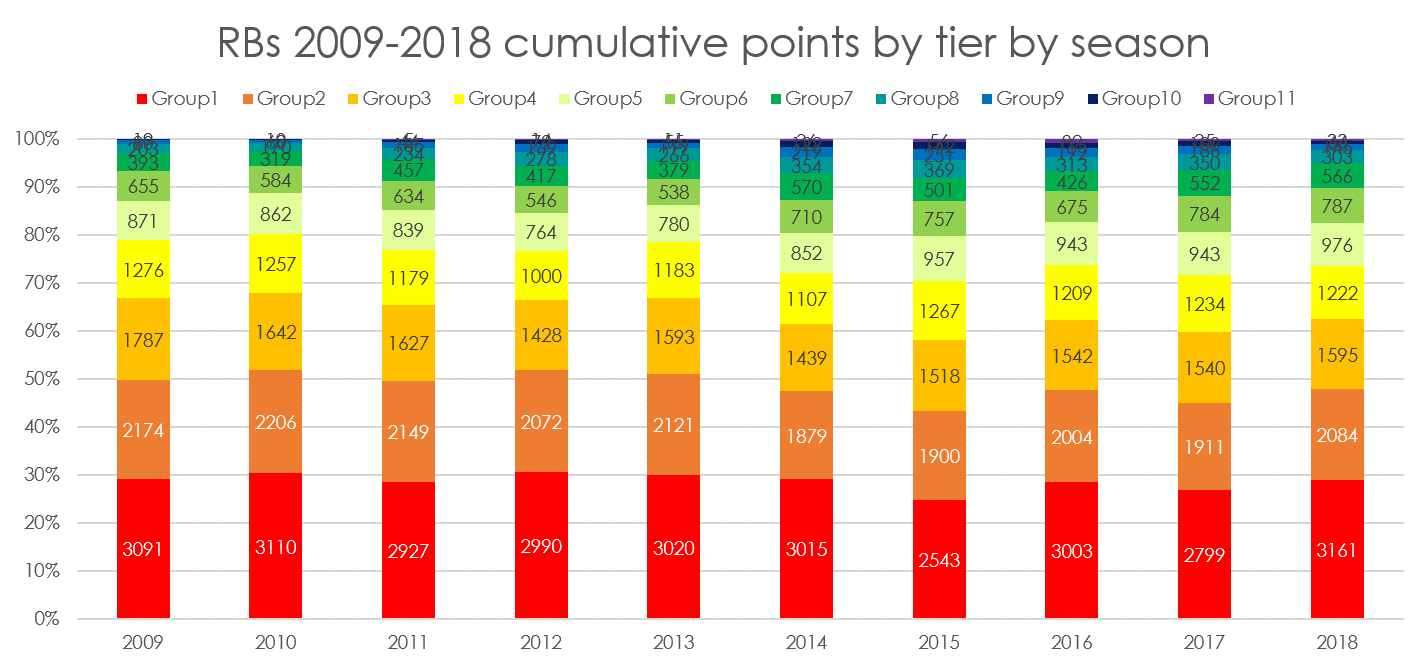
The second chart is the same data but on a 100% stacked chart. So, you can see the proportion a little better.
The takeaways are fairly obvious.
Firstly, scoring by tier is reliable year by year. The lower down tiers (i.e. higher numbered ones) are the least variable with the top tiers more so. Tier one has varied by up to 500 points a season but even so, that’s less than 20% fluctuation and for most of the time it’s been much less than that.
Secondly, the top three tiers comprise more than 60% of total scoring. In any given year, the top 36 RBs score well over half the total RB points.
There are also no noteworthy long-term trends. We’re not seeing the top 12 backs score more and more or fewer and fewer each season for example. The situation is staying relatively stable.
Wide receiver
This position is the favorite of so many dynasty owners because of its long-term stability and value.
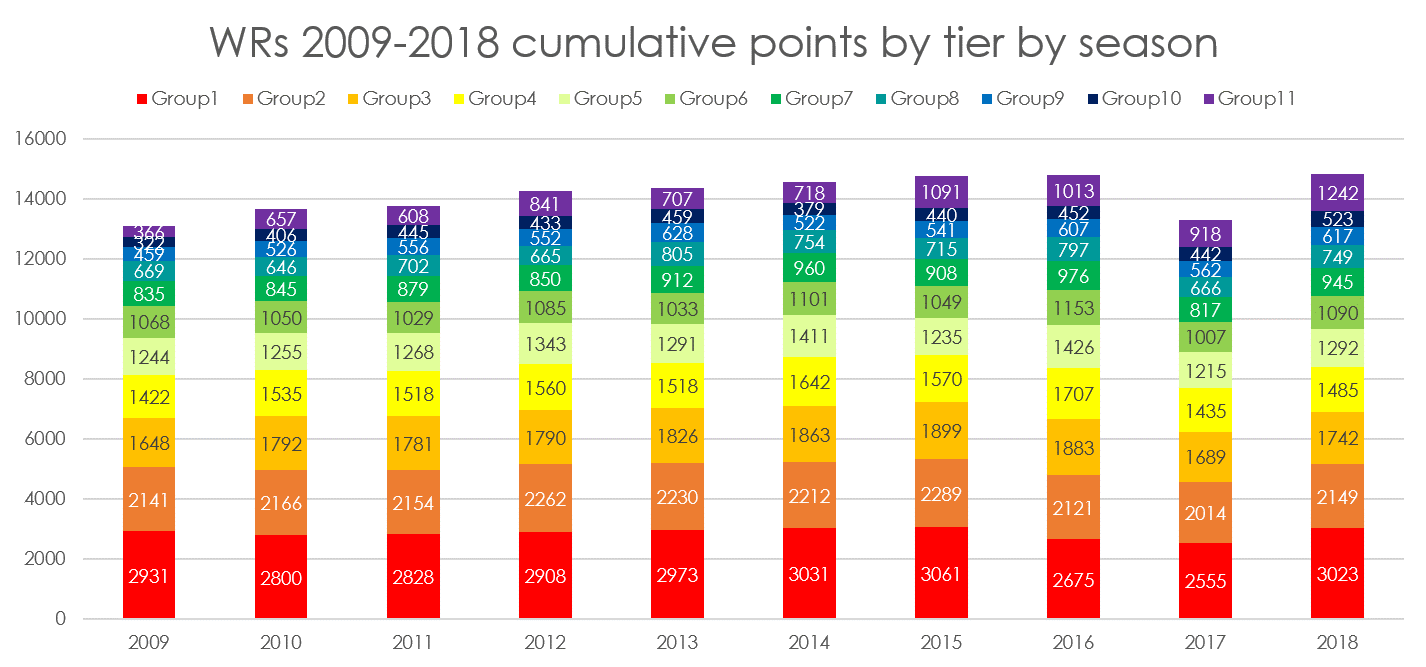
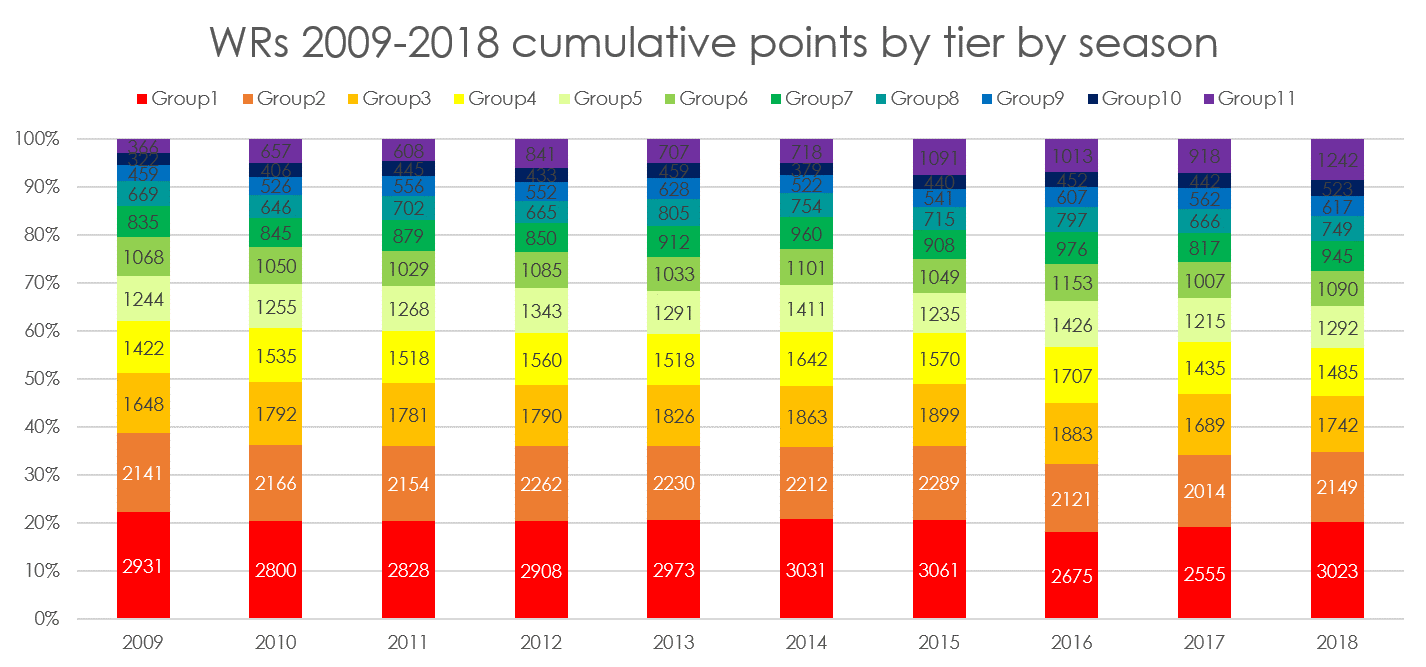
This data is clearly very different from the running back position. It’s easy to see that scoring is much more distributed across more tiers and players. There are simply a lot more receivers recording stats than backs and it shows up.
We can also see a clear trend. Aside from 2017, every season here has seen the total points scored by the top 132 WRs increase. The league is passing the ball more and becoming more efficient.
Top tier production has remained steady. It dropped sharply in 2016 and rose sharply in 2018 but aside from those, it’s been reliable.
Tight end
Is tight end really a wasteland as we hear so often?
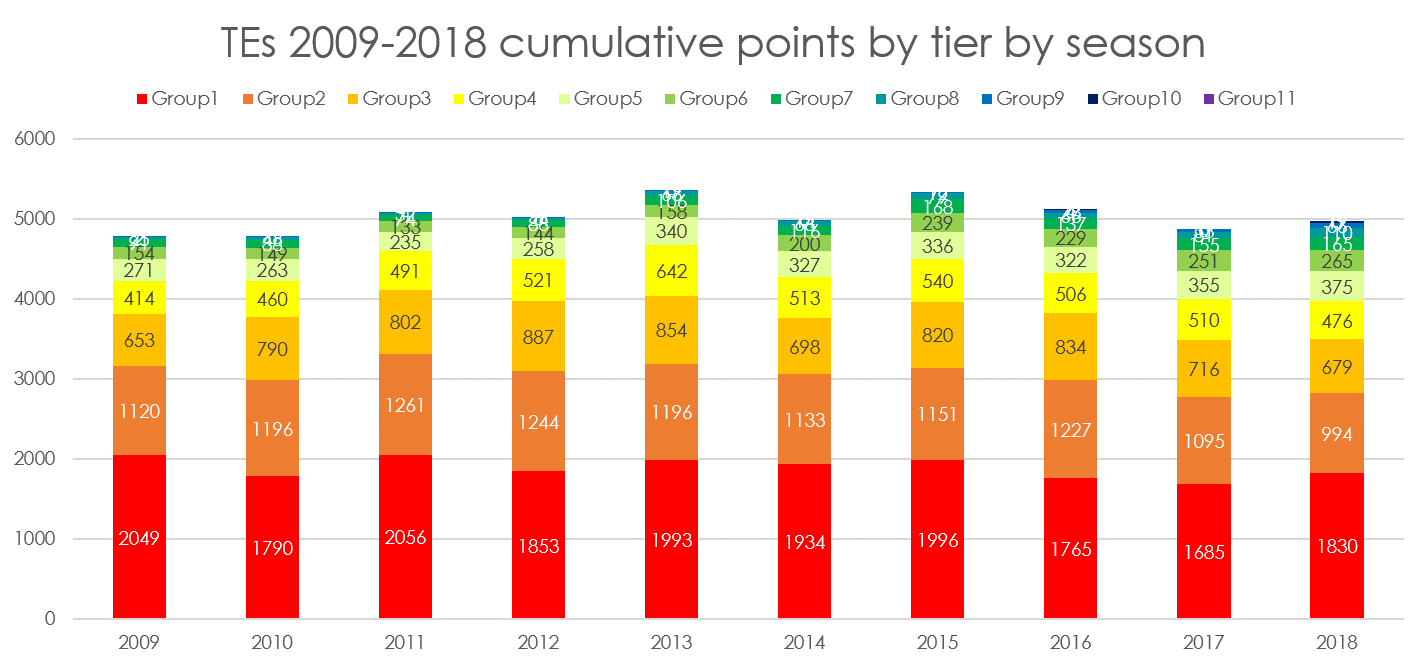

Not really. Total TE scoring has remained relatively steady for the past ten years. It dropped in both 2016 and 2017 but did recover a little in 2018. Top-tier TE scoring also dropped in 2016 and 2017 so you can see where the sentiment comes from.
In reality, because of the lower number of relevant players, variance is just higher so we more often experience disappointment – and that sticks in our mind.
You can see that top tier scoring has shifted by up to 300 total points a season – still less than 20%.
Fullback
Where else can you get data digging into the last decade of fantasy fullback production aside from at DLF?
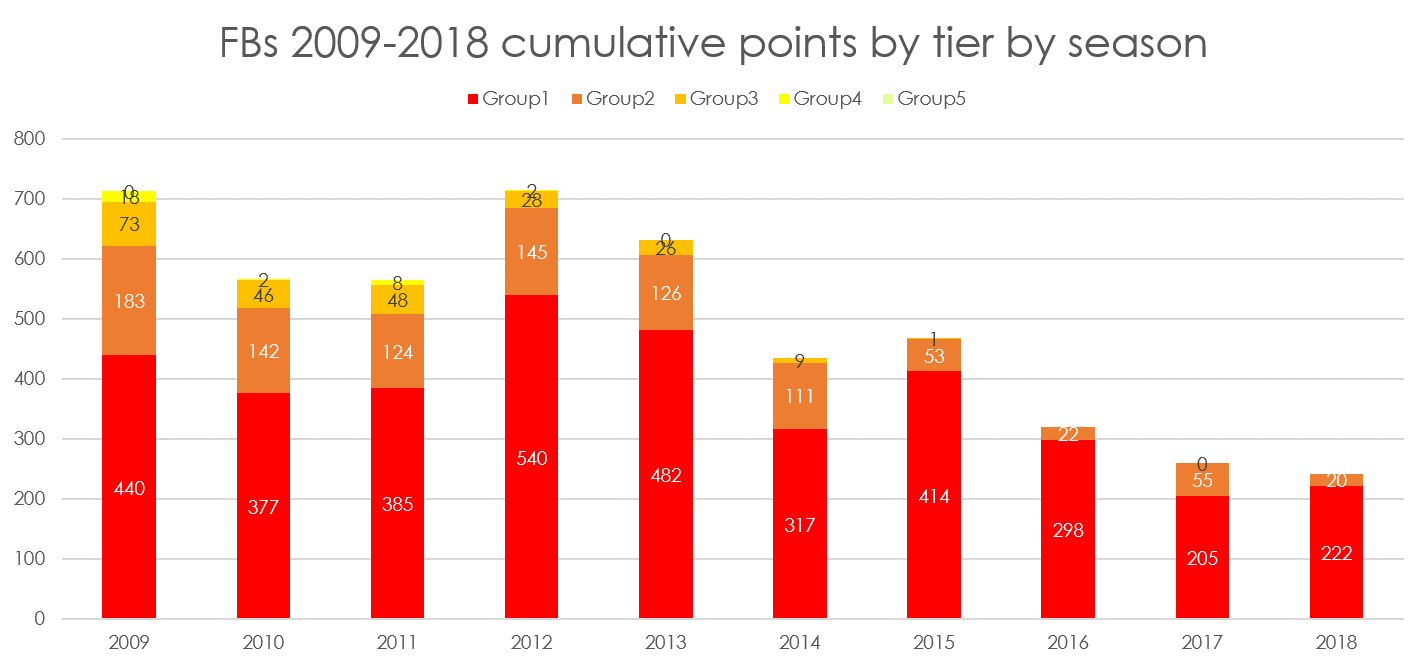
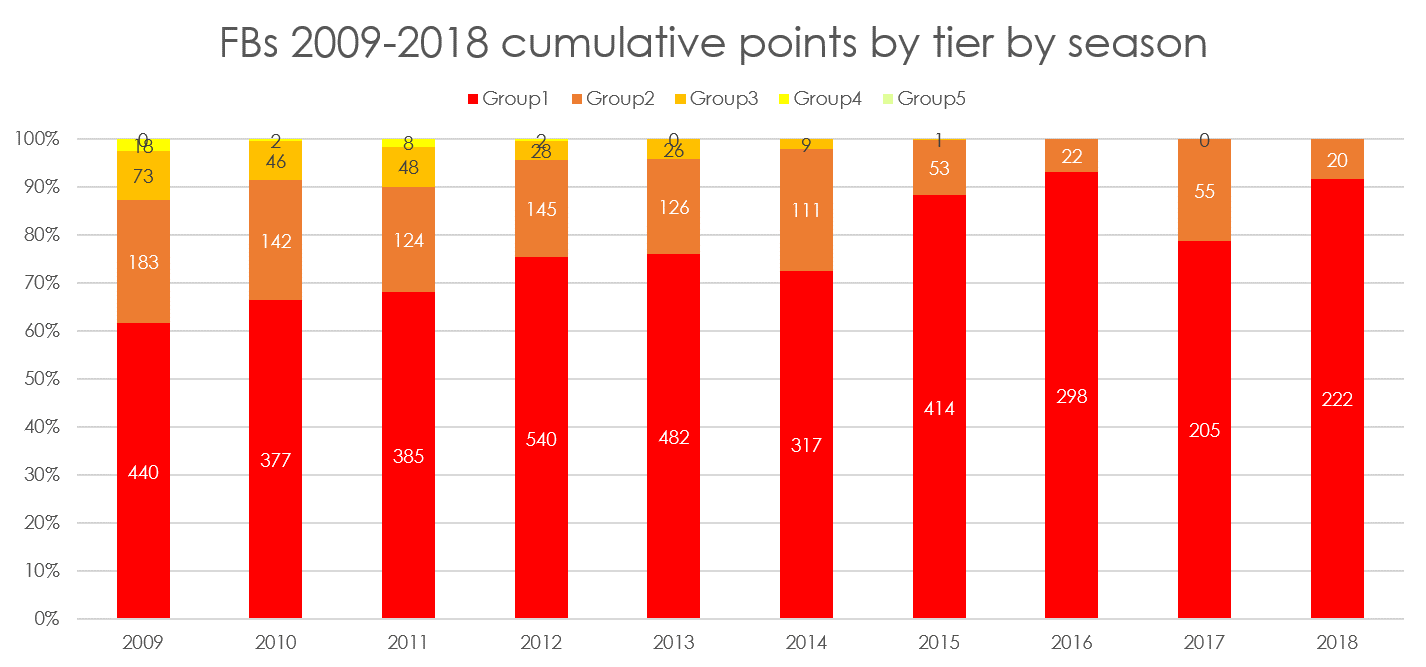
The obvious point here is that there just aren’t many fullbacks who record points. And the position has scored fewer points year on year every season since 2015 with just one annual rise since 2012. Although coaches like Sean McVay, Bill Belichick and Kyle Shanahan all like using a fullback, they are sadly disappearing from use.
Year on year positional curves
We can see macro trends from the charts above but to really see how steady positional scoring is, it’s worth looking at scoring by rank year on year. Here’s that data for all four positions:
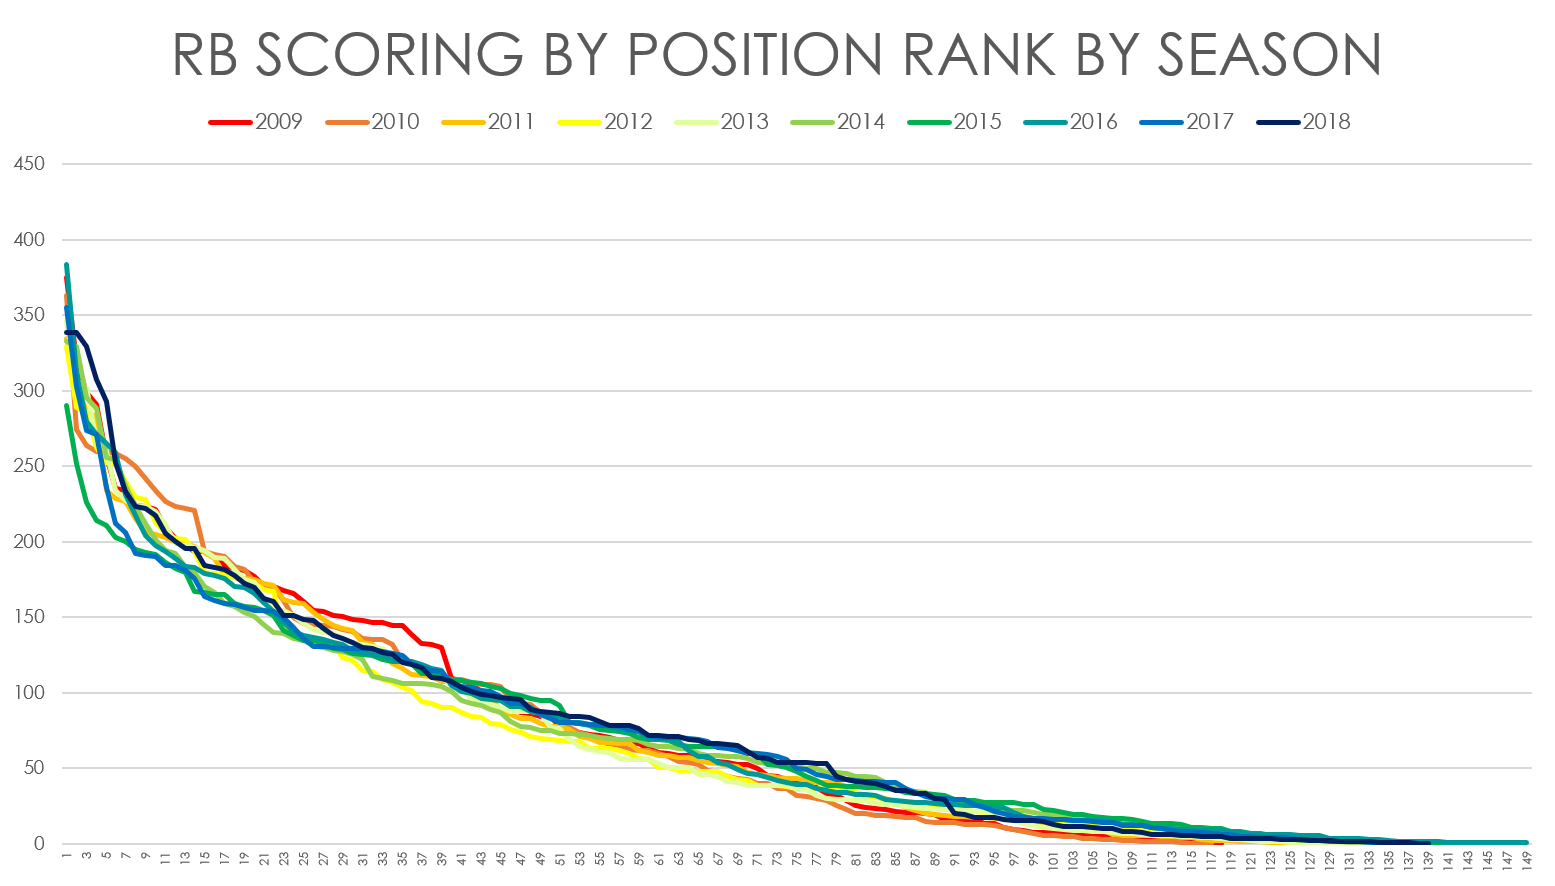
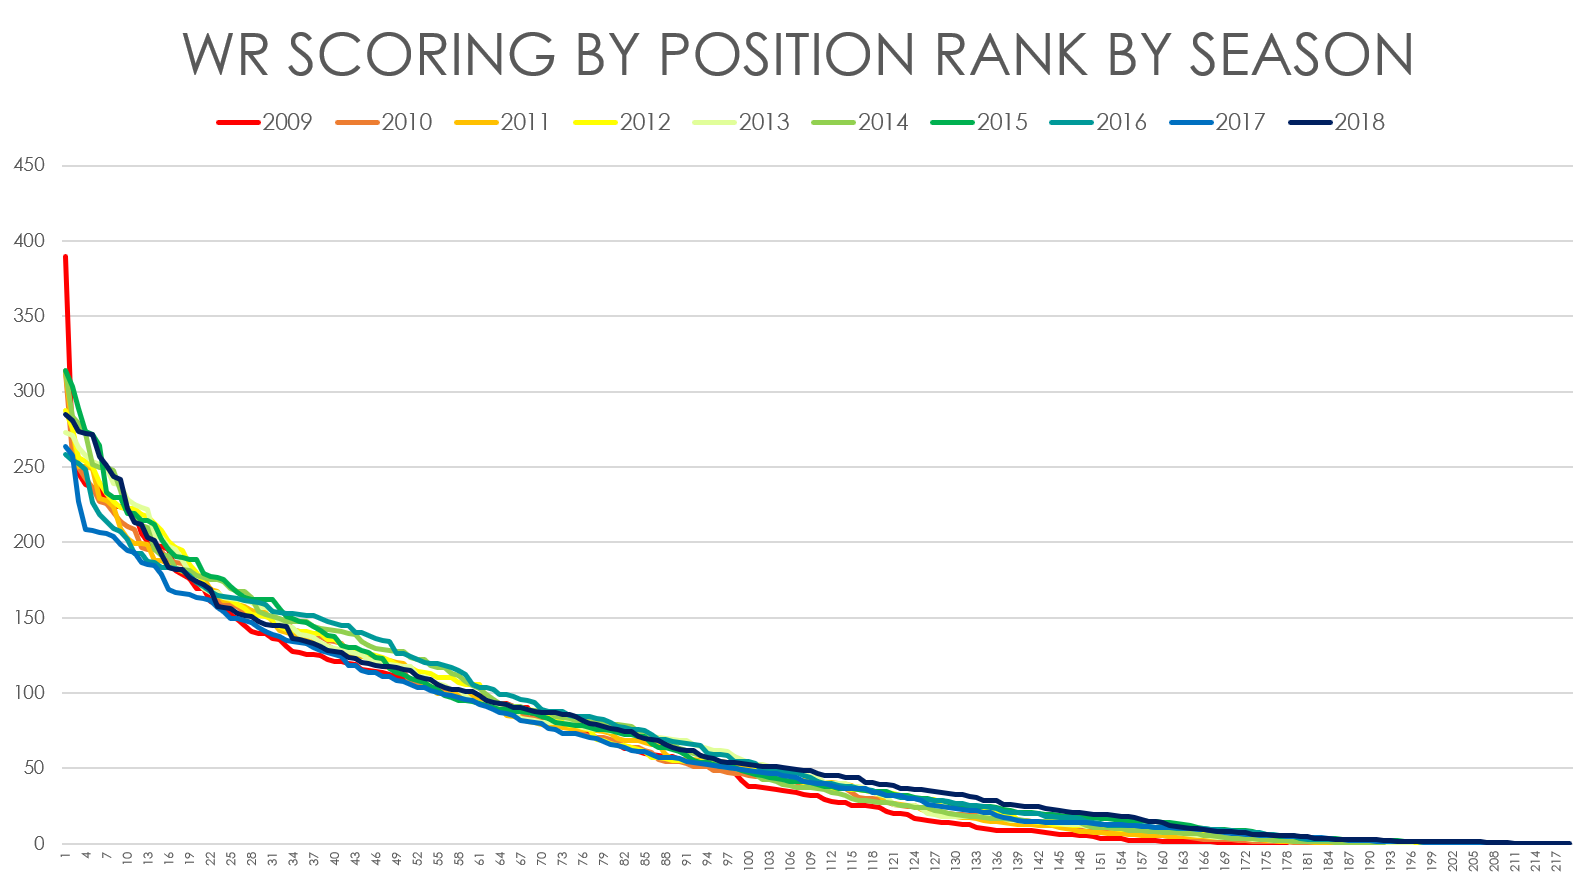
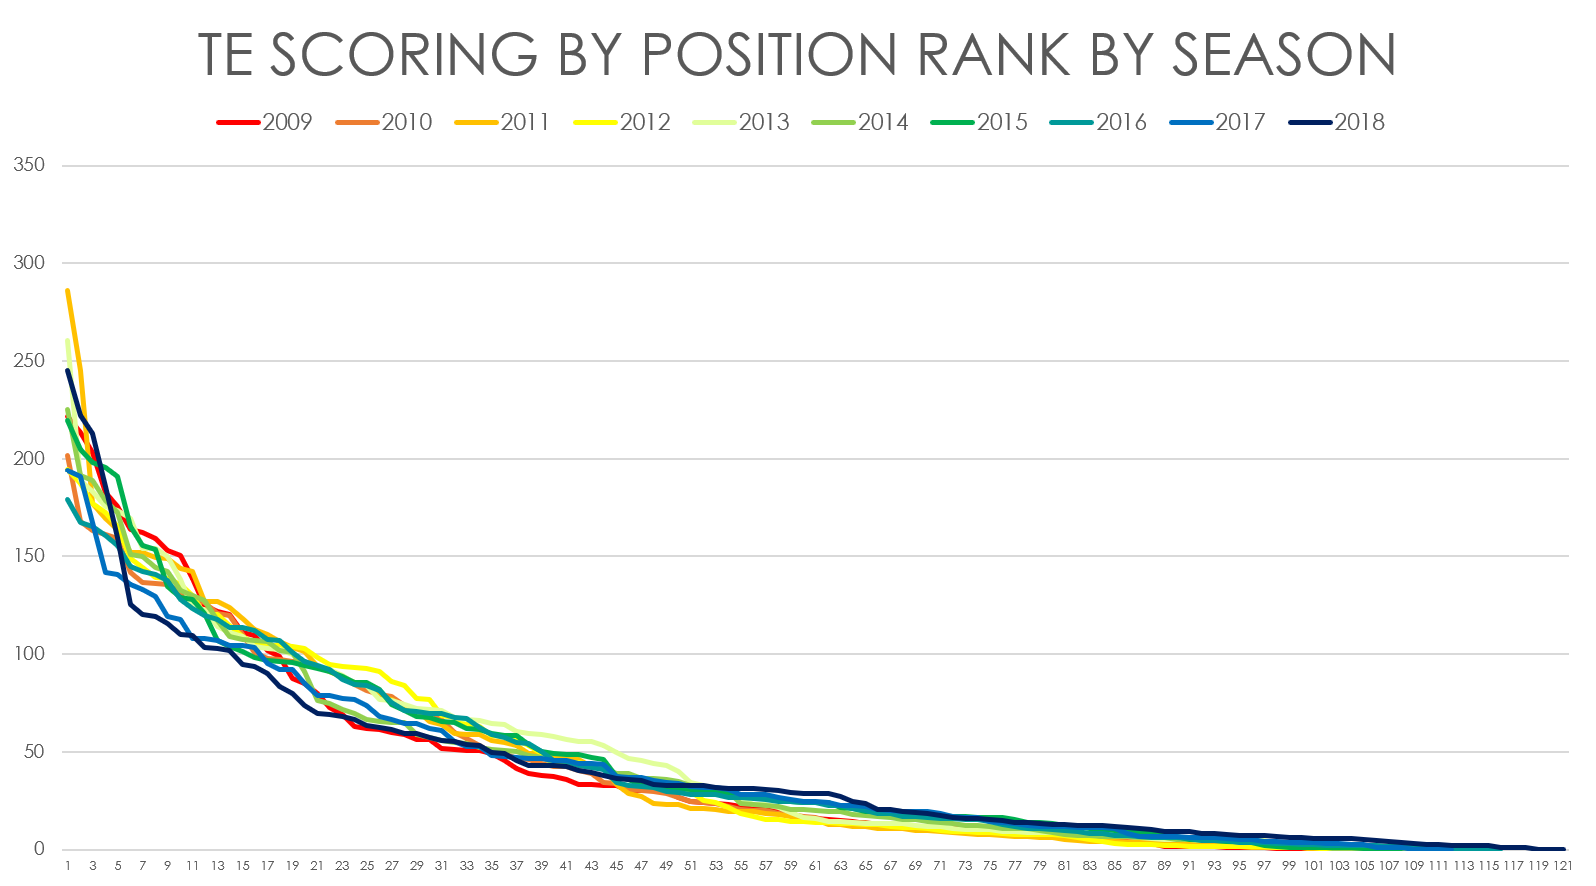
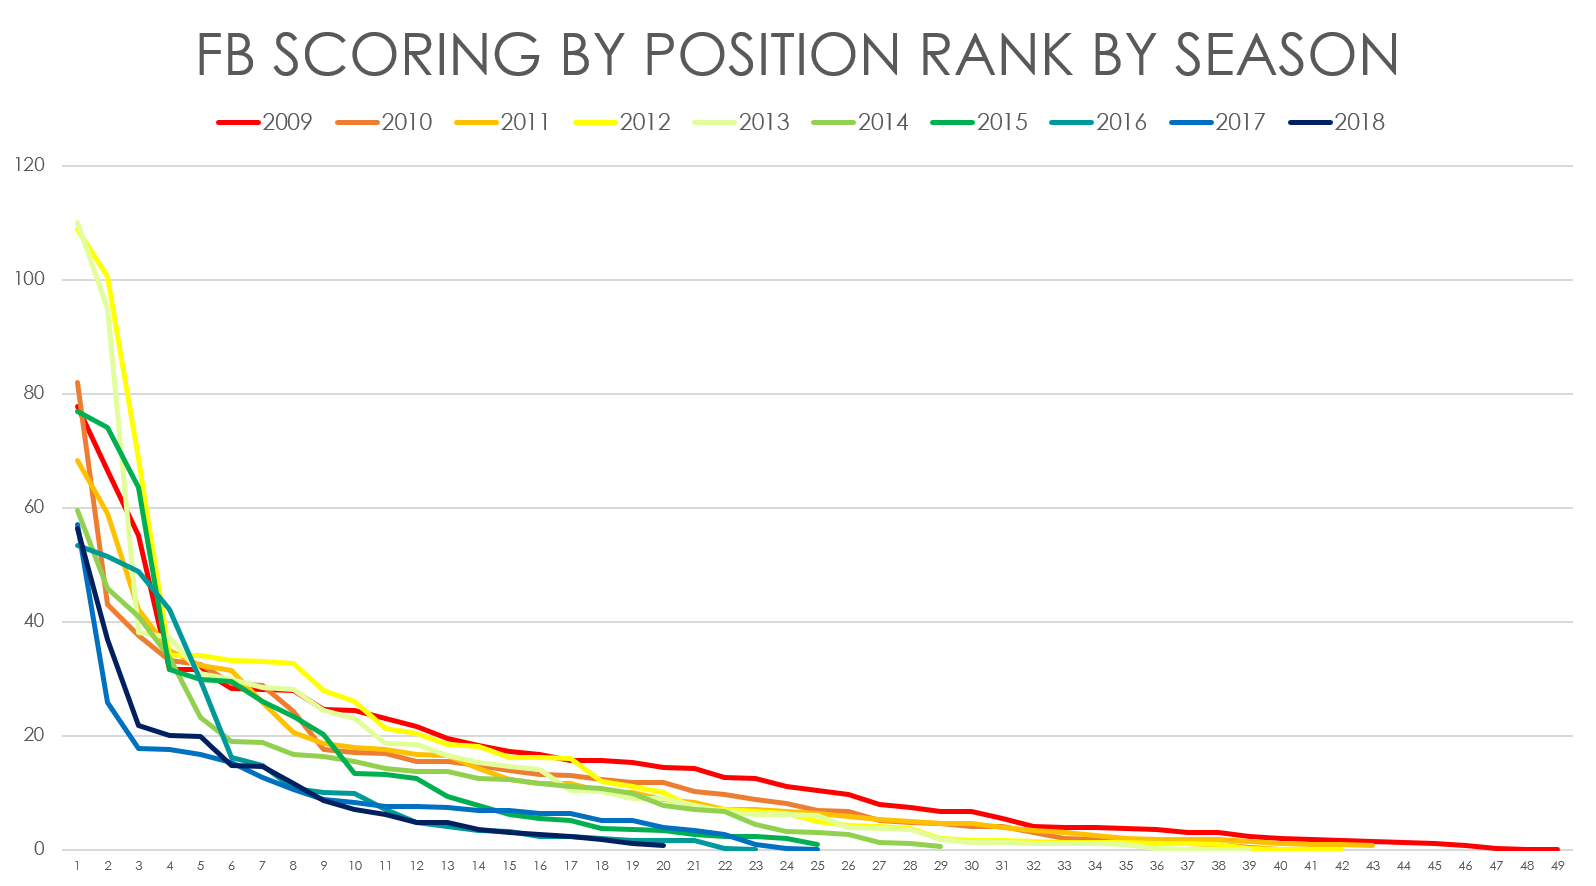
It’s clear to see that for RBs and WRs, stats remain relatively stable year on year. For TE and FB there is more variance simply because of the lower number of players and targets involved.
Positional comparisons
The above is all very interesting. But how do the positions stack up against each other? Here are the average points scored by each tier over the decade sample for each position:
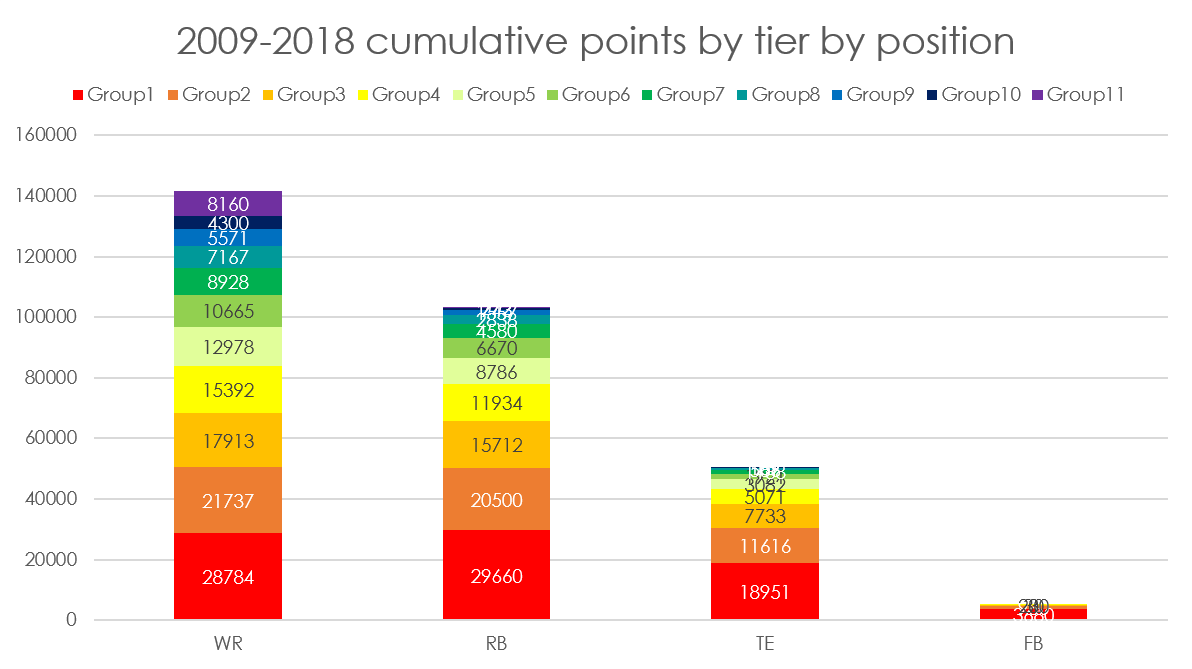
As expected, we see that WRs score more than RBs. They score much more than TEs and FBs barely register.
However top-tier RBs score more than top-tier WRs. And the same holds true when we include the top two tiers. Top 24 RBs outscore top 24 WRs. Interesting, eh?
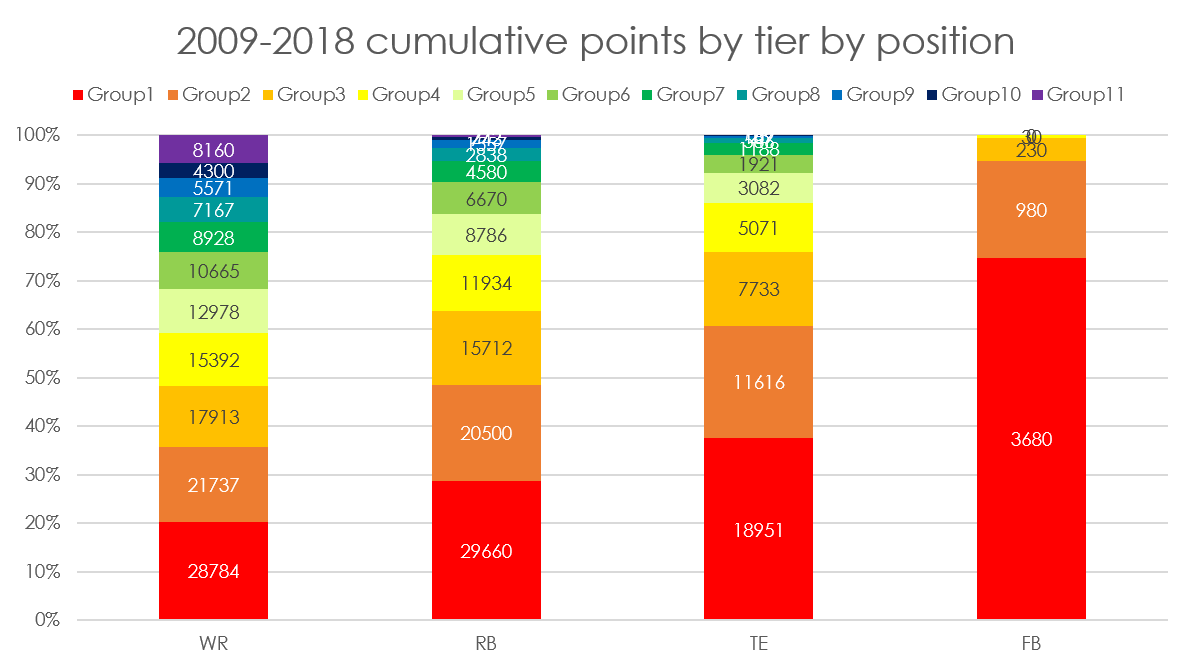
On a stacked chart, it’s even easier to see. Top-24 RBs score slightly under half of all RB points. Top-24 receivers score just about 35% of all WR points. Meanwhile, top-24 TEs score 60% of all TE points and top-24 FBs score over 90% of all FB points.
This is part of the reason RBs and TEs are so much more valuable than WRs even though they might score the same points – replaceability is wildly different.
There is a long tail of receivers. There just is not that one for running backs or tight ends.
So, where does 2018 fit in?
This is all very mathsy, isn’t it? Not very actionable?
Here’s some information you can use right now. Here are the top 36 at each position with 2018 indexed against the average. So, you can see which players last year did better than expected and which did worse.
First, running backs.
Although the top back last year (Todd Gurley in this scoring system) was slightly under what would be expected numbers, the next four were all relatively high over ten percent higher than expected in fact. This suggests last year was a top-heavy season and we might see a little regression in 2019. Outside the top five, everyone else was relatively flat so the curve should hold true.
Running backs

Wide receivers

There was solid scoring all through the top nine last year. We are seeing a continual increase in WR scoring so that’s part of it but look at the direct comparison of each rank from 2017 to 2018 – those are significant shifts. Expect slightly lower production in most of the top ten in 2019.
Tight ends
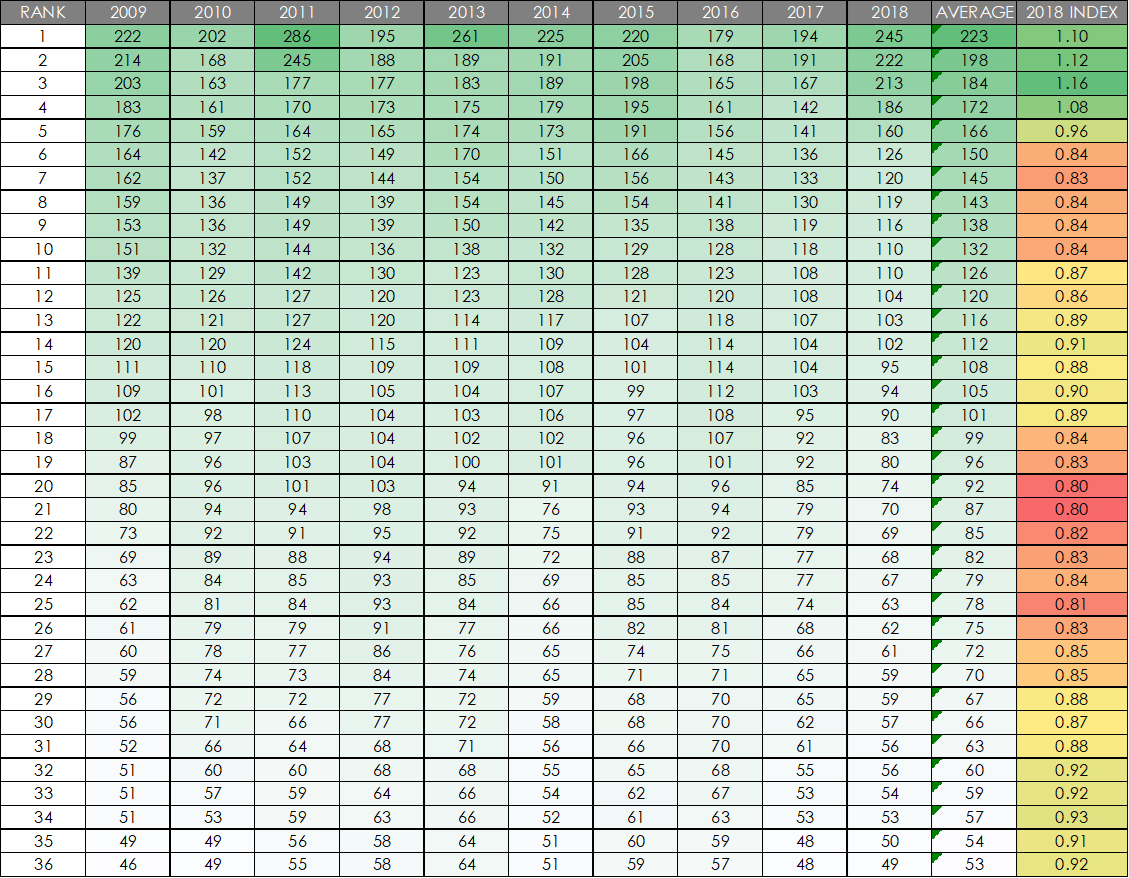
You probably know this already but last year saw four excellent performances followed by a whole load of abject ones. This should be a short-term phenomenon even though there will always be a relatively steep drop-off at the position. Everyone is buying a top three option because they think if they don’t have one of those, they’re in trouble but the players ranked fifth through tenth should be better in 2019.
Fullbacks
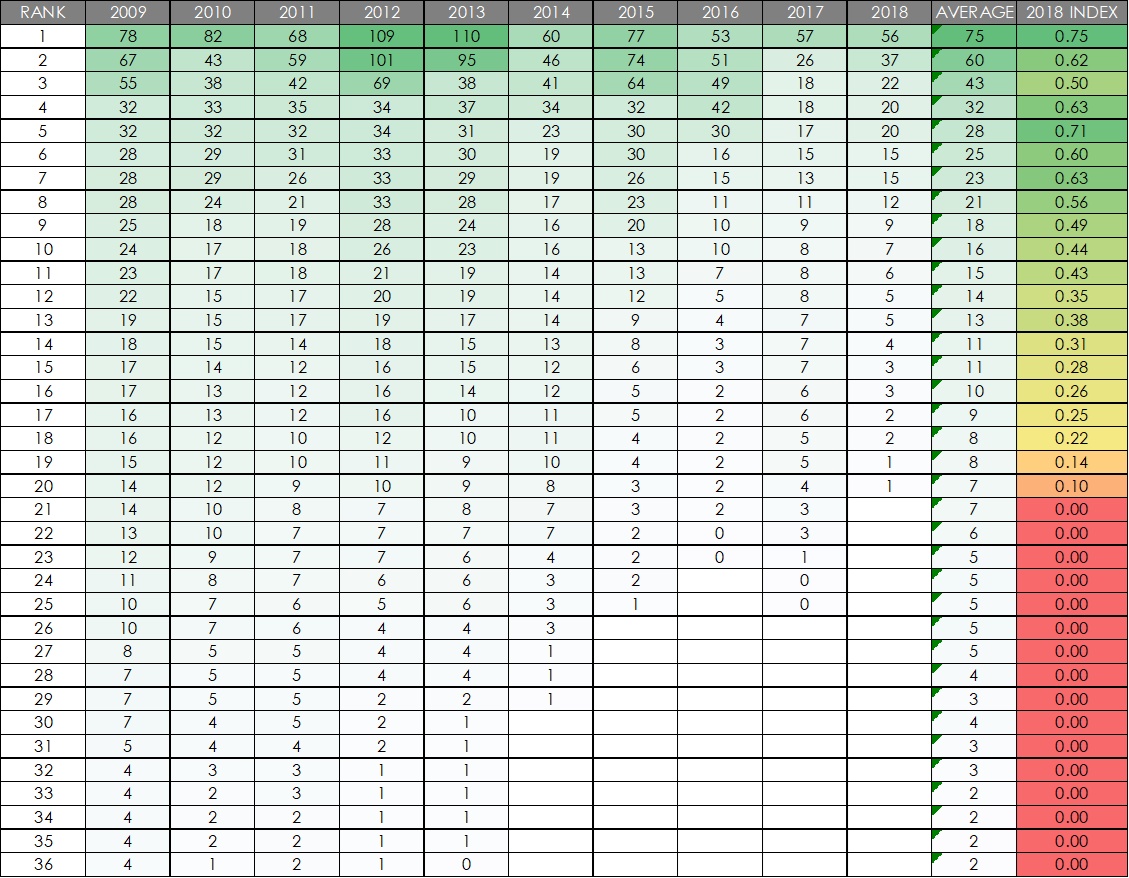
We know there’s a rapid, league-wide decline in FB scoring so it’ll come as no surprise to see poor indices for all the top options here. If anyone is playing in a league that requires a fullback, you have massive respect. But you should probably have them removed as soon as possible.
- Ten IDP Fantasy Football Stats You Need to Know after Week 16 - December 29, 2023
- Ten IDP Fantasy Football Stats You Need to Know after Week 15 - December 22, 2023
- Ten IDP Fantasy Football Stats You Need to Know after Week 14 - December 14, 2023


