Production Patterns: Past Draft Classes – 2015
The 2019 NFL draft is coming and I am breaking down past wide receiver draft classes, looking for patterns in production from 2012-2017. This will give us a six-year sample of what wide receivers’ production looked like even before the Combine and before we look at the new class.
We’re making a model but with names, not numbers.
So let’s check in on the first class of the wide receiver recession, shall we?
2015
Hopes were high and draft picks were expensive coming out of the 2014 season. While most cautioned temperance in the face of a clear outlier class, it was hard not to get excited – especially in dynasty.
The 2015 class, however, was remarkably less productive in college at an older age and that should have been our first and guiding clue.
[am4show have=’g1;’ guest_error=’sub_message’ user_error=’sub_message’ ]

On the face of it (lots of green over 20%) there were plenty of productive wide receivers in the class. But the drop in players drafted rounds one to three can be an indication of the opportunity available in the NFL and the potential of the class as a group.
What’s more, the 2015 class broke out at a much older age with players averaging over a 20% Dominator, having an average breakout age of 19.4 compared to the 18.2 of 2014. That’s also reflected in the drop off in age-18 breakouts from 5/19 (24%) compared to 2/13 (15%) in 2015. Moreover, two players, including one drafted in the first round (Phillip Dorsett) averaged less than 20% of their college team’s offense.
It got worse when compared to the average of successful players.
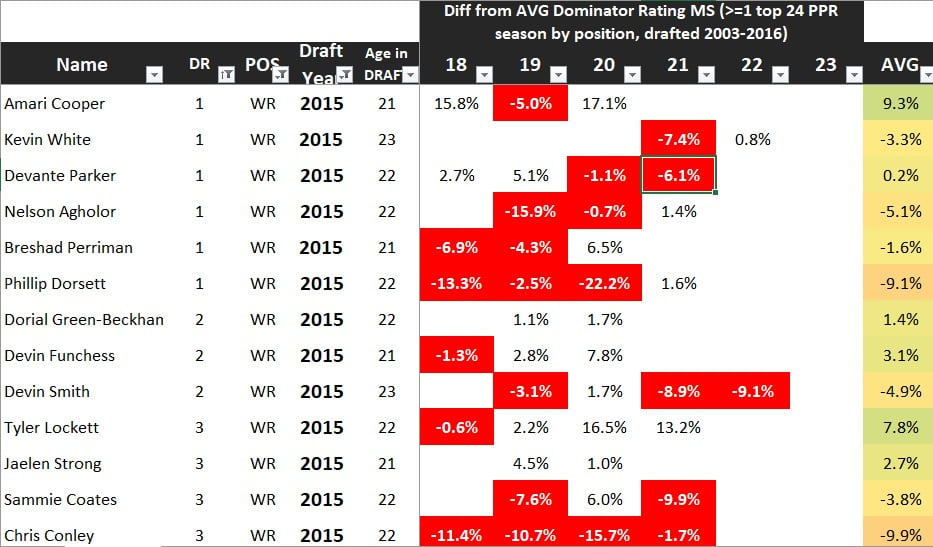
In 2014, 11/19 players drafted in the first three rounds averaged positive numbers, while in 2015 barely 6/13 hit the same benchmark and more than half the number of players had averaged over 3%.
As we know, some of the best players can come from the worst classes. But so far Amari Cooper – the clear production standout in 2015 – has had a rough road in Oakland and since been traded to Dallas. His production also improved after the trade.
The class as a group has produced only three seasons with over 1,000 receiving yards (all Cooper) and eight total top-24 seasons. However, having had only three years in the NFL, Cooper and Lockett (who, coming of several injury-plagued seasons, has shown promise) should add to these totals as time moves on.
In their rookie seasons, only Cooper, Lockett, Stefon Diggs (fifth round) and Jamison Crowder (fourth round) were able to produce over 600 receiving yards. Diggs and Crowder both had the highest average MS yards compared to the average for those drafted outside the first three rounds. Diggs is the only drafted player with a 3% over the average mark in that group, and in fact, ranked him third overall in this class.

Looking back, it’s hard to call anyone who has passed 600 to 700 receiving yards in their rookie season since 2012 a miss outside of Terrance Williams. Although several hits did fail to meet it such as Brandin Cooks, Allen Robinson, Davante Adams, and Alshon Jeffery.
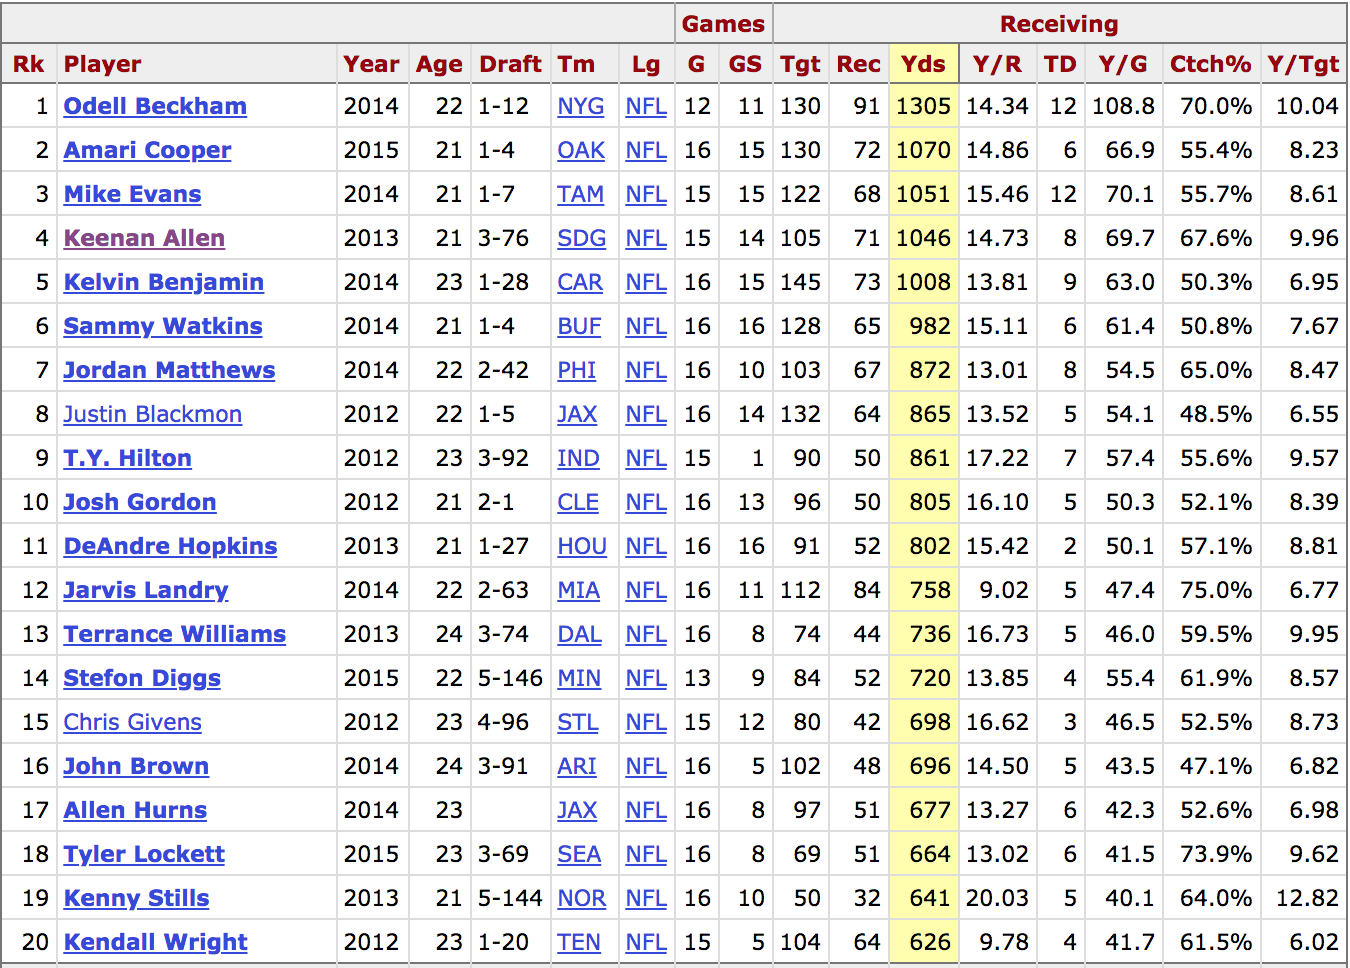
Table from Pro Football Reference.
Just Yards: Where the Cream Rises
Only Amari Cooper, Tyler Lockett and Jaelen Strong averaged over 30% of their team’s market share of yards in college. Once again, if we sort the entire class by how they compared to the average (Yards Over average or YOa) we see the most successful players climb to the top in the 2015 class.
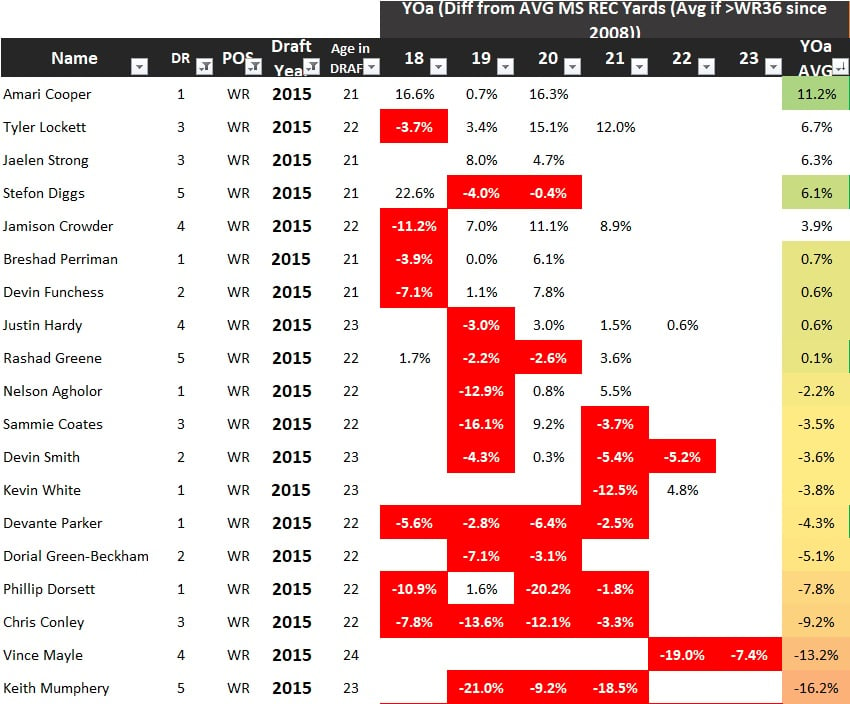
But again, it struggles to rank players very well when we zoom back out to look at our entire sample size. DeAndre Hopkins, for example, comes in 15th from 2012-2015, behind Robert Woods and Kendall Wright.
Patterns
A younger break out age still remains positive, and production marks prove very effective at highlighting a tight group of more likely productive players in 2015. In an underproductive class, it seems production is very good at sectioning off the likely from the less likely to hit in the NFL but as a scale or rank engine, it still struggles unless we compare multiple metrics and statistics at once.
With a relatively unimpressive class, Amari Cooper was easy to identify as the most likely to breakout and after the first three years, there are positive signs for Tyler Lockett and Devin Funchess. Moreover, production deficiencies did a great job of red-flagging players like Breshad Perriman and Kevin White, who, while they also struggled with injuries in the NFL, have yet to find a way to plant their feet when healthy either.
Importantly, just because a player produced at a later age does not indicate they are less likely to breakout. It more seems to be that the threshold for breaking out increases drastically. This makes some sense – as more developed and experienced players should be expected to do better.
It remains to be seen if Cooper and Lockett can be of the level of the 2013 class as the diamonds in the rough in the class of 2015. Although – I’d add that anyone who has been disappointed with Cooper so far needs to take a long hard look at what the other options could have been. Still, the 2015 class has been slower to develop for fantasy football.
It was a class that introduced us well to the terrors that were to come. Next up, is 2016, where nothing got better and things maybe even got a little worse.
See you there. Thanks for checking out this series again!
[/am4show]
- Peter Howard: Dynasty Fantasy Football Superflex Rankings Explained - March 6, 2024
- Dynasty Target and Regression Trends: Week 15 - December 23, 2023
- Dynasty Target and Regression Trends: Week 14 - December 16, 2023


