Production Patterns: Past Draft Classes – 2012
On the road up to the 2019 NFL draft, I am going to break down past drafts looking for patterns in players’ college production. Starting with the 2012 class and finishing with 2017, it will give us a six-year sample of what wide receivers have done in college before being successful in the NFL. I’ll then breakdown the 2019 class based on what we find.
Essentially, what I’m trying to do is write out what a mathematical model attempts to do. Step by step, I want to see what we knew about these players, who was relevant in hindsight, and then use it to adjust for the next class. And so on.
We will primarily be looking at market share, and how players produced in college compared to successful NFL players. Market share means the percentage of a team’s stats that the player produced (100 receiving yards is a 10% market share if the team had 1,000 receiving yards). I’ll also refer to this as “percentage of” whenever possible.
By the time I show the profiles of the 2019 class, we hopefully have our own model, but one full of players, not numbers.
Why?
If you’re following the right kind of people, you’ve seen this tweet by Ryan McDowell:
NFL Combine- 14 days
NFL Free Agency- 30 days
NFL Draft- 73 days
SFB9- 147 days— Ryan McDowell (@RyanMc23) February 11, 2019
It’s exciting watching the time tick down to the main events of the off-season. Rookie drafts are the heart of dynasty football – we all love drafting, we like rookies. But how should we use the time left between now and the draft?
While DLF will continue to be filled with articles about the incoming class and how to view them, I spend a lot of time looking back. Most of my research takes the form of graphs or percentage scores but sometimes those don’t convey the context I want. What does “18% R^2” really mean to most of us?
- R^2 is a mathematical value that expresses the amount of variance between two different value sets…. not so helpful? I agree. In essence, the closer to 1 (100%) the r^2 number is, the more the one number “explains” the other number. So draft round “explains” about 28% of a wide receiver’s average points per game over their first three seasons, for example. If it was 100% then draft round would tell us exactly who was going to score more points per game.
No one class provides the context we need. But hopefully, if we look over enough of them, those r^2 values will start to make more sense without having to do any math at all.
[am4show have=’g1;’ guest_error=’sub_message’ user_error=’sub_message’ ]
The Wide Receiver Years 2012-2014
The 2014 wide receiver class has been the most productive and impressive wide receiver class to enter the NFL. It was a year that shook fantasy football – especially the dynasty community – to its core. Its effects still resonate in the way we draft and play. Sometimes for good reasons, and sometimes to our detriment.
But while 2014 often steals the show, the position had been strong in rookie drafts for a while before 2015.
We could easily start breaking down the ‘wide receiver boom’ years from 2010 (Demaryius Thomas, Dez Bryant, Golden Tate, Emmanuel Sanders) or 2011 (A.J. Green, Julio Jones, Randall Cobb). But since dynasty owners often think in three-year windows, I’ve decided that is the best way to go.
So, today we will just start by looking at 2012.
What did 2012 Ever Do For Us?
Think back (if you can, millennials) to 2013. Justin Blackmon (first-round pick) and Josh Gordon (a second-round pick) had both broken out with 800+ receiving yards in their rookie seasons the year before. Kendall Wright and Michel Floyd, also first-round picks, had been less successful (and would continue to be) with 500+ and 600+ receiving yards respectively. A.J. Jenkins had been a complete bust, starting only three games with zero everything despite being healthy. T.Y. Hilton had exploded out of the third round for over 800 receiving yards and would soon be the best wide receiver from that draft (for fantasy, at least).
Marvin Jones was drafted in the fifth round, Travis Benjamin in the fourth, Rishard Matthews in the seventh and undrafted free agent Cole Beasley was also signed at this time. They were all waiting to make their own impacts later (not that we’d care for a few years).
Alshon Jeffery, from the second round, had yet to show us his potential, but would soon explode in his sophomore year for over 1,000 receiving yards.
Overall, those looking forward to the 2013 season were excited from a rookie class of wide receivers that had done well – though we now know many of them were set to fail in one way or another and for different reasons.
To date, the 2012 class has given us 13 top-24 seasons and two top-five seasons. It was 2014 before 2014 was a thing. Heck, it was so good we even kept hoping Brian Quick could break out.
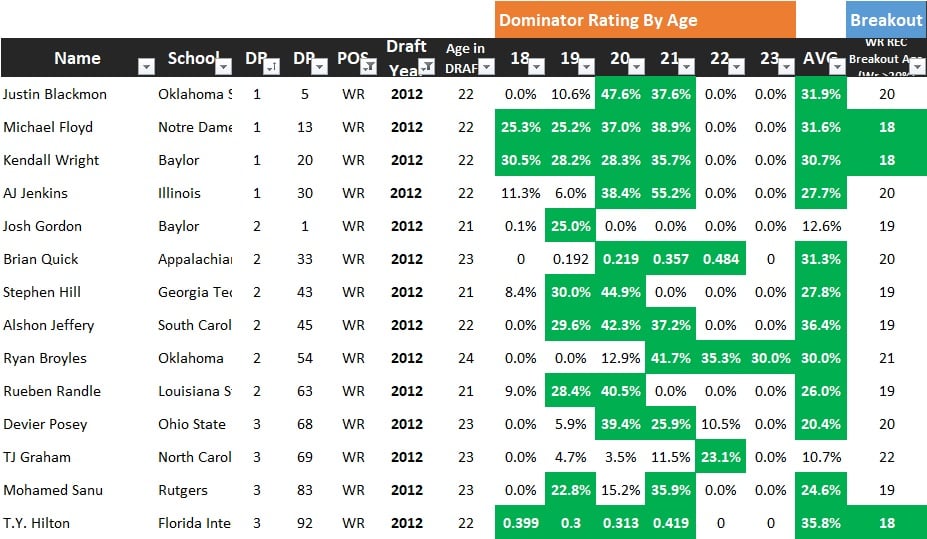
Above you can see each player drafted in the first three rounds of 2012. You can also see the ‘Dominator Rating’ (combined receiving yard and touchdown percentage) each had for every age they played in college. This is what we knew about them before the Combine. (My database is limited mostly to players who played in the CFB.)
Context and Signals
There were three age-18 breakouts in the first three rounds of 2012. Notably, the two first-rounders would never live up to their draft capital, while the third-rounder, Hilton, is easily the most relevant and successful player to come from this class.
Let’s take a closer look at how these players did compared to the average successful players (at least one top-24 season).
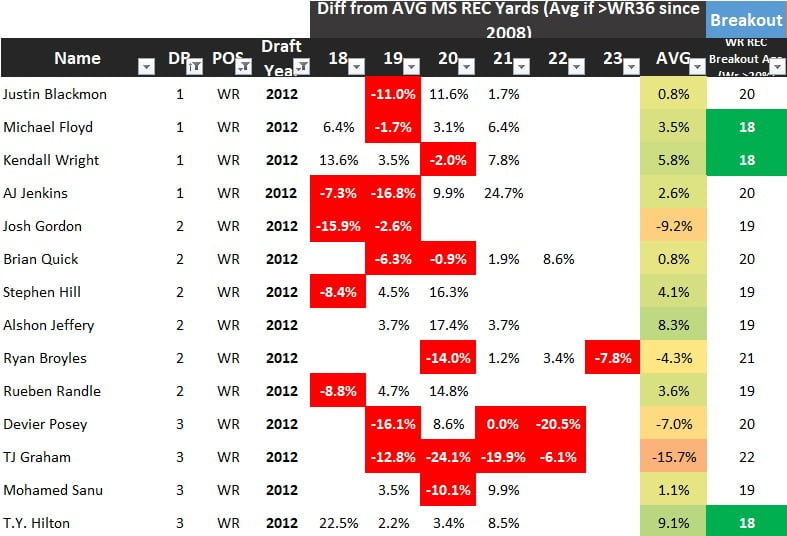
In my opinion, if a player doesn’t have positive numbers in this comparison, then they DID NOT have great production in college. I think that’s sometimes missed. It’s not just about meeting breakout thresholds, it’s also about doing well compared to good players. That’s what this view gives us.
Jeffery and Hilton stand out as the only two players to have been above average every single year in college. T.J. Graham combined a late breakout age with a general lack of production compared to successful players.
It’s noticeable that Josh Gordon – who was about to have one of the most prolific seasons for a wide receiver in 2013 – was one of the few players who averaged below successful players every year. That’s worth remembering, since the best seasons don’t necessarily all come from perfect profiles. But the best profiles, Hilton and Jeffery, are certainly putting us in the right places.
To the Time Machine
By itself, it’s difficult to see anything that helps identify the best fantasy players in this class. We know there are several hits and one long-term stud. We also know there is some connection, or trend, between productive players in college and success in the NFL. But we need more examples to see how useful it is or isn’t.
To find out more, we have to compare it to something else. A model tests over a very large sample size (ideally) looking for comparison points. Us? Well, we are going to travel through time to 2013 – which sounds like a heck of a lot more fun to me. Suck it, models!
Patterns
For now, I think the safest conclusion we can reach is that while all successful players in the NFL from 2012 were productive in college, not all productive players in college were successful in the NFL.
Thanks for checking this out, and I’ll see you next time.
[/am4show]
- Peter Howard: Dynasty Fantasy Football Superflex Rankings Explained - March 6, 2024
- Dynasty Target and Regression Trends: Week 15 - December 23, 2023
- Dynasty Target and Regression Trends: Week 14 - December 16, 2023


