Adventures in Scoring: Fixing Quarterbacks, Part One
The Super Bowl is over. The massive drunk fest that was the victory parade in Philly is behind us (Congrats, Eagles fans!), and now we settle into the long abyss that is February. If you live in the upper Midwest like I do, this can be a bit of a lonely time. Single digit or subzero temperatures outside combined with a general dislike of pro basketball means I have a lot of time to think. That can be dangerous, but it also takes me down some interesting paths at times.
I was recently engaged in discussions with potential new owners when trying to fill up a few open spots in some leagues I run. As with all good prospective owners, they ask a few questions about the league. One of them always is about the quarterback position. Is it 1QB, superflex, or 2QB? In this case, the league was a 1QB league. One of the responses I received was rather interesting to me. In this case, the owner said, “I don’t really care for 1QB leagues. All the QBs are the same, and their trade value is s—.”
While this isn’t the first time I’ve heard someone make a comment like that, it did get me thinking. Is that really true? Are they all essentially the same? If so, how can this be fixed to revitalize the position in 1QB leagues?
[am4show have=’g1;’ guest_error=’sub_message’ user_error=’sub_message’ ]
Fast forward a little bit, and I’m sitting here in my classroom, several hours after all the students are gone, with a massive spreadsheet. It took a while, and the first part of the results aren’t going to surprise my discussion partner, but I think I have some answers to all of my questions. Allow me to walk you through my process so we are all on the same page.
The Investigation! Are all quarterbacks in a 1QB scoring system the same?
Okay, okay. I know he was exaggerating a little bit when he said that they are all the same. That isn’t exactly what he meant. He simply meant that there is very little difference between the various tiers in a one-quarterback league. I decided to put some numbers to it since that is what math teachers do!
I started by pulling all of the stats and scores for the top 24 quarterbacks in the league. In other words, all of the QB1s and QB2s for a 12 team league. I used the stats for weeks 1-16 during the 2017 season. I avoided week 17 because I feel a lot of strange things happen that week for a few teams, and I didn’t want it messing with the data. Anyway, once I had the raw stats, I took what I feel is a fairly standard quarterback system and applied it. There are always different scoring systems, but I went with this:
- 1 point for every 25 passing yards
- 1 point for every 10 rushing yards
- 4 points for every passing TD
- 6 points for every rushing TD
- -2 points for every turnover
With this scoring system, the top five quarterbacks were Russell Wilson, Alex Smith, Cam Newton, Tom Brady, and Carson Wentz. Kirk Cousins was just a few points behind them. These were likely the top five guys in most leagues this past year unless you do something vastly different with your scoring. Using the above scoring system, Wilson ended up at 323.48 points while number five, Wentz, had 273.74 points. That is a difference of 49.74 points. That is a decent difference. However, the difference from second to fifth was just over 21 points on the season or a little over 1 point per game. In my eyes, that definitely falls into the very-little-difference category.
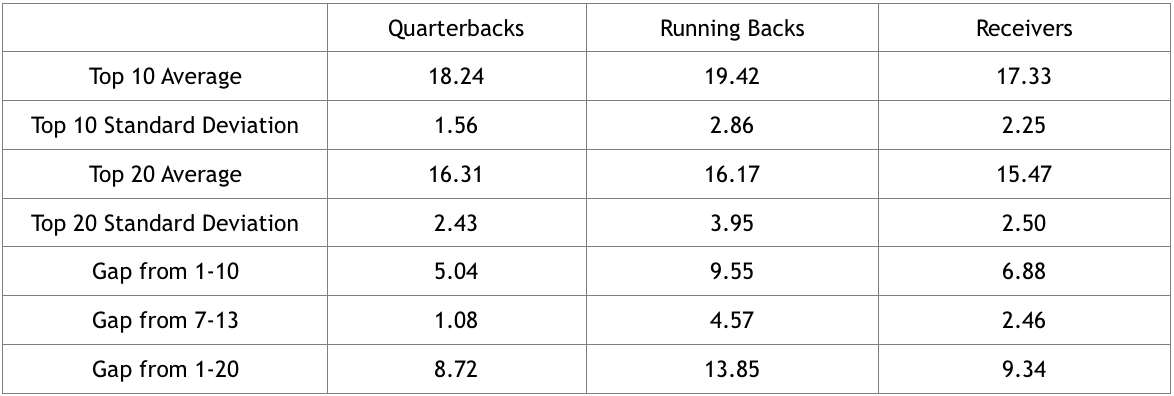
Then I started looking a bit broader picture at the position and used a few statistics. The mean of the top 10 quarterbacks was 273.6 points or 18.24 points per week (remember I did not include week 17 stats, so only 15 games). The standard deviation, or the average distance a player was away from the mean, was a measly 1.56 points. That is pretty low. Well, maybe it is just a factor of the top few quarterbacks all being comparable, but it is just a large tier with a massive drop off. To check that, I expanded to a larger group again.
This time I took a look at the top 20 quarterbacks. The mean score for the top 20 quarterbacks was about 16.31 points per game with a standard deviation of 2.43 points per week. While it is better, there still isn’t much difference. To make matters worse, I compared a mid-level QB1 (Ben Roethlisberger in this case) to a high-end QB2 (Blake Bortles was 13th) to see what the drop off was from a player who should be a mid-level starter in a 12 team league to one who should be a high-end backup. The difference was only 1.08 points per game. No wonder people say all quarterbacks are the same!
How does it compare to other positions?
Well, I discovered that in fact quarterbacks are very similar in their scoring. Yes, there are definitely some who score more than others. However, the incentive to spend draft capital or to trade for a top-flight quarterback when the gain is rather limited just isn’t there for most of us, which proves the point of the original discussion. This then made me think, how does this compare to other positions?
Much like the quarterbacks before them, I decided to look at the top 24 running backs and receivers for weeks 1-16 for the 2017 season. I used a fairly simple PPR scoring system as follows:
- 1 point for 10 yards rushing or receiving
- 1 point per reception
- 6 points for a touchdown
- -2 points for a lost fumble
Once I had the data gathered, a few things stood out to me. The first is that Todd Gurley had a really special season, especially towards the end. He put up over 30 percent of his season-leading point total during the fantasy playoffs. It makes me wonder what percentage of dynasty champs had Gurley on their roster this year! He averaged nearly 3 points per game more than the next closest running back and more than 3 points per game more than the best receiver.
Once I was able to look past Gurley, I started to notice some other patterns through the top 10 and top 20. Here is how the data broke down in points per game:

When I figure looked at the data as a whole, I was a little surprised. I expected to see more different within the top 10 at the running back and receiver positions. If you take the top two or three out of each position, there really isn’t much difference within the top 10 at either position, just like we noticed at the quarterback position. Granted, it is a little bit more variation than quarterback, but not by a huge amount.
However, if we look outside of the top 10, we see a much faster drop off in the running back and receiver ranks. Take special note of the gap from a middle level one to a high end two at the position (the 7-13 gap). Receivers are nearly 2.5 times the quarterback position while running backs are almost 4.5 times the gap!
As I thought about this a little bit more, something else occurred to me. In most 1QB leagues, you start 1-2 running backs, 2-3 receivers, and an additional 1-2 flex players. That means you might be going 30-40 players deep at the running back position and as many as 50-60 deep at the receiver position for your starting lineup. When looking at the gap from 1-20 for both running back and receiver, those 20th-ranked players are every week starters for their teams. In fact, the 40th-ranked player at running back or receiver might be an every week starter for their teams.
At the quarterback position, that definitely isn’t the case. Everyone is starting a quarterback in the top 20 pretty much each and every week. What we really need to be looking at is comparing the drop off between mid-level starters and the top “bench” players. If we do that, we are seeing huge drop-offs at running back and receiver, but very little at the quarterback position.
What can we do about it?
I suppose we could just shrug our shoulders and say that is just the way things are. Or, we could just chalk it up as another reason playing in a 1QB league is a thing of the past (I know some think this way!). However, neither of those would be very much fun!
I decided to take a different approach. I wanted to play with the numbers a bit and see what I could come up with in terms of a new scoring system. I wanted to build upon the “standard” quarterback scoring and figure out a way to delineate good quarterback play from bad quarterback play and to have that show up in fantasy points. The trick was that I didn’t want to increase overall quarterback scoring because I wanted it to stay fairly close to running back and receiver scoring, but I did want there to be more of a difference between the great, good, and very mediocre on any given Sunday.
It took a while, but I think I finally came up with something which might work. Granted, I’ve never tried this scoring in a real league, so it is purely a theory at this point in time. However, I wanted to toss it out there as a potential option for people to consider.
What is it you might ask? Well, come back tomorrow for part two. I’m already late for dinner, and my wife gets crabby when I tell her I’m late because I was playing with a bunch of numbers for “fake football” as she puts it!
[/am4show]
- Final 2021 Pre-Draft Rookie Mock: Round Three - April 28, 2021
- Final 2021 Pre-Draft Rookie Mock: Round Two - April 26, 2021
- Final 2021 Pre-Draft Rookie Mock: Round One - April 25, 2021


