Rookie Rebuilding: Part 4 – Combine History: RB
It’s time we head deeper down the rabbit hole Alice. The NFL Combine!
I started this series with full expectation that I’d primarily be focusing on refreshing my work from previous years on the NFL Draft toward determining if draft position could be a major determinant in ultimate fantasy success. As would be expected, previous studies have shown a direct correlation between round selection and fantasy success. Nice to know, but nothing unexpected. Next, I went deeper by cross-referencing a decade of fantasy drafts, overlaying them with NFL drafts to ascertain the likelihood that any given fantasy selection would turn into a productive fantasy player, by position and round. Things started getting much more interesting with the numbers showing just why it can be so difficult to build a championship team primarily via the draft.
Since beginning this year’s series, I found myself wanting to go deeper. So rather than looking at only NFL Draft selections related to fantasy rookie draft selections, I decided to pull in a decade of top-ten performances in fantasy by position and cross reference not only drafted round, but other important traits and characteristics including height, weight, and combine metrics. The hope here is that through an exercise of exposing the details of top performers, we’ll be able to make more savvy selections in our drafts.
In Part 2 of this series, I looked at running backs and found that size does matter, although perhaps not quite as much as expected. Now, I’m going to fold in combine metrics for the top-ten (fantasy) running backs over the past decade.
Before I get started …
The NFL Combine puts players through a gauntlet of drills, interviews and assessments. To believe that each drill carries the same amount of significance is a mistake. Prior to laying out this article, I decided to go down yet another rabbit hole toward determining which drills and corresponding results were the greatest determinant of success at the next level. Both from analysis of the players and their related Combine performances over the past decade when coupled with specific external resources from others having done similar work, I feel confident in the drills I chose.
One particular recent article that I found very well done, not to mention very applicable when reviewing the results closely, was written by Tony Villiotti which can be found here. I highly suggest that you check out Mr. Villiotti’s work as it did play a big role in ultimately settling on specific drills, those being:
[am4show have=’g1;’ guest_error=’sub_message’ user_error=’sub_message’ ]
- 40 Yard Dash
- 20 Yard Split (First 20 yards of the 40 yard dash)
- 3-Cone Drill
- Broad Jump
I was most surprised by the inclusion of the broad jump but further research left me sold such that I’m including it. Surprisingly enough, or not-so if you have your ear to the ground, the 40-yard dash continues to be somewhat overrated in foretelling a player’s success at the next level, especially for larger running backs. But alas, a Combine article leaving out the 40-yard dash scores would not be received well. Overall, the running back position is the most difficult in my estimation to nail down a limited set of combine drills to focus on. but I feel good about my process and the results.
Whether you wish to get into the details or simply prefer to look at this past decade of performance relative to the results the players achieved, there should be something here for everyone. I’ll weigh in with my thoughts following the list.
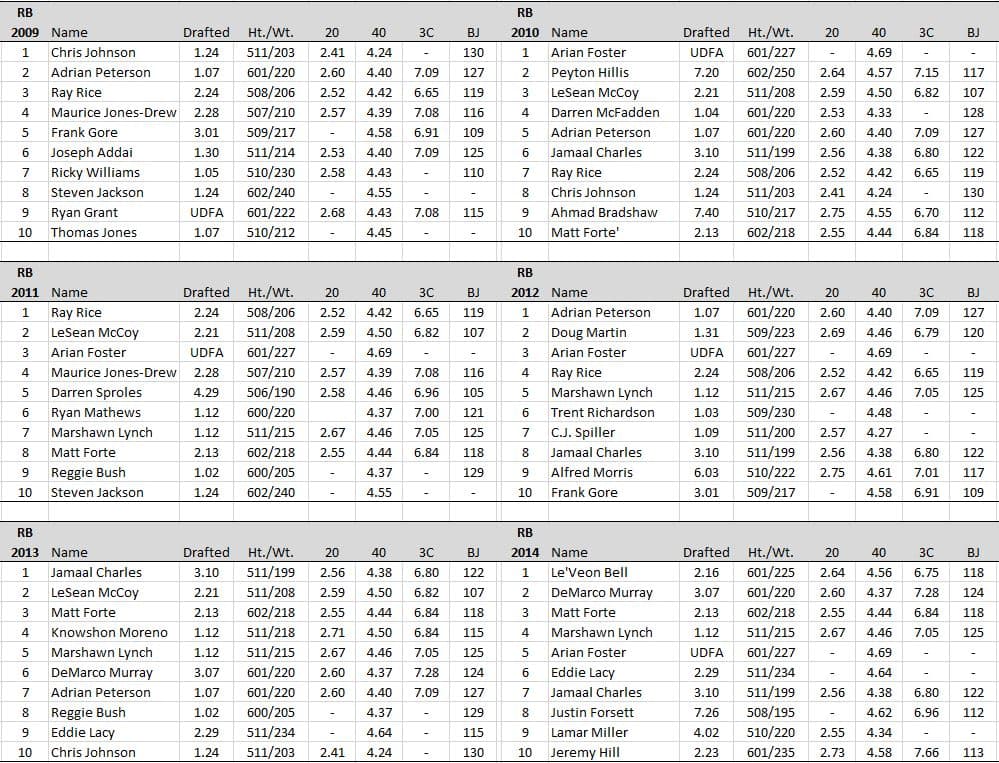
Let’s take a look at the past decade of top-ten running backs and their respective information and scores:


Inside the Numbers
Firstly, it’s disappointing that we’re missing as many data points as we are. This is primarily due to these backs not running at the Combine, not performing specific drills at their respective on-campus pro-days or being undrafted without any reporting from their pro-days. But we do have enough to draw conclusions in my estimation.
Looking at the players that finished at the top of the rankings for the decade and relating that to everyone’s favorite 40-yard dash, perhaps we can find a speed correlation. Interestingly enough, the past decade has found a different back at the top of the list each year in PPR formats.
2007: 4.57 – Brian Westbrook
2008: 4.44 – Matt Forte
2009: 4.24 – Chris Johnson
2010: 4.69 – Arian Foster
2011: 4.42 – Ray Rice
2012: 4.40 – Adrian Peterson
2013: 4.38 – Jamal Charles
2014: 4.56 – Le’Veon Bell
2015: 4.50 – Devonta Freeman
2016: 4.40 – David Johnson
Initially, it appears as though we do have a relatively even distribution for Chris Johnson’s blazing 4.24 to Arian Foster’s slothful 4.69.
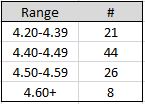
Expanding on the times and looking at all 100 forty slots for this decade, we find the following ranges:

Overall Average = 4.46
For the next two points of reference, I’m going to average the scores for the top ranked back each year and the same for the last ranked back for each year for our decade of data.
Top Ranked Average = 4.46
Lowest Ranked Back Average = 4.49
Close inspection will reveal only 99 40-times are tallied. This is due to the absence of Danny Woodhead’s time. In fact, Woodhead had no official times listed in this study. Note that the “Overall” average and the “Top Ranked” average are the same, but we do see a small drop to the lowest ranked (within the top-ten) back from each year.
I’ll let you draw your own conclusion here in that you can clearly see the average 40-time at work with 44% falling in the 4.40-4.49 range and 65% falling below 4.50 overall. The existence of Arian Foster, Le’Veon Bell, Steven Jackson, Frank Gore and LeSean McCoy at 5.50 or greater does prove that you cannot automatically write off times slower than 4.50.
Let’s turn our attention to the 20 yard split, 3-cone drill and broad jump.
With these drills, data begins getting more sparse but perhaps we can still glean useful information.
Top Ranked Back 20 Average = 2.59
Lowest Ranked Back 20 Average = 2.62
A difference, but small.
Now let’s do the same with the 3-cone drill:
Top Ranked Back 3-Cone Average = 6.94
Lowest Ranked Back 3-Cone Average = 7.05
Another difference and we are starting to see a trend, albeit small, between top performers and lower backs, even if within the top 10.
Broad Jump:
Top Ranked Back Broad Jump Average = 121.4
Lowest Ranked Back Broad Jump Average = 119.4
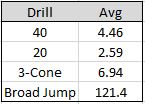
The trend continues and we can bring all of our averages together. In doing so, we now create an average line that may give us a mark for comparing backs following the combine (and/or pro-days):

Summary
Truth be told, I wasn’t sure that I would find any trends within the running back position, especially those outside of the 40-yard dash. I was surprised when researching drills that showed the most correlation with performance at the NFL level to find the broad jump highly correlated, but it does make sense when considering lower body explosion. While not purely scientific, and arguably without enough data points or in-depth analysis to make any concrete declaration, I’ve seen enough in the scores to feel pretty good about using the averages across the four primary drills as another measure of consideration when combined with collegiate production and drafted situation.
I strongly suggest you look at the decade of data more individually as well toward singling out the great performers from this period as you will find some inverse correlations that must be taken into consideration. For example, the broad jump and 3-cone drills do seem to be inversely correlated to some degree. Specifically, those with the higher broad jump numbers do seem to suffer from below average 3-cone scores. The theory here would be that greater lower body explosion in the form of bigger quads and hamstrings may also reduce hip flexibility and, therefore, agility. A notable exception to this is the recent arrival of David Johnson. When looking at his scores, it seems to tell a story of a player that went unnoticed by the masses in that his broad jump score of 127, when coupled with his 6.82 3-cone score and his 4.40 forty, seemed to foretell the next coming of Adrian Peterson – or better.
Just don’t mention that to those that drafted Darren McFadden, including yours truly.
Next, we survey the wide receivers and find the most correlated Combine drills for the position.
Follow me on Twitter: @DLF_Jeff
[/am4show]
- Lineup Advice: Wrap-up, Thank You and Goodbye (TTFN) - January 1, 2024
- Lineup Advice: Week 17 – Championship Edition - December 26, 2023
- Lineup Advice: Week 16 – The “What is” Edition - December 19, 2023


