Benchmarking Production: What makes an Elite IDP?
We all know that the toughest thing about IDP is the scale. Keeping track of an extra 500-1,000 relevant players per season is just hard work. It’s also basically impossible to actually properly watch all of those players every week. Sure, you can watch the highlights and pick out the guy who makes a big play. Some people even manage to watch every game in condensed format every week. Much respect to them. But many people (like me) can’t do that. We watch what we can, and use numbers and people we respect to fill in the rest.
This isn’t a bad thing – it’s reality. But it does mean we tend to default back to lowest common denominator assessments. “Player X is good” or “player Y is bad” are the most common, but there’s also a lot of snap assessments based on tiers like “player Z is going to be an LB1”. Regardless of how trustworthy statements like that are, I wanted to delve into what that actually means. To be in that exalted top tier of each position, what sort of numbers do you actually need to put up? The standard caveats of scoring system and starting requirements apply, but this is my attempt to benchmark what we should be looking for in the IDP world.
To understand what the levels look like, I split all IDPs from the past four seasons into the main IDP categories. DT, DE, LB, CB and S. I then listed all players in order of four major stats (solo tackles, assists, sacks and PDs. I did NOT include interceptions here because of the high variance associated. INTs come along in such small numbers that they’re extremely hard to predict, and when they do happen it’s often down to the quarterback where they go. If you play in a league with ten points per INT then this won’t help you much I’m afraid. The same applies for fumbles forced/recovered.
I listed each stat independently by each position. So I had each stat category listed out for each position. Obviously actual players moved up and down the lists by category. The DE who led the league in sacks was not the DE who led the league in solo tackles. I did this mainly to stay independent of scoring foibles (I didn’t want to produce numbers that only helped a few leagues) as well as to remove stat crew impact as much as possible and just get a “true” picture of what each stat looks at by level.
Straight away there was an obvious finding; many stats are declining at the top end. You’ll see this later in the article but it’s important and fairly clear. I have several theories for what it is. Offenses are getting better and more efficient, NFL teams are employing more and more “committee” positional approaches and the continual increase in passing volume (and associated longer plays) reduces the number of defensive statistical opportunities. These might all be wrong or right. It doesn’t matter. The simple fact is that many IDP benchmarks are dropping. It also explains why I used four seasons; because I didn’t want data from too long ago unfairly influencing the results. I wanted my dataset to be big enough to iron out some outliers but to reflect what reality will be in 2017 – not what it was in a time that in NFL terms is ancient history.
[am4show have=’g1;’ guest_error=’sub_message’ user_error=’sub_message’ ]
Defensive tackle
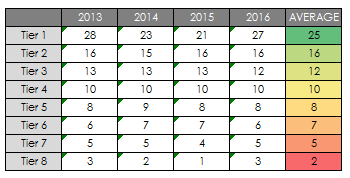
First let’s look at the king of all IDP stats – solo tackles. This is how DTs have produced across the last four years:
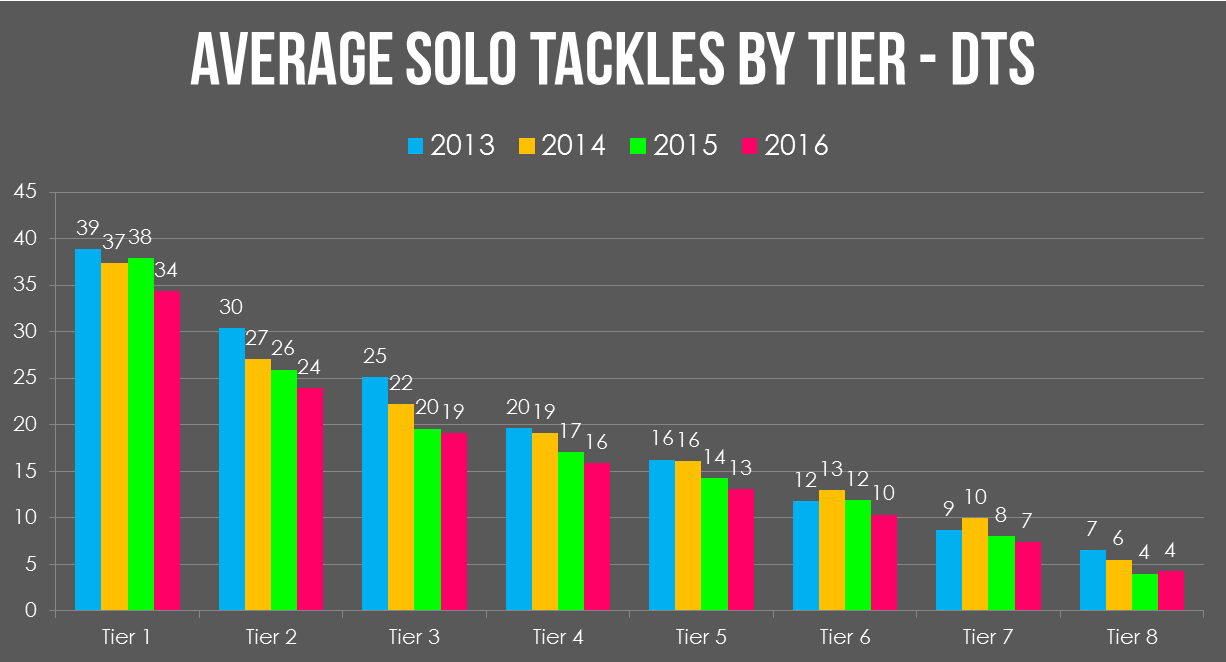
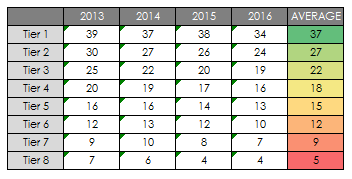
The very best tackles in the league from tackle are getting up to 40 or more solo tackles a season. 35 is a good number to expect from a top tier option.
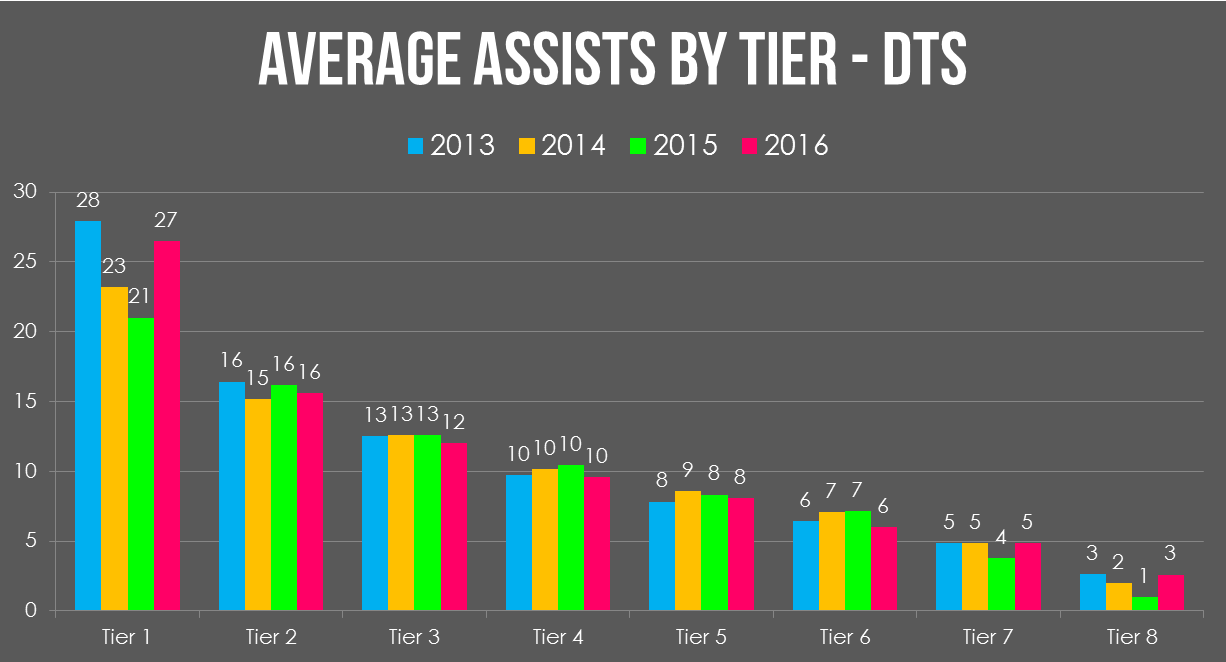
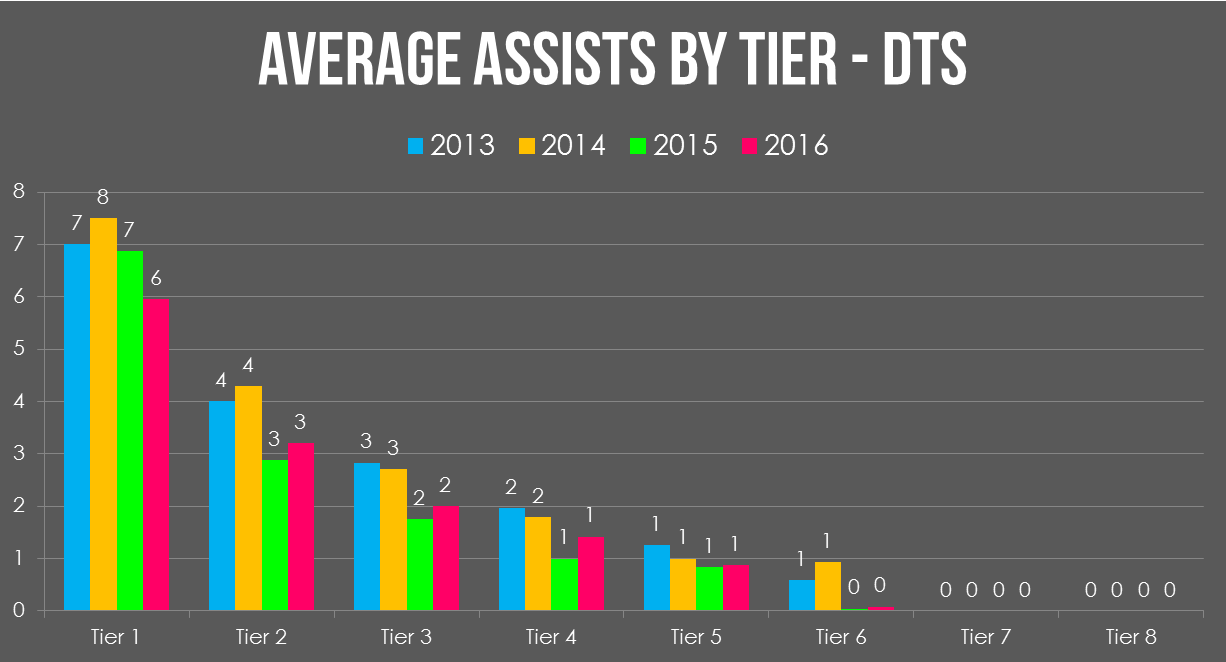
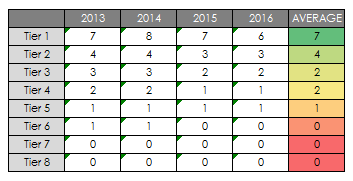
As you can see, the number of assists for tackles is fairly close to the number of solos. The best in the league might get 35-40 in a season. There is a fairly steep drop-off after that with all the tackles from tiers two-four somewhere in the teens.
Double digits is the mark of excellence here. It’s only been done six times in the last four seasons. If a player manages six or more sacks a year, he’s going to be in the top tier. Again, look how fast it drops off. If you don’t have a tackle from the top tier it’s extremely likely you’re only getting three sacks a season. That’s not going to win you many games.
Defensive end
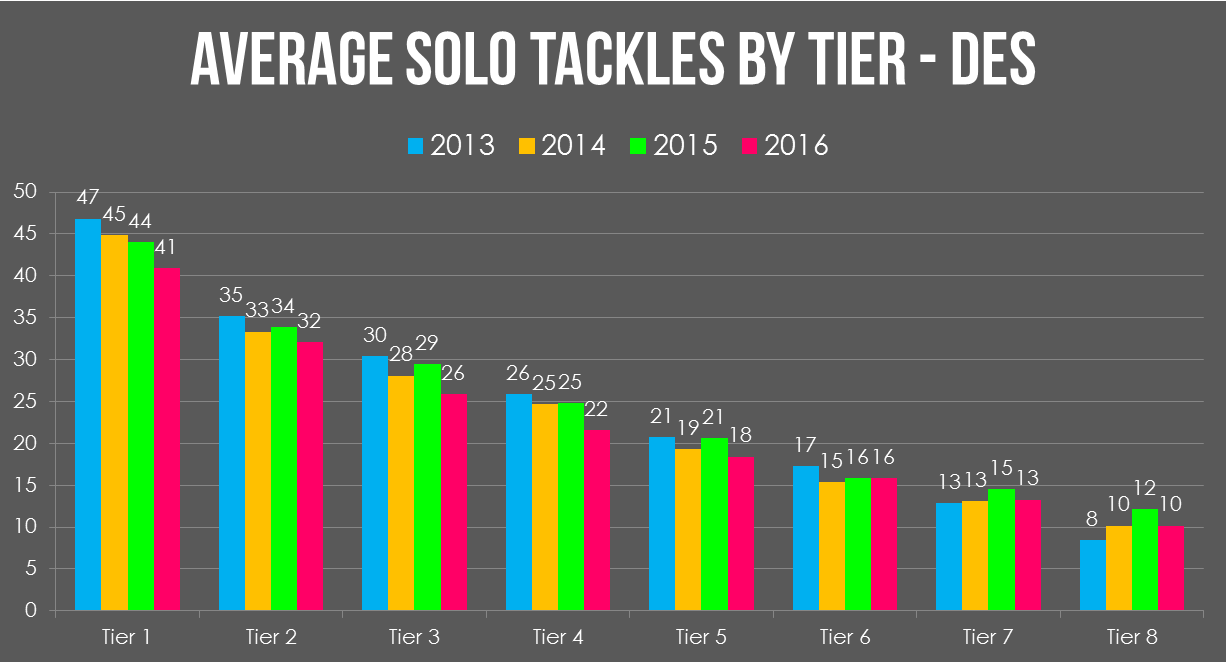
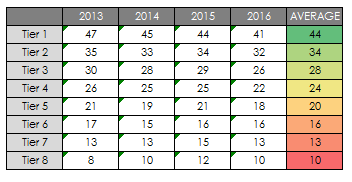
An easy one to remember here; a top-tier end is looking for 40 or more solo tackles a season. I.e. getting close to three per game.
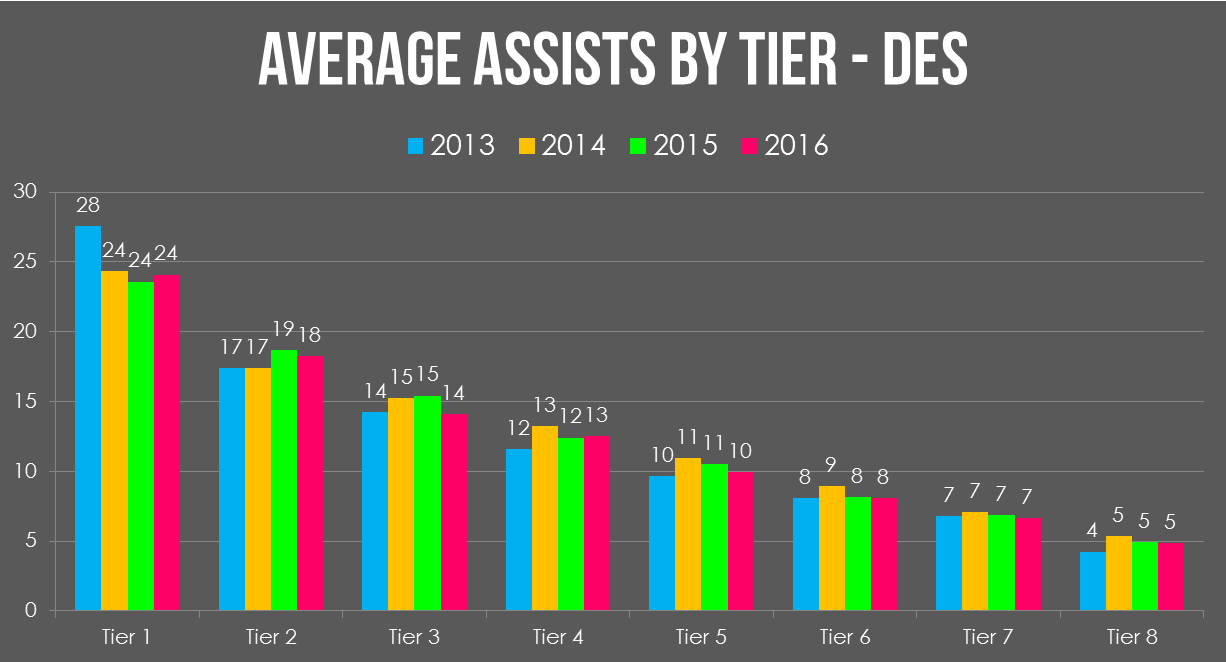
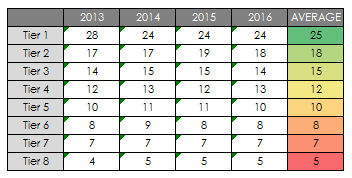
The magic number here is 20. Note that’s about half the number of solos, whereas with tackles it was close to being the same number. This is a key difference and you should be aware of it when assessing your league’s scoring settings.
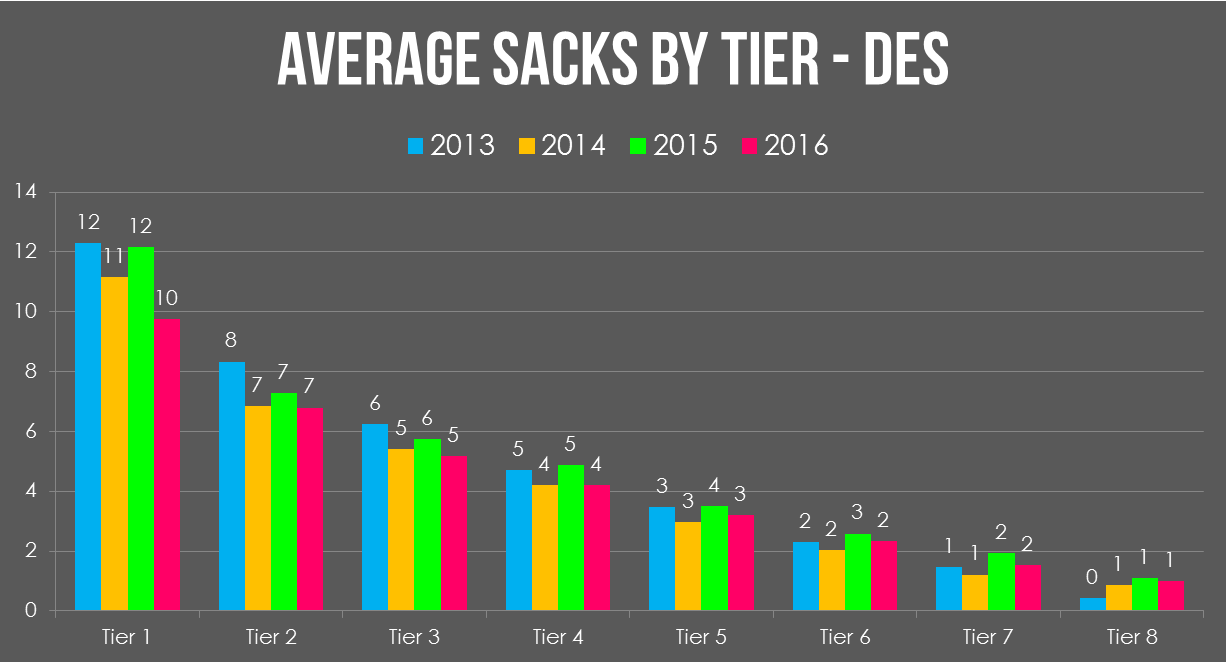
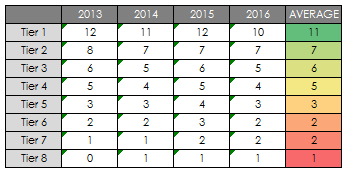
The key number is ten. 36 of the 48 ends to have had a top-12 sacks season over the last four years managed double digit sacks. 2016 was actually a down year but I expect the league to bounce back a little. Again it’s worth noting that ten sacks is far less than one every week. So even elite DEs are going to give you plenty of weeks where they don’t score big fantasy points.
Linebacker
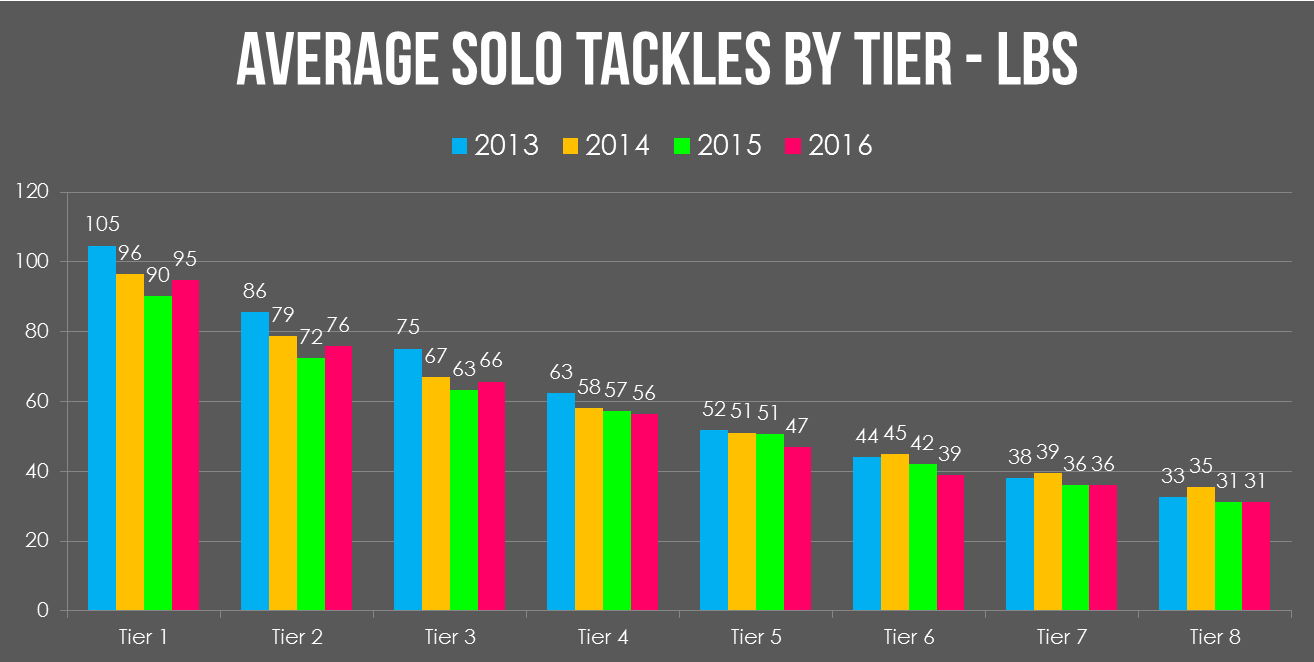
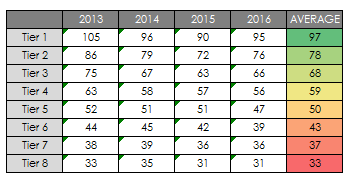
The number people like to bandy around here is 100. I’d advise a slight downgrade and say that 90 solos per season (around five and a half per game) is the number you should be expecting. 100 is better, but it’s only been done 15 times in the last four seasons. It’s exceptional – not expected.
The thing to note here is the relatively slow decline. An LB2 is still putting up around 80 solos per season (five per game) which is considerable. Even an LB3 is putting up more than four tackles a game. As you hopefully know by now, LB is a very flat position. The advantage an elite option gives you is less than in several other positions.
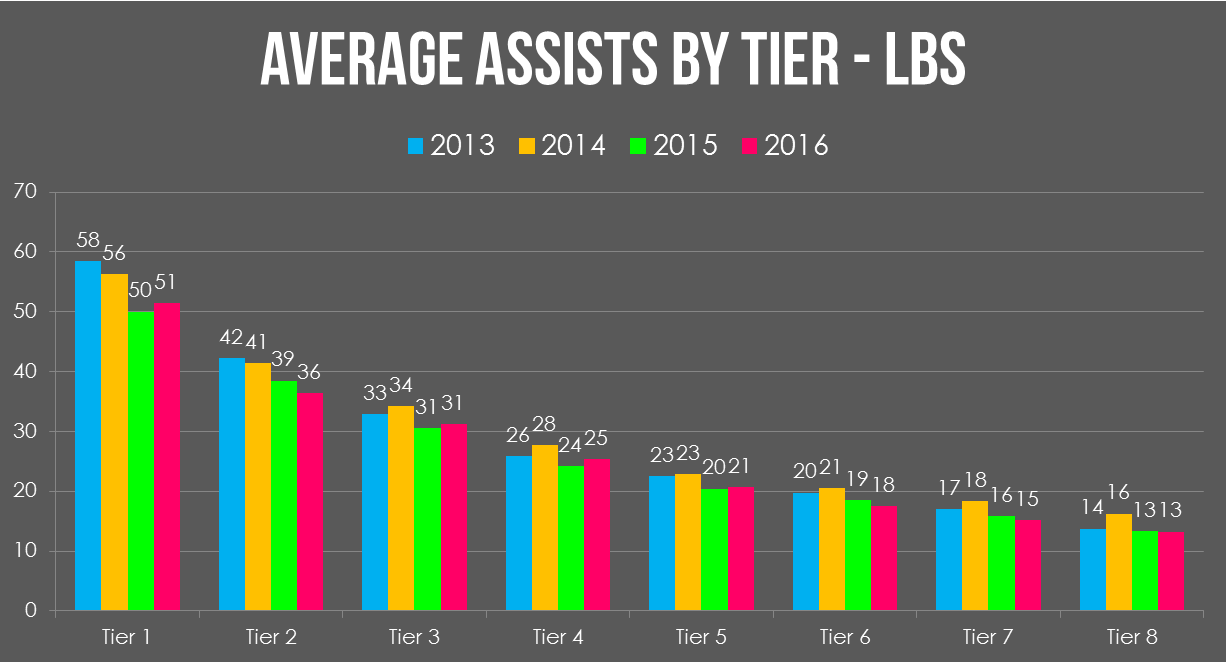
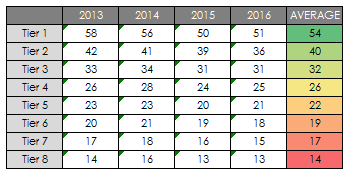
An LB1 is looking for around 50 assists a season. Around 60% of their total solo number. This is heavily affected by stat crews. In Seattle, Carolina or New England you should expect a lower ratio. In Jacksonville, Chicago or Arizona don’t expect the same ratio.
Again this is a gradual drop-off. An LB2 would expect to record around one fewer assist per week than an LB1. And LB3 only half an assist per week fewer than an LB2.
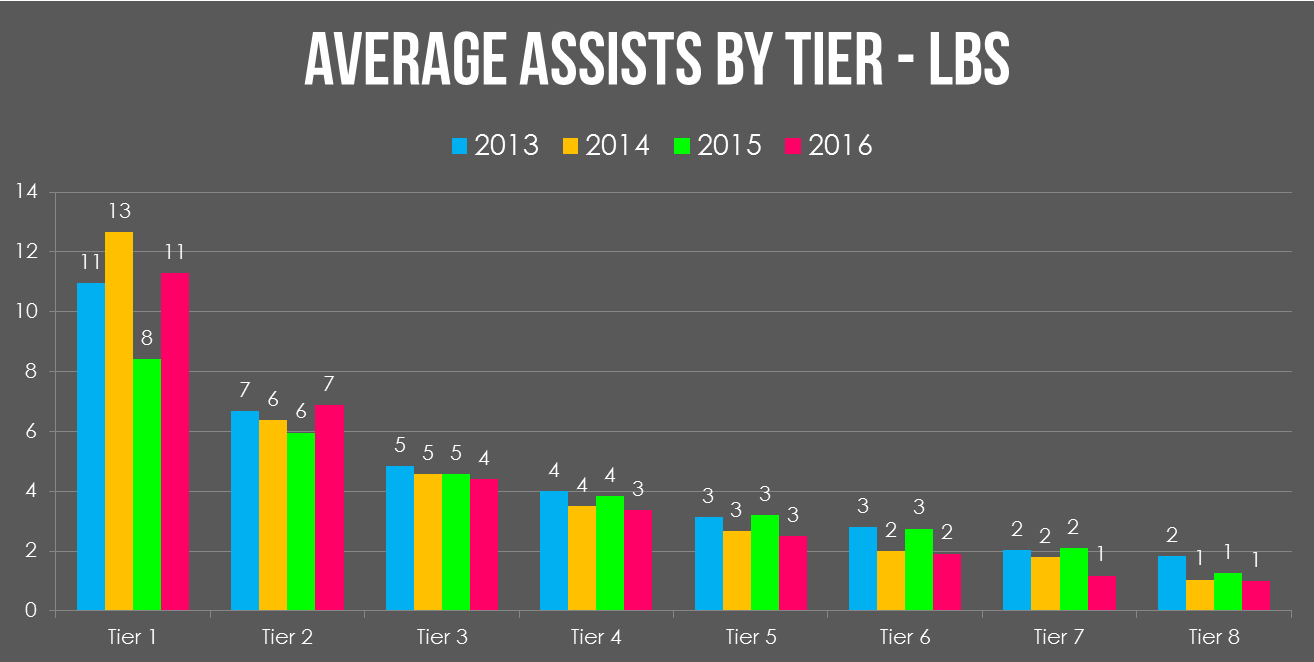
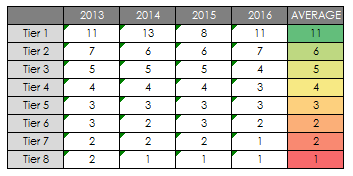
I included this here for those that play in big-play leagues. It’s important to note that as above the players are different. An LB1 for sacks would record double digit sacks but obviously NOT also put up 90+ solo tackles.
The number I’m looking for here is eight and a half sacks. That should be enough to get you into the top tier.
Cornerback
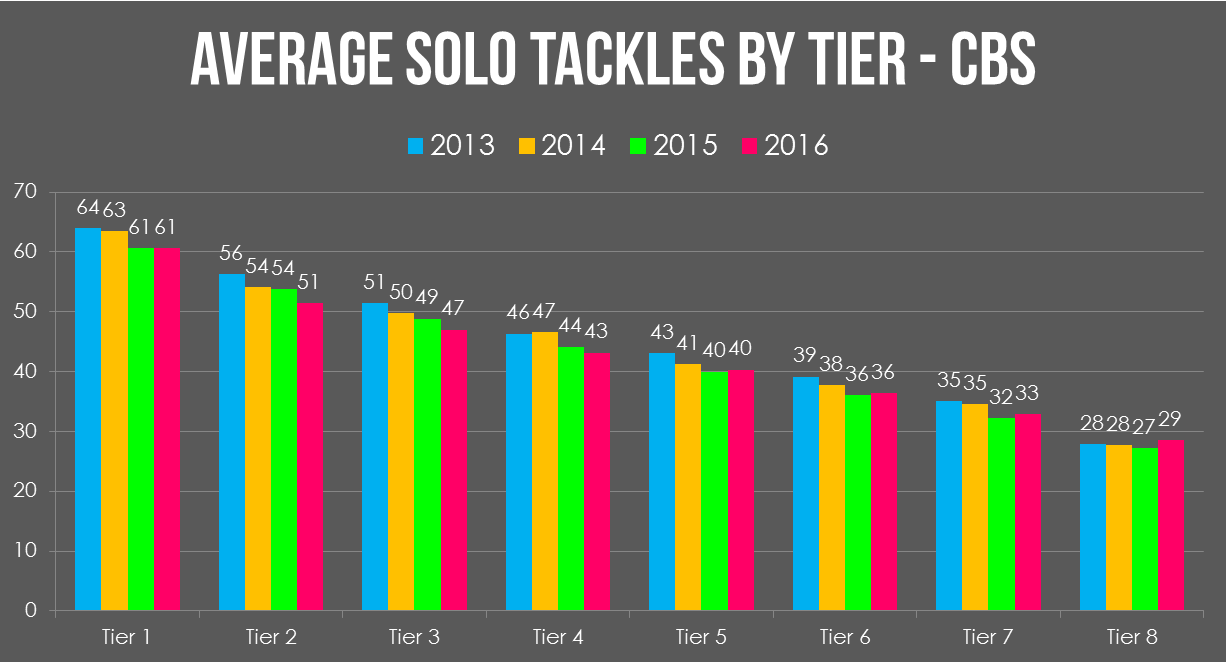
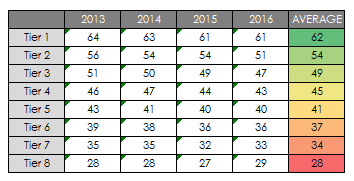
The benchmark here is around 60 solos. I thought this was high compared to what I had in my mind. It’s only two solos per week fewer than what we’d expect a LB1 to achieve after all.
This position is also noteworthy in being even flatter than LB, for solos at least. All CB1s, CB2s and CB3s record around three-four solos per week. With CB4s and CB5s not far behind. As all IDP players know it’s simply very easy to find corners who put up tackle numbers.
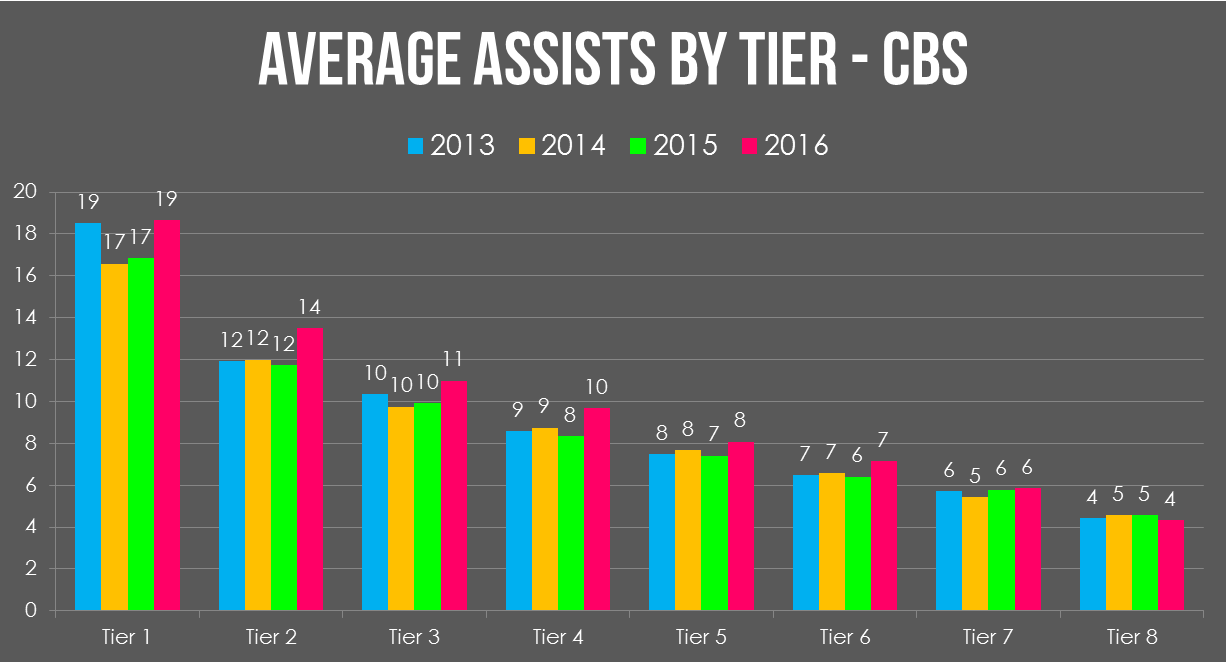
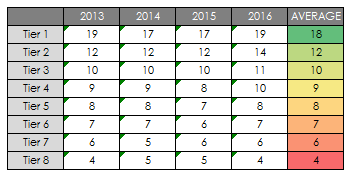
Well this is insignificant isn’t it? And really what did you expect? By the very nature of the position corners aren’t in a position to get involved with gang-tackling very often. If a corner manages one assist every week he’s doing pretty darn well. If he manages one every other game it’s not really a problem. This is not the stat you’re looking for,
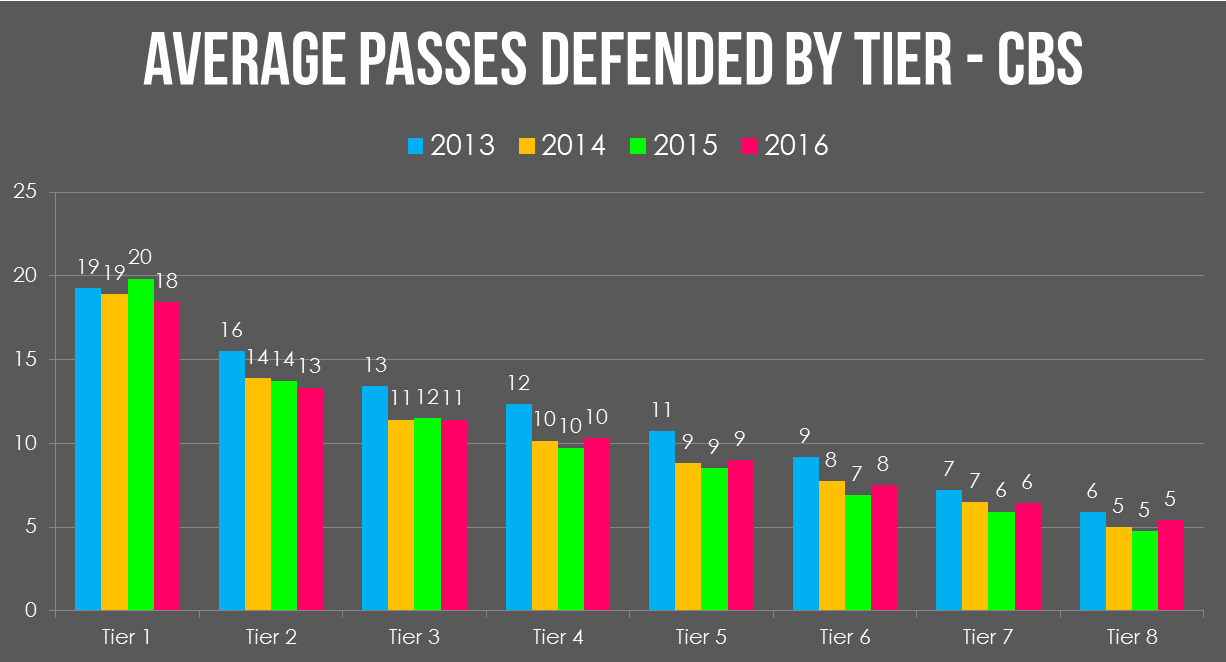
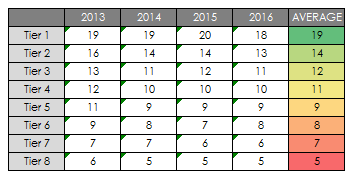
Here you can see strikingly similar figures to the stat above but these are far more telling. Defended passes are drive-altering plays and should be rewarded as such. This is really where an elite NFL corner shows his worth statistically and you should be awarding them good points. As above if a corner manages to bat one pass down per game they’re doing fantastically. If they can do it consistently then they’re very likely one of the better players at their position.
Safety
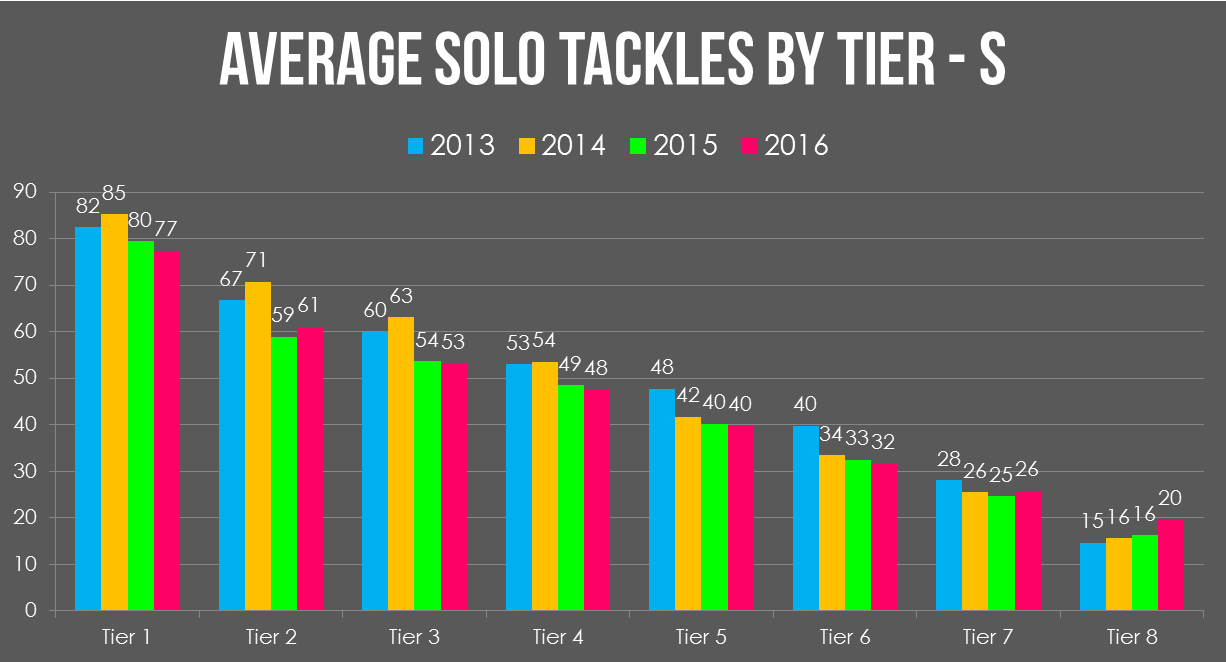
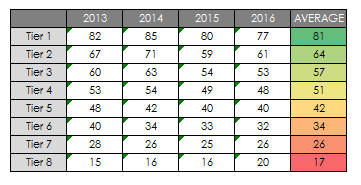
It’s often said that the lines between defensive positions are blurring and this shows it. A top-tier safety should be expected to ut up numbers similar to those of a top-tier LB now. I want 80 or more solos from my top safeties compared to 90 or more from the ‘backers. In each of the past four seasons a safety has managed to record 100+ solo tackles. This is becoming the new norm.
There also appears to be an elite tier here. Second-tier safeties record a full solo per week less but it flattens off from there. This is because only eight-twelve NFL teams employ a true box-safety. Many use ones who rotate deep coverages or also spend plenty of time in the slot or guarding TEs. The game is full of players who could play box safety but finding the ones who actually do it is an advantage.
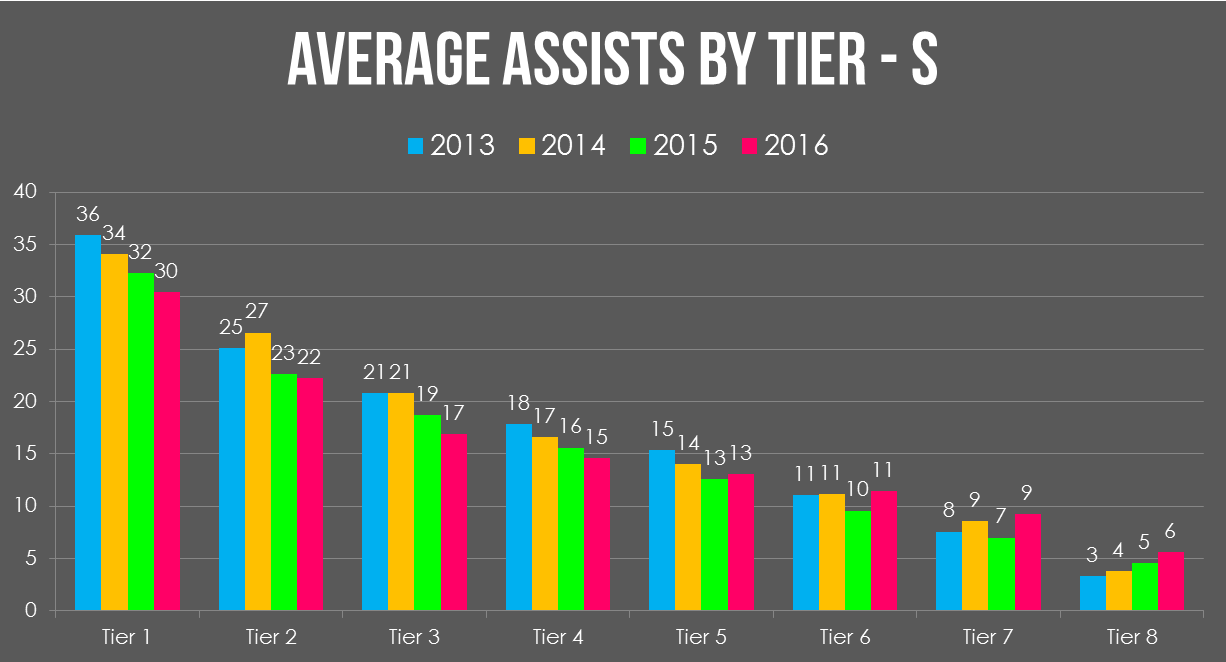
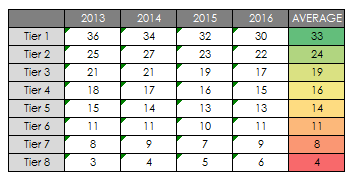
This is a huge drop-off. A top-tier safety is recording around 40% the number of assist that he does solo tackles. For similar reasons to corners. All defensive backs are in more space by definition so joining gang tackles happens way less.
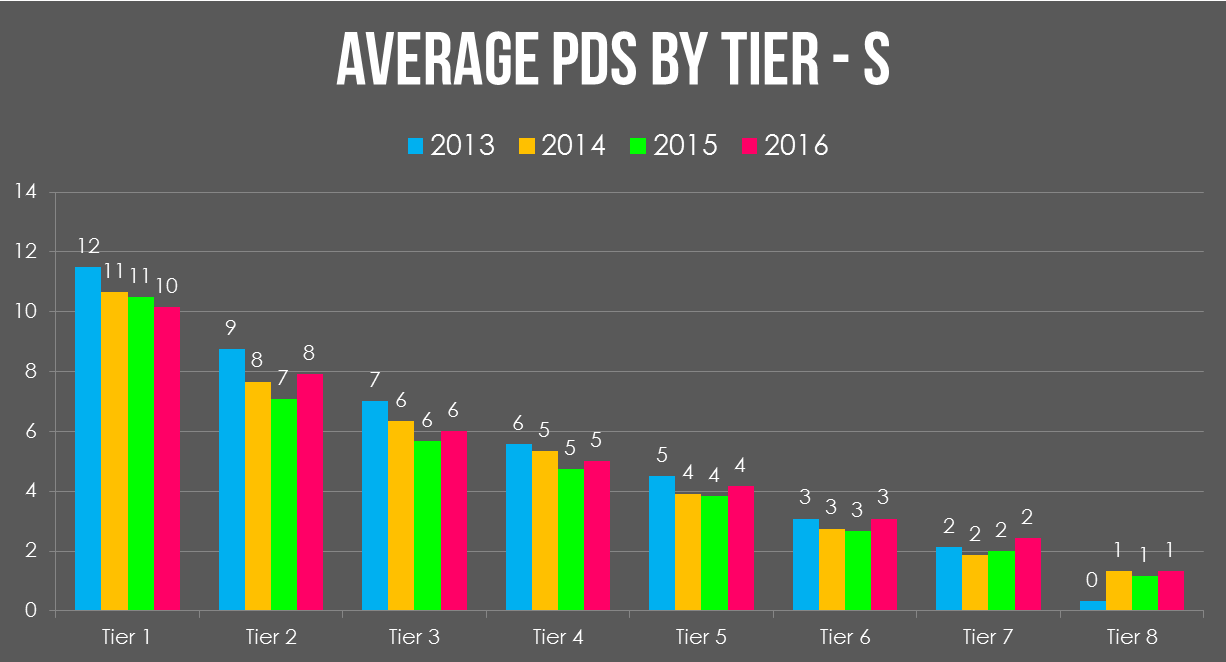
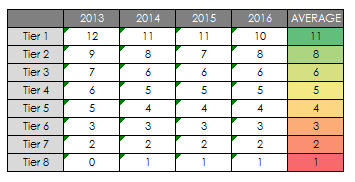
This is a very low number. Many IDP players will tell you that deep safeties are useful because of the number of coverage plays they make. It’s just not true. The best safeties in the league might record a PD in ten weeks of a season. Maybe if they’re lucky they’ll even manage four or five interceptions. This is really hard to predict so you’re almost always better off trusting in tackle-heavy safeties instead.
That was a lot of numbers in a big wall of text and graphs. So here’s a handy, print-out-and-keep set of tables to show you what you really want by tier:

So now, instead of simply relying on bland statements you can really start to predict how good “good” actually is. Going a step further and checking real production against players would be even better (some players considered very good at LB and safety in particular do not put up good numbers), but that’ a conversation for another day.
I hope that’s been useful. As always my aim is to bring real understanding of how IDP actually works in a bid to catch up with the more established and advanced offensive side of things. Good luck with putting your teams together as we head into the season.
[/am4show]
- Ten IDP Fantasy Football Stats You Need to Know after Week 16 - December 29, 2023
- Ten IDP Fantasy Football Stats You Need to Know after Week 15 - December 22, 2023
- Ten IDP Fantasy Football Stats You Need to Know after Week 14 - December 14, 2023


