Steve’s Rushing Study: Assessing Good Backs Behind Bad Lines, Part One
Welcome to the first installment of my rushing study on DLF. You can find my introduction, explanation, and numerical breakdown of the series here. In this two-parter, we’ll be looking at running backs that the community generally deem to be talented that run behind poor offensive lines. Todd Gurley and Melvin Gordon will serve as the central focuses and lead into a greater conversation about the constraints that a poor blocking unit can place on any back.
Todd Gurley, RB LAR
Gurley has been the poster boy for the good player-bad line confusion. In a destitute offensive situation exacerbated by poor coaching, Gurley drowned in 2016–he finished the season running at an impressively-terrible clip of 3.2 yards per carry. Despite a strikingly bad season of production, his dynasty value has hardly taken a hit. The implied reasoning behind that (lack of a) trend is that the heinous production was caused by his surroundings.
However, the data I’ve collected strongly disagrees with this sentiment. Why? Simply, he didn’t create at all:
[am4show have=’g1;’ guest_error=’sub_message’ user_error=’sub_message’ ]
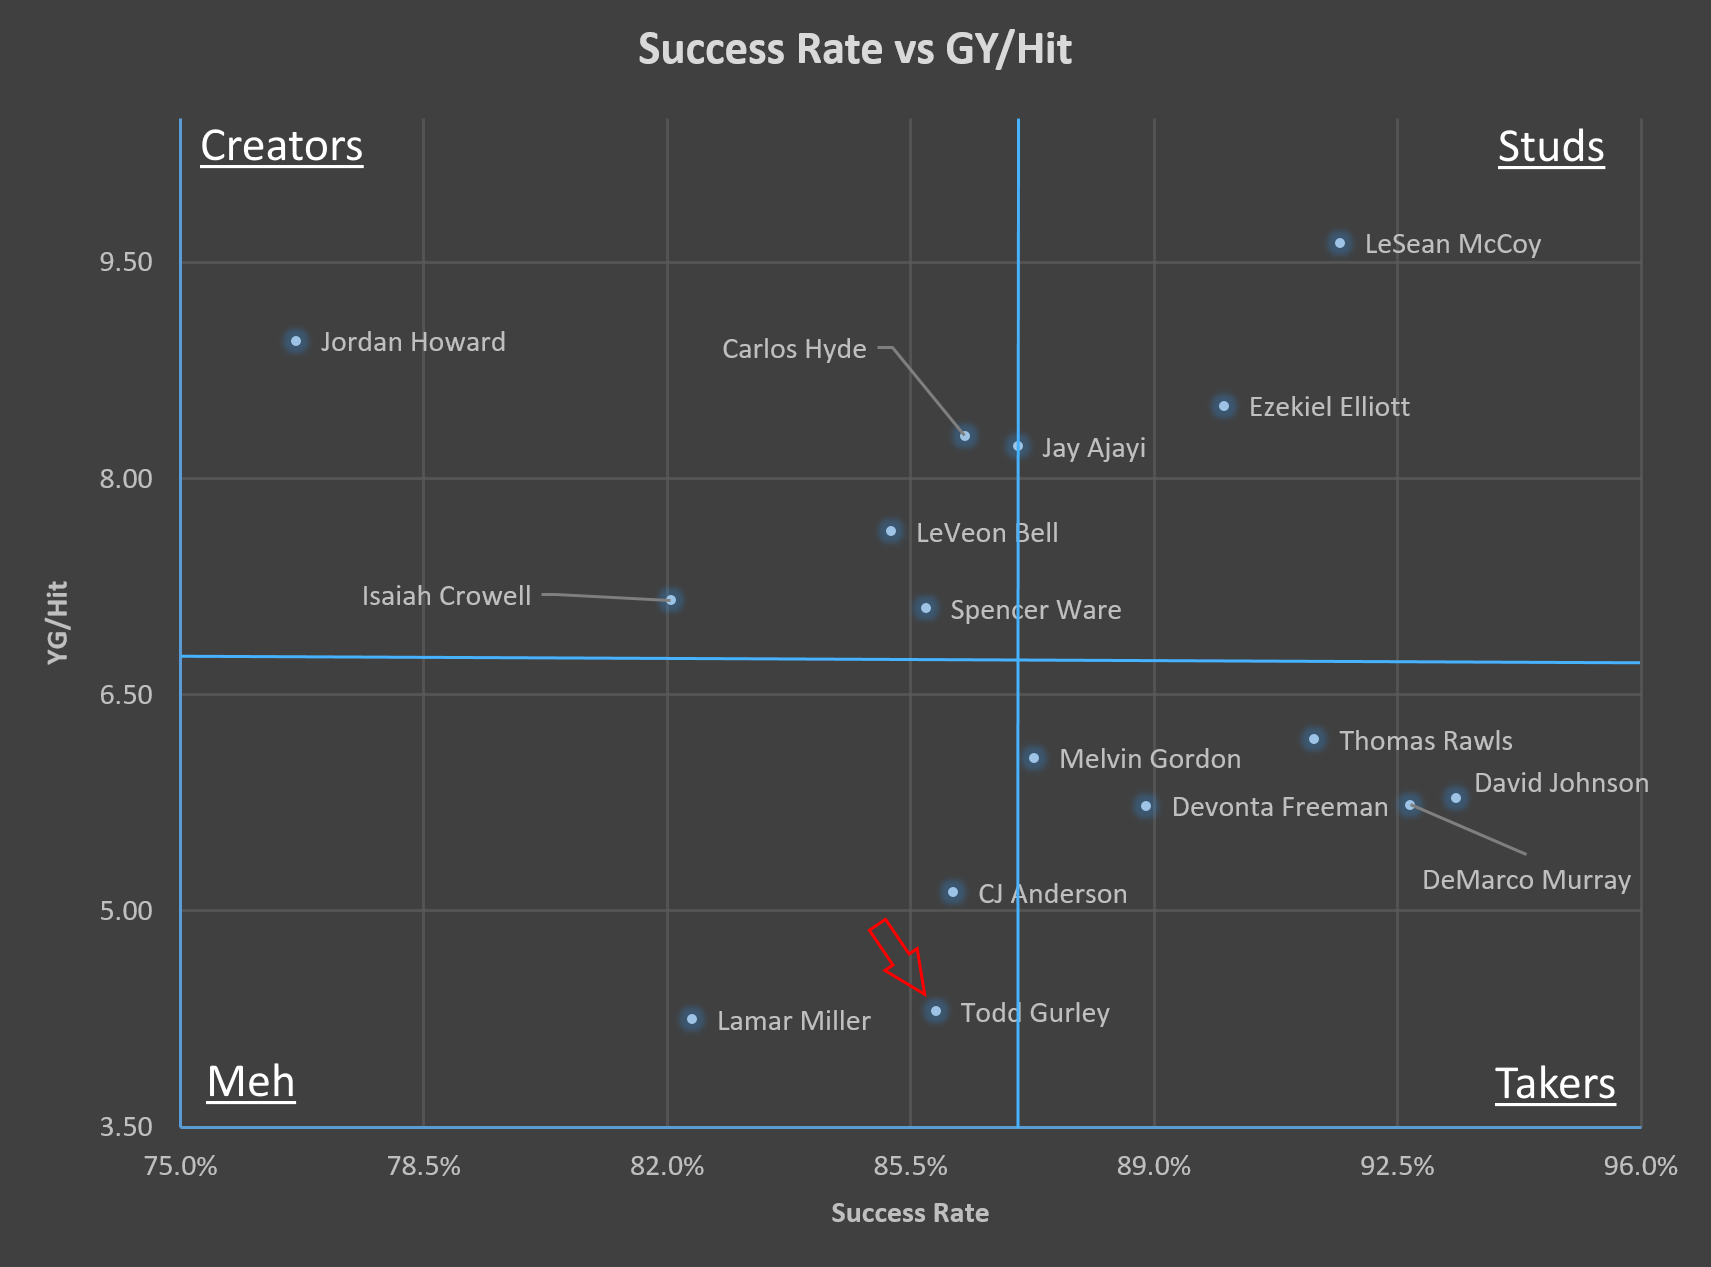
The plot above shows each back’s success rate (ability to hit a hole) plotted against his Generated Yards Per Hole Hit (creativity and explosiveness). Among each back sampled, only Lamar Miller could approach (let alone, exceed) Gurley’s lack of creativity and explosiveness. Over his first 14 of 16 games, Gurley could only generate 4.3 yards for each hole he hit. For reference, Ezekiel Elliott, Jordan Howard, and LeSean McCoy doubled that mark.
When we look at fully-sampled backs, Gurley distances himself from the pack even more:
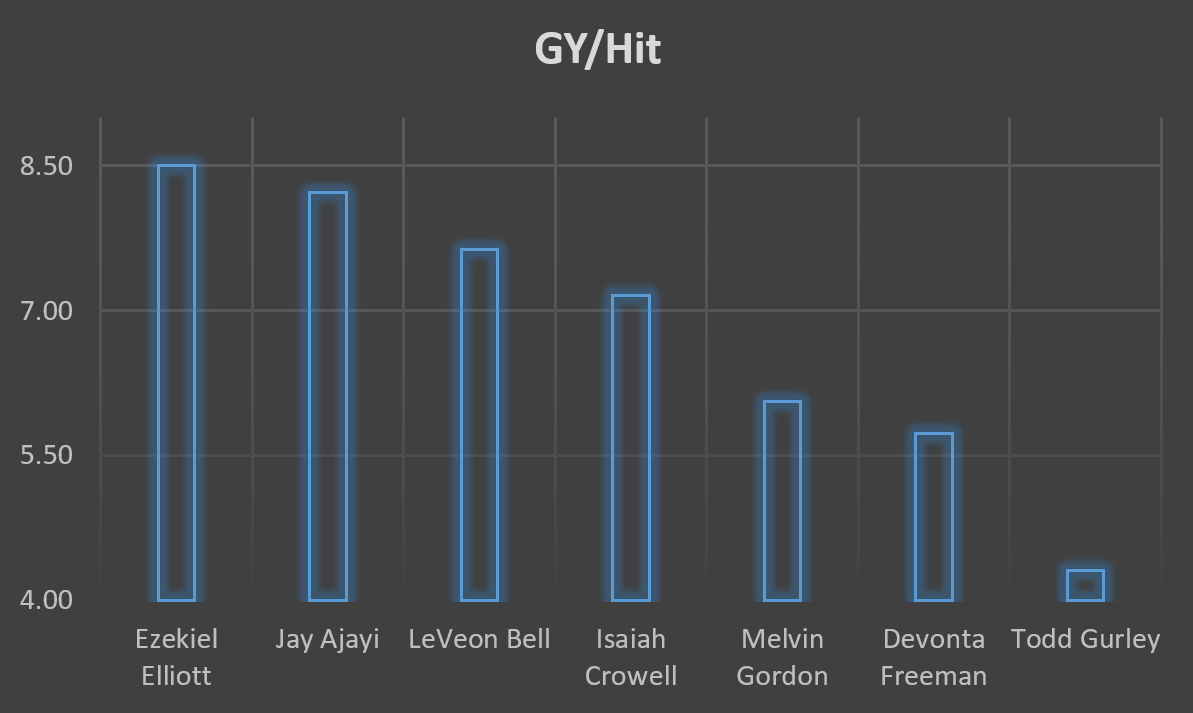
Gurley’s abysmal Generated Yards Per Hole Hit mark was an entire standard deviation away from second-worst Devonta Freeman. For the non-mathematically-inclined, that’s really bad.
Why didn’t he generate more yards? Well, there are a few ways to answer this question. As I explained in a past article, creativity comes in many shapes and forms. Look at how many different running attributes go into the GY/Hit metric:
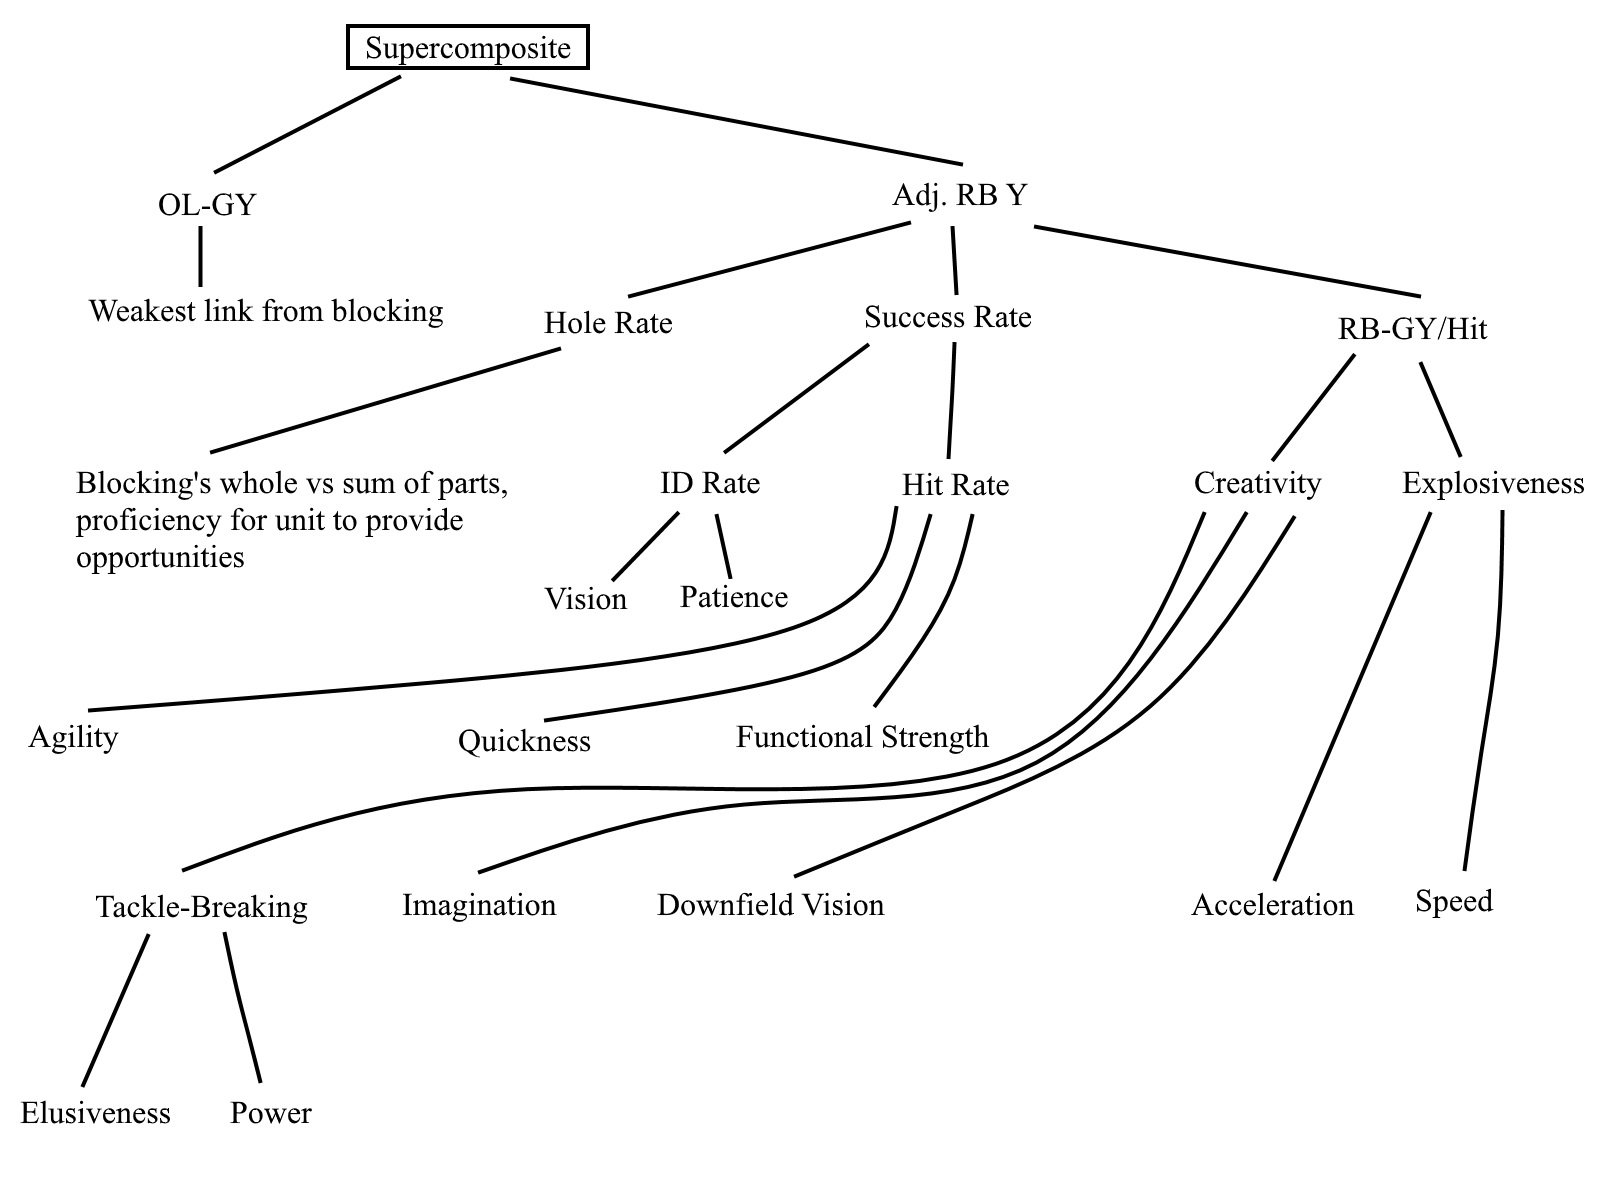
In a few words, you could say he was collectively poor at the traits toward the bottom of the diagram. My current set of observational statistics have few ways to quantify those specific traits, but I do have a statistic for tackle breaking, which can help a lot when explaining the poor creation.
My Broken Tackles Per Hole Hit (which, obviously, represents the number of tackles a back breaks for every time he’s found daylight) has a pretty strong relation with GY/Hole Hit; the R-squared coefficient between the two measures comes in at .58. As you can see, Gurley (at the very end) had a very difficult time breaking tackles:
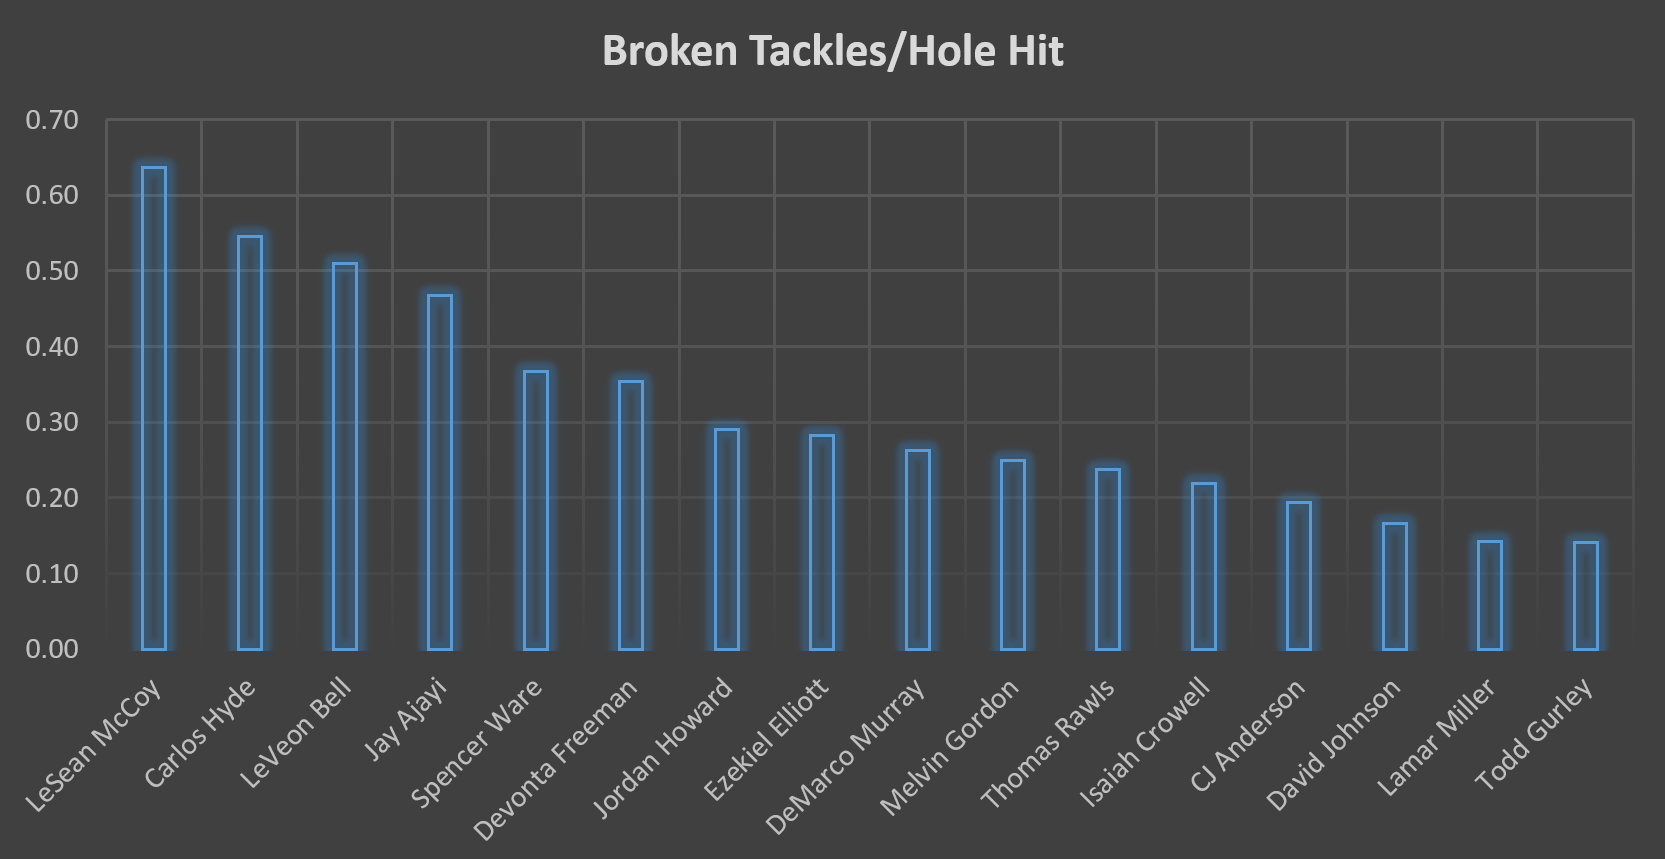
It’s a tall task to create yardage when you can’t break tackles… and Gurley could hardly shake anyone.
Gurley’s other open-field issue was one simply of athleticism. His speed and acceleration appeared rather ordinary across most of his carries, preventing him from adding explosiveness to his touches. It’s hard to keep GY/Hit numbers up without breaking tackles, but it becomes impossible to do so if there are no big plays to buoy a greater collection of small gains. Of his 245 carries that I have play-by-play data of, Gurley generated ten or more yards… four times. None of those contributions reached past the teens. That won’t cut it. His just-fine success rate (85.9%) essentially made him good enough to take what his offensive line gave him, but that was it.
Of course, that line was far from blameless itself. Let’s look at how that unit gra-oh my goodness that’s bad:
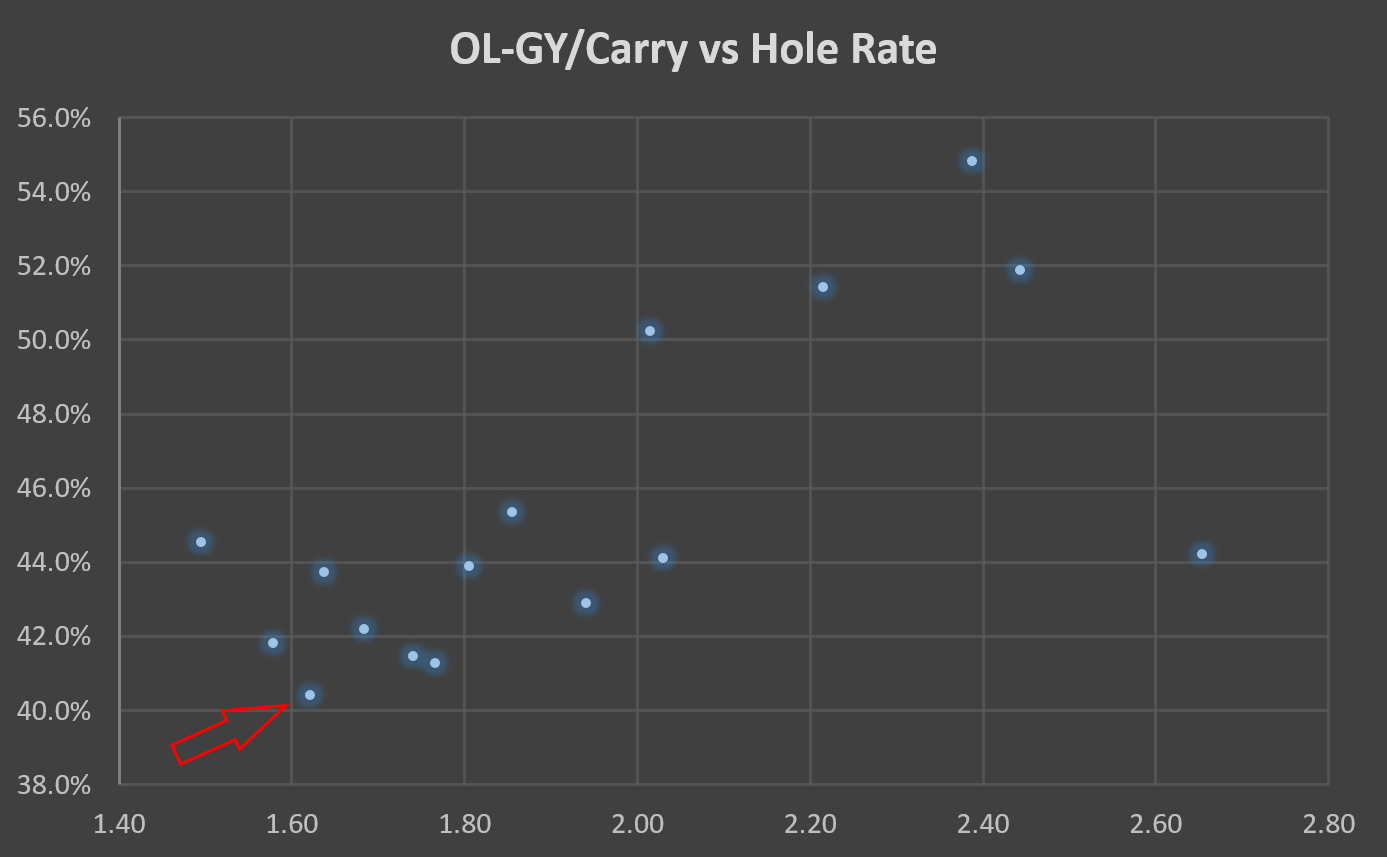
As you can see, the Rams offensive line was one of the worst in terms of OL-Generated Yards Per Carry (a baseline of yards for the back to carry) and boasted the very worst Hole Rate (how often the entire unit creates opportunities). They also graded out dead-last in my OL Composite statistic, which simply combines those two measures with equal weight. This unit was terrible.
Was there anything good about last season, then? Well, it could’ve been a bit worse. He was alright at reaching holes, posting a Success Rate that wasn’t very far below average. If he were legitimately bad, we could’ve seen the rare beautiful disaster that is 278 carries going for under three yards a pop.
Otherwise, the only good spin you could put on the season is that it’s probably impossible for those carries to be that unproductive again. The passing game can hardly get worse, and that in itself could mean more rushing production with defenses unable to sell out to stop the run on as many plays. Furthermore, I’d expect further improvement from a coaching change, as Sean McVay should at least instill a modern offense in Los Angeles. Most importantly, though, the arrows are pointing up for both rushing units.
The offensive line sees plenty of continuity, essential for blocking success, heading into 2017 as the only leaving contributors are Greg Robinson (not one of the better second overall picks in NFL history) and Tim Barnes (a former UDFA who inked a one year, $800,000 contract with San Francisco). Meanwhile, the Rams have brought in a small transfusion of talent that can be used to replace those two in Andrew Whitworth (solid, but old) and John Sullivan (who I know nothing about). Whitworth’s best days are behind him, but he should provide much steadier play than Robinson, at the very least. Sullivan is replacing a center who currently sits third on the 49ers’ depth chart. The bar for improvement is incredibly low.
From what I researched on Gurley in 2016, he didn’t look to be hobbled by injury very much, so health-based progression shouldn’t be expected. However, he’s a former first-round pick who rushed for 4.8 yards per carry as a rookie entering just his third season; there’s plenty of room to positively regress to the mean and genuinely improve even if he doesn’t tap all of his potential.
Of course, rushing production after progression from both sides could still be quite bad. The flipside to “lots of room for improvement” is that there’s a lot of room to make up. By my estimates, with moderate progression from the offensive line, Gurley would have to approach average (a tougher task than it sounds when considering where he ranked in 2016 and how good running backs are these days) at both Success Rate and Generated Yards Per Hole Hit in order to just get to four flat yards per carry.
In summary, Todd Gurley did run well in 2016 and when combining that performance with a terrible set of blockers, the running game suffocated. There are positive and negative ways to look at the future. On the bright side, there’s loads of room to improve if solely through regression to the mean, let alone through on-paper improvement to the offensive line. The bleaker outlook is that blocking will still probably be subpar, meaning the onus falls on Gurley to provide effective rushing production. Given his previous campaign, I’m not as optimistic about this happening as most are.
Check back in tomorrow for part two.
[/am4show]
- 2024 Dynasty Fantasy Football Rookie Drafts: A View from the 1.03 - April 21, 2024
- Devy Fantasy Football: Top Five Quarterbacks - August 22, 2022
- 2022 Dynasty Fantasy Football Rookie Prospect: Drake London, WR USC - April 16, 2022


