Do Bad NFL Teams Make Good IDPs?
One of the things I love dearly about IDP fantasy football is the sense of being a frontiersman. Because it’s still a relatively small and new niche, there’s plenty of things to learn. Sometimes that means new metrics and figuring out how stats can be predicted, but sometimes it’s much simpler – sometimes it’s simply a matter of working out if what we already “know” is right or wrong.
Sometime over the last couple of months I was working on my 2017 IDP projections, and looking at the Jets in particular. As it became apparent that they are very likely looking at a lost year to cleanse the roster and start afresh (again), I was wondering whether I should upweight my estimates for their IDP production in 2017, because one of the things we all know about IDP is that players on bad teams score more IDP points. I then started to question of that really was true – or whether it was one of those things we assume but never really test. This article is an account of how I started to test the premise.
The logic goes something like this: bad NFL teams can’t stop the opposition and therefore their defense is on the field longer as they get marched up and down the field failing to make stops on crucial downs. This increases the tackle opportunities for the bad team as a whole, and the share of that for each IDP on said bad teams. This seems fairly logical to me. After all, the base unit of IDP is the tackle rather than the stop. If my IDP records a tackle a yard past the first down line, then it scores just as much as a tackle that kills a drive on third down.
Long drives are brilliant for IDPs because they result in more IDP scoring. Big plays are bad because they don’t result in any defensive stats. A pass from the opposition’s 1 yard line that goes 99 yards for a TD results in a total IDP score of zero points. It’s much better for them to make 15 different six or seven yard plays where a tackle is recorded every time. So clearly there is a slightly wonky relationship between just being a bad defense (in NFL terms) and scoring lots of IDP points. They might match up sometimes but not perfectly.
Before we can test the theory, we need to define our terms. What makes a team bad in NFL terms? For me there are two obvious starting points; how many games do they win and how many points do they concede.
Wins are historically established now and so we can use them as a yardstick fairly easily, but the problem is total wins are a granular figure and can be misleading. Many teams manage to win a few more or fewer games than their quality indicates. The Dolphins in 2016 for example went 8-2 in games decided by seven or fewer points. Their final record was 10-6 but they could easily have been 6-10. Wins is a good indicator of team quality, but flawed too.
Points against are a better metric because they’re more granular. There’s much less chance involved in how many points your team concedes over a season than just how many games you lose. It’s still not perfect, because points can also be misleading. For example points scored by defensive returns or special teams against would be included, and just because a team conceded special teams plays does not mean it’s a bad defense. Remember the Chargers a few years ago finished best in the league in points conceded but failed to make the playoffs?
In the end, I decided both metrics are valid so I should examine them both. Having established both wins and points conceded are valid, how can we judge against them? My first instinct was to keep it simple and look at tackles but it proved a little misleading, because the various positions and schemes generate tackles at different rates the data was skewed. For example, Washington defensive linemen tend not to register tackles whilst those on a tackle-heavy team like the Giants score far more. Clearly that can messy the waters.
In the end, I went back to the source, and simply looked at snaps. Snaps and all other defensive metrics correlate after all, so we can see how IDPs fare simply by checking if volume increases as team’s quality reduces.
Let’s start looking at the data shall we? Here’s how team wins correlate against snap counts for all IDPs over the last four full seasons (incidentally four seasons is 400 players, 1,024 games and almost 300,000 cumulative snaps):
[am4show have=’g1;’ guest_error=’sub_message’ user_error=’sub_message’ ]
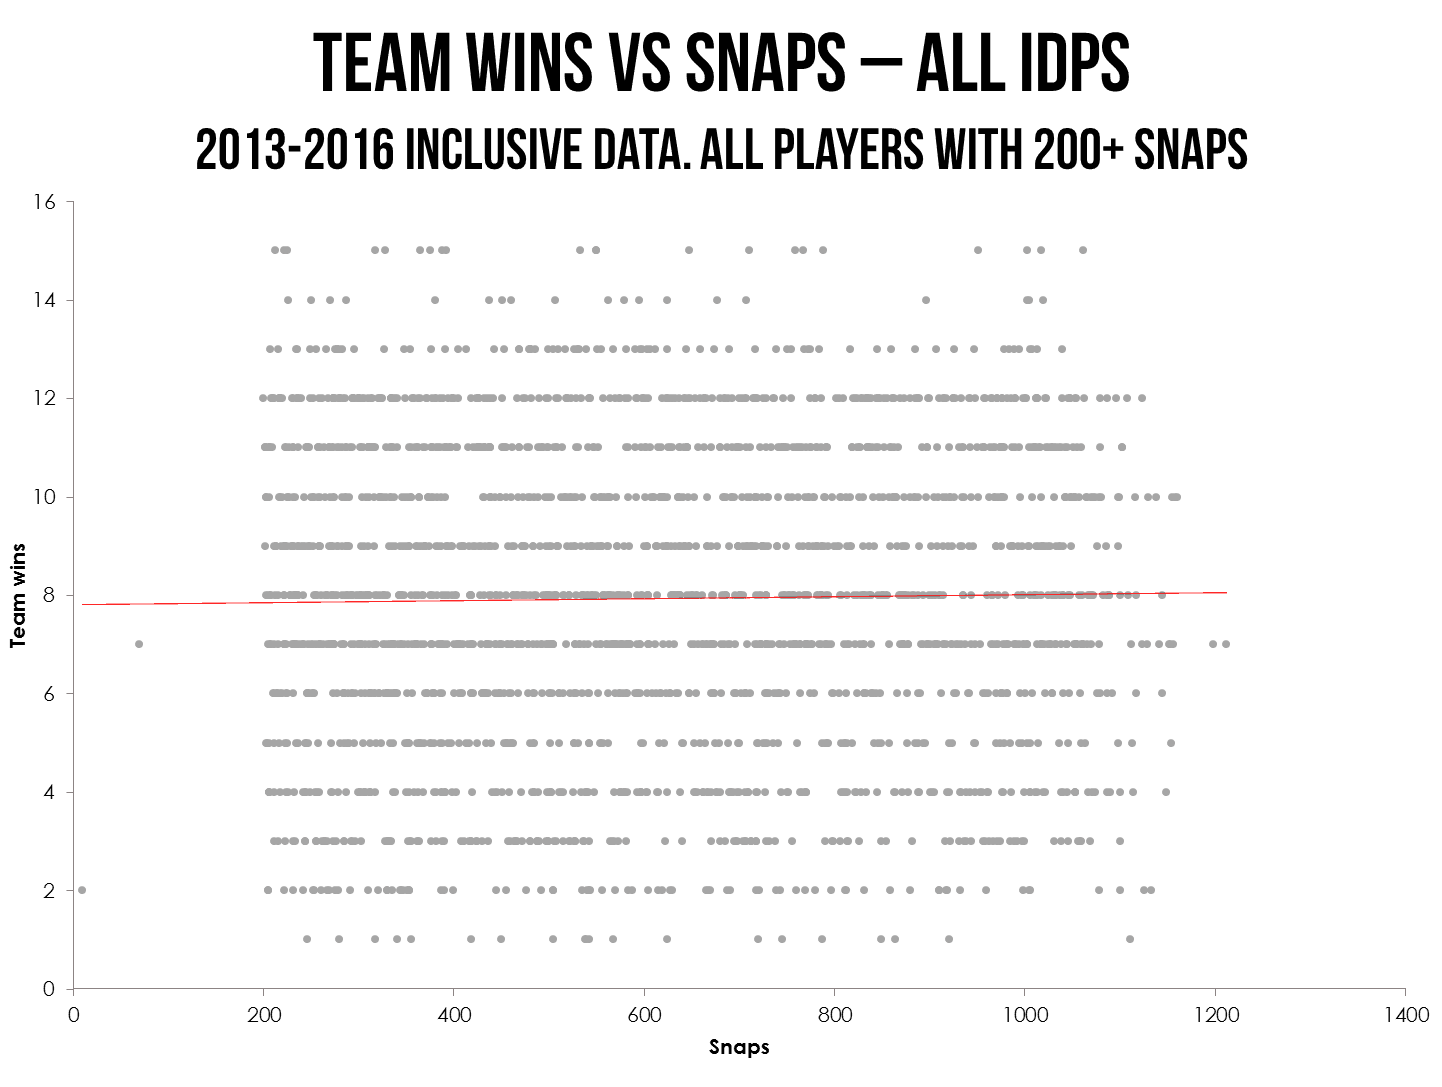
As you can see there’s a very slight positive correlation here. Broadly speaking the more games won by a team the more snaps he plays, but it’s a very slight gradient so it’s certainly inconclusive. Nevertheless, this was very surprising. <y hypothesis, after all, was the other way around – that teams with fewer wins play more snaps. This is not clear enough to draw conclusions though, so I started looking at it by position.
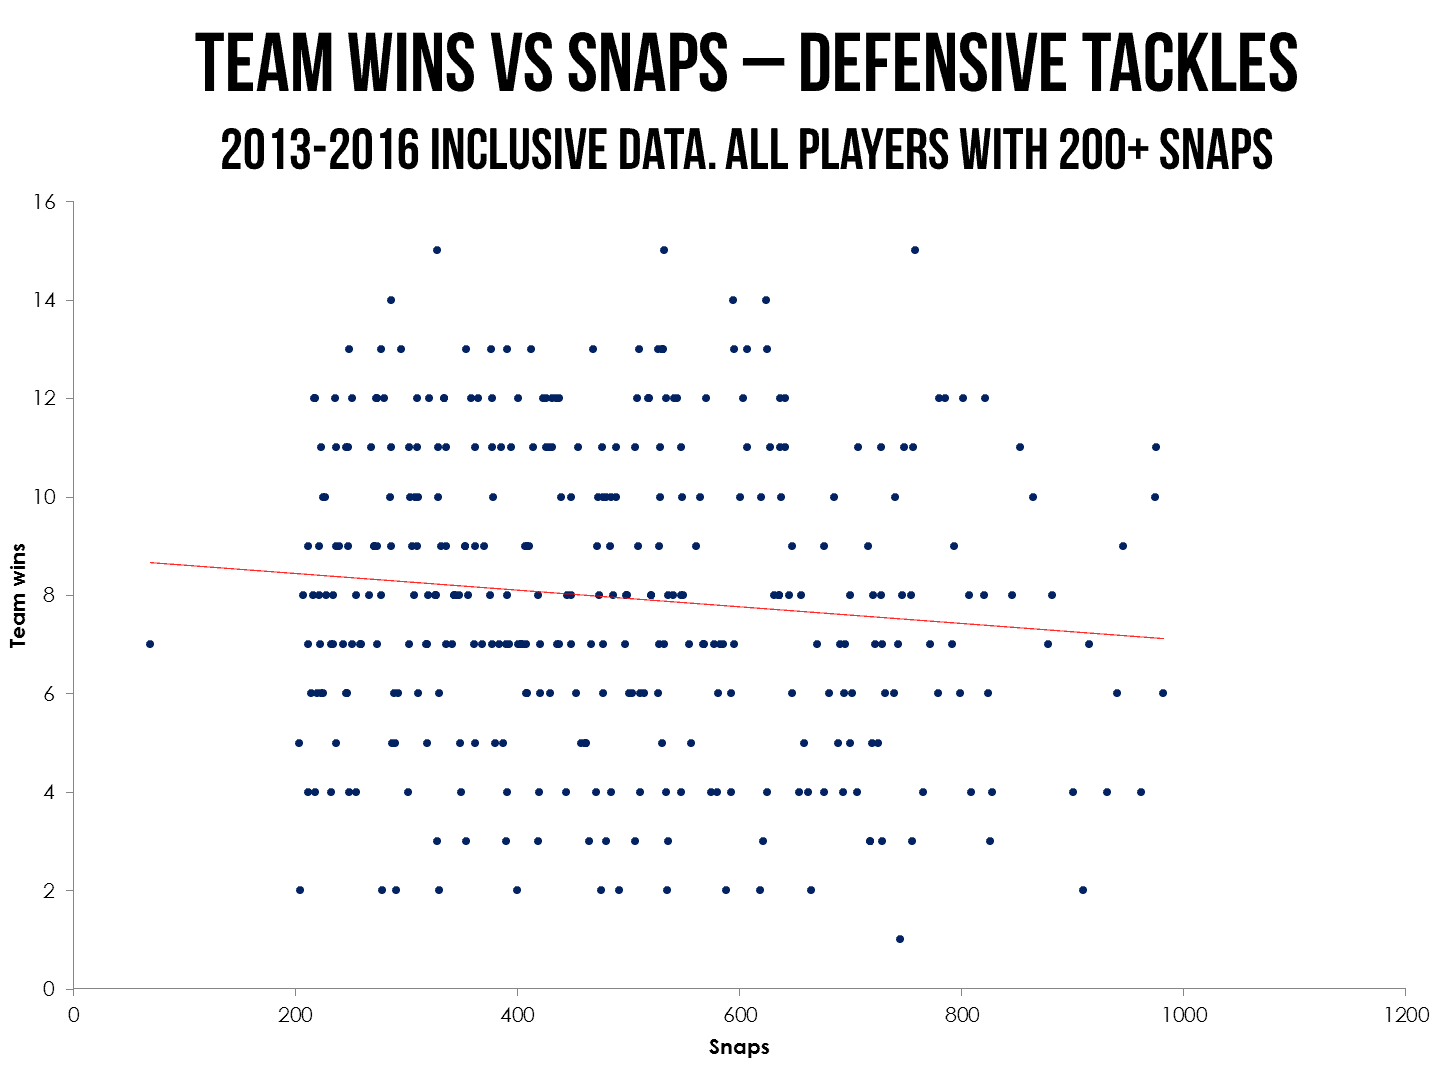
Here the gradient is flipped. We see a negative correlation, which is what we expected. The reason is slightly confusing here -teams who win more games spend more time ahead on the scoreboard, which means the opposition throws the ball more as they need to catch up. This means that ‘good’ teams are often playing in sub packages and tackles are left on the sideline a bit more. On the other hand, ‘bad’ teams are often behind which means the opposition is running the ball on them. This is why Danny Shelton played 750 snaps last season and Malcolm Brown only played 595.
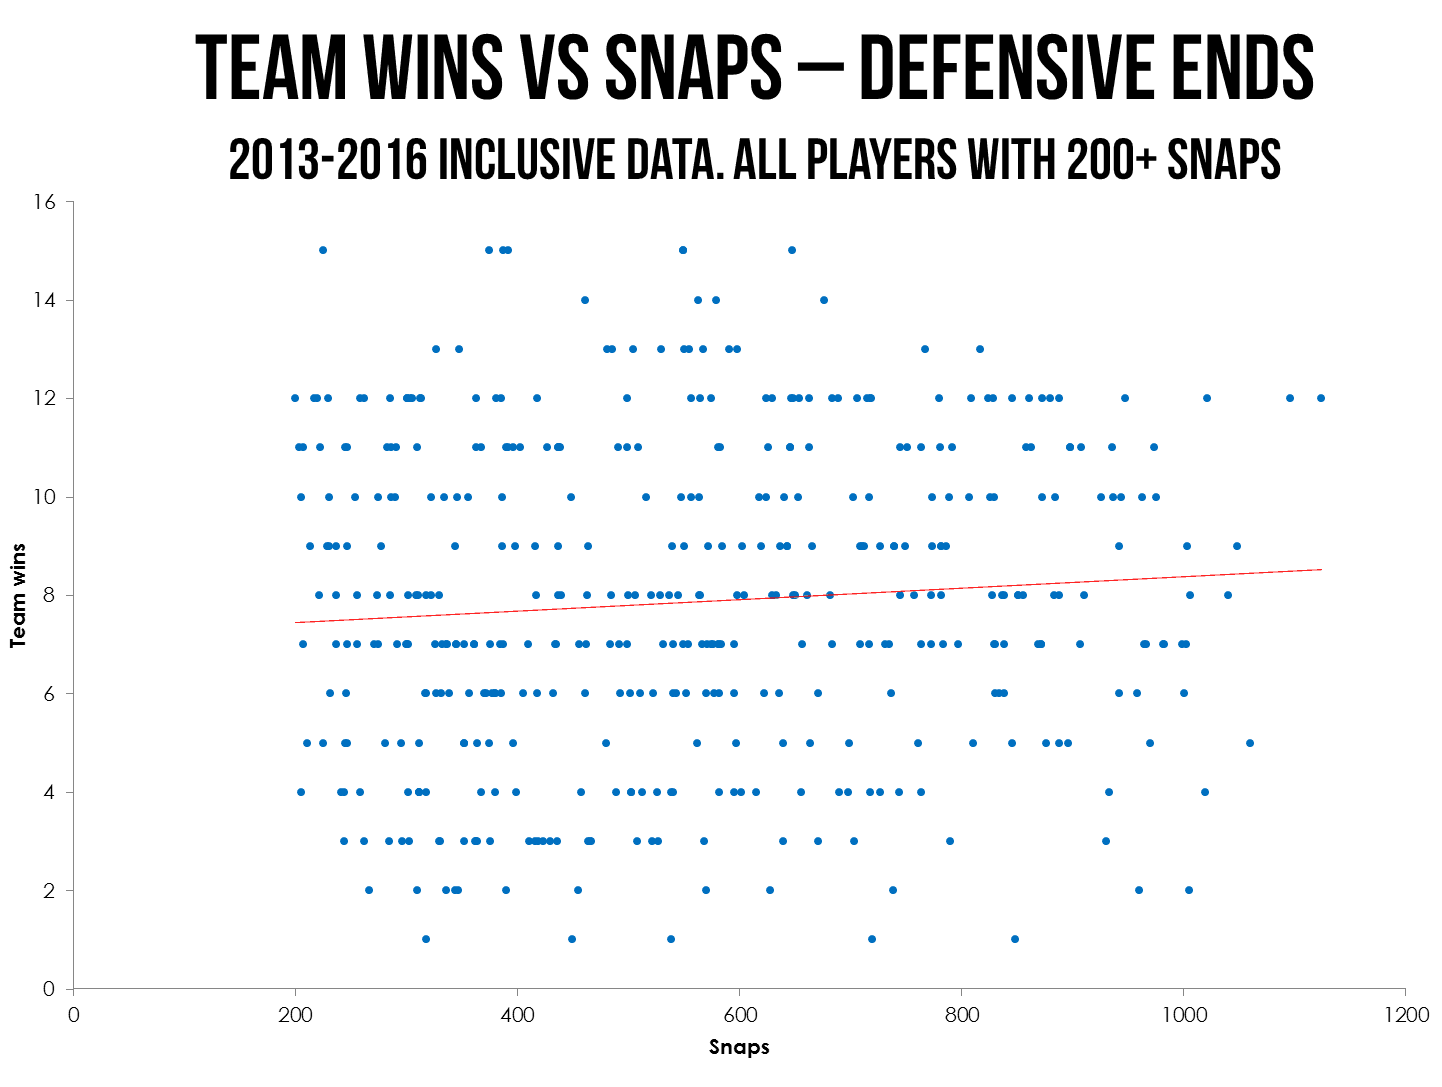
Hmmm. As we look at defensive ends, the correlation flips again. The more games a team wins the more snaps DEs play. This is explained by the reverse of the point above. Better teams are generally facing the pass more – so their pass rushing ends see more playing time.
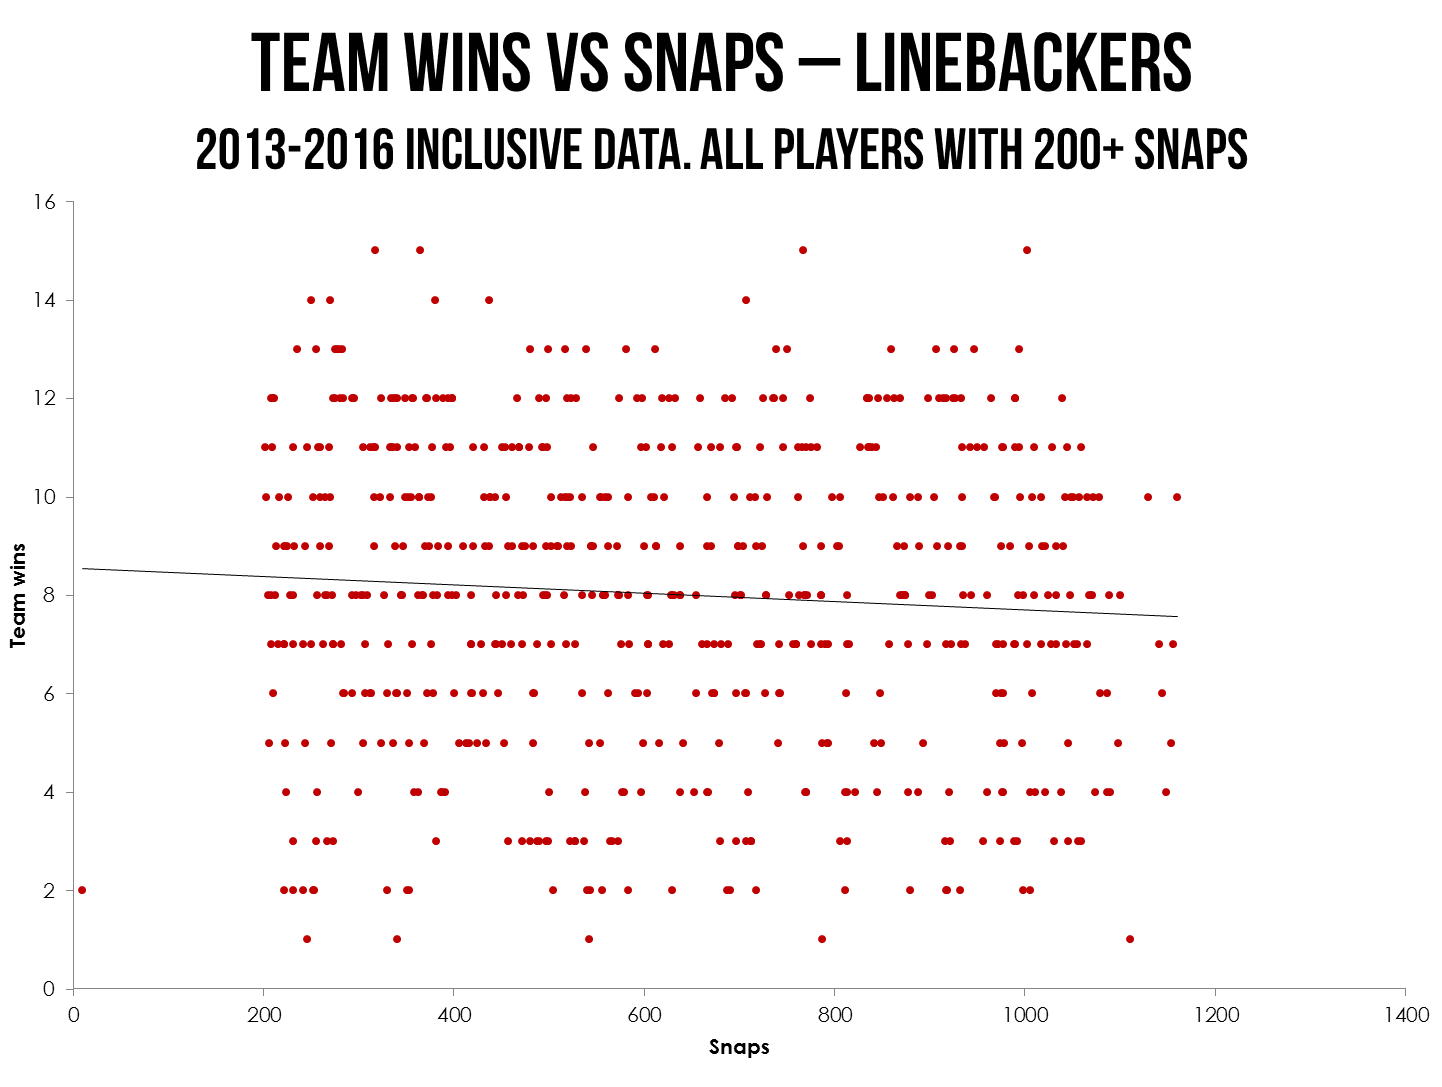
There’s another negative correlation, this time due to personnel reasons. The better teams’ defenses are in sub packages more and therefore have fewer linebackers on the field. It’s not that individual players see less time on good teams – it’s that they often have more defensive backs on the field.
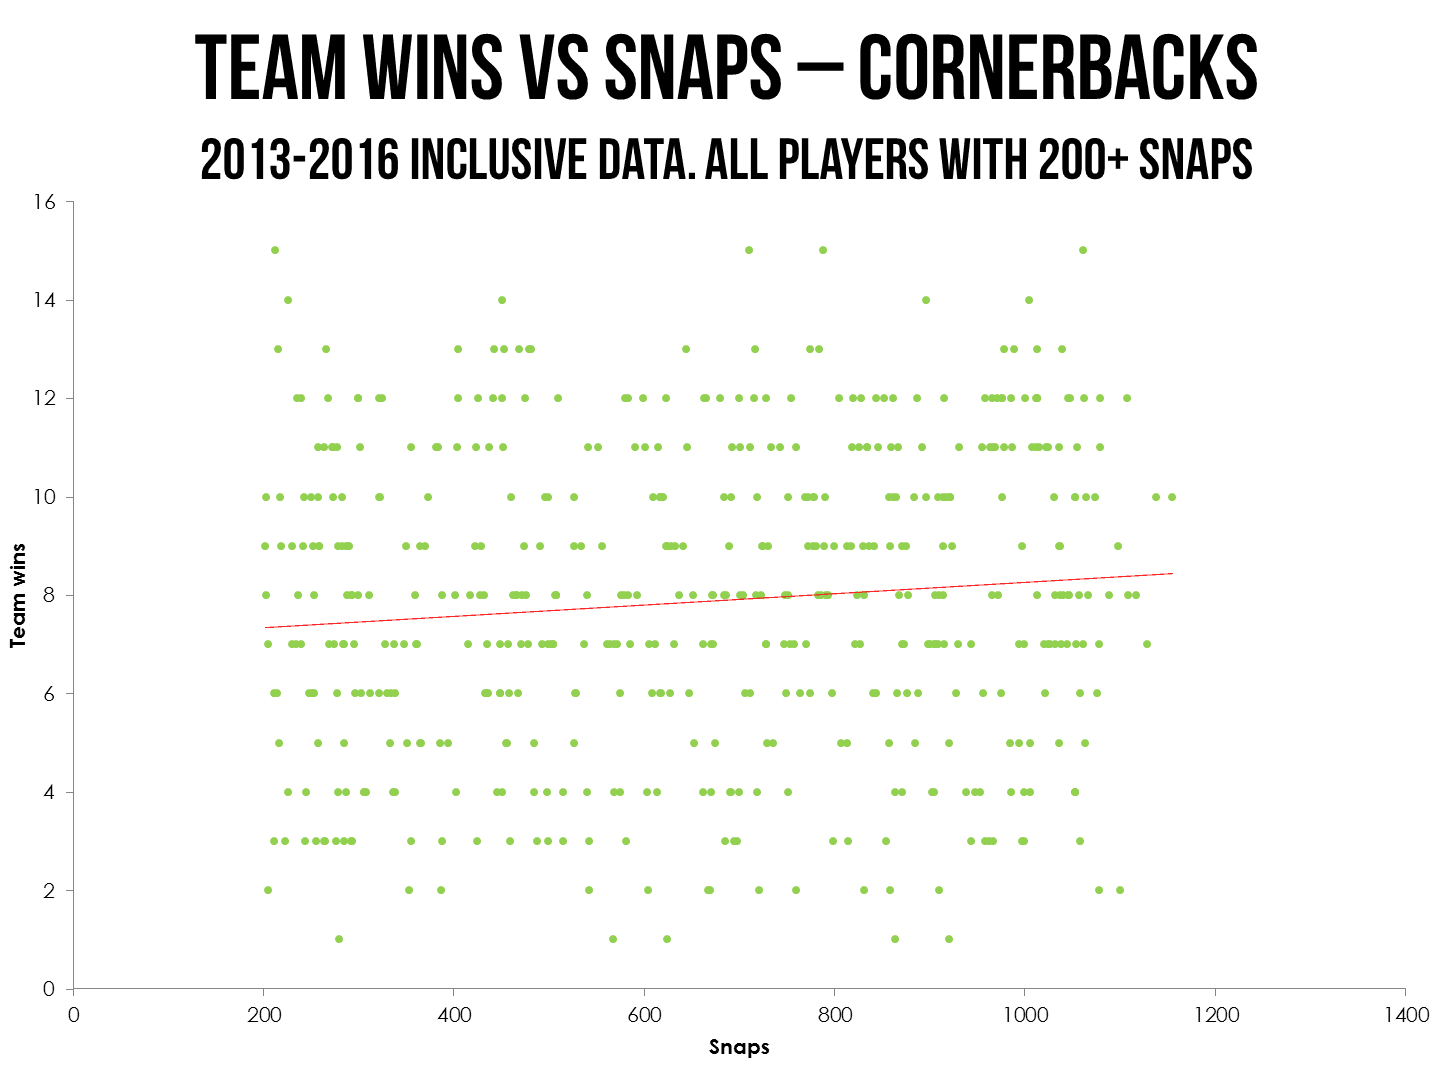
This ties in perfectly with the chart above. As good teams are in sub packages more they often replace linebackers on the field with corners. So contrary to our hypothesis corners on bad teams play fewer snaps because they’re so often facing teams who are running to slow the ball down.
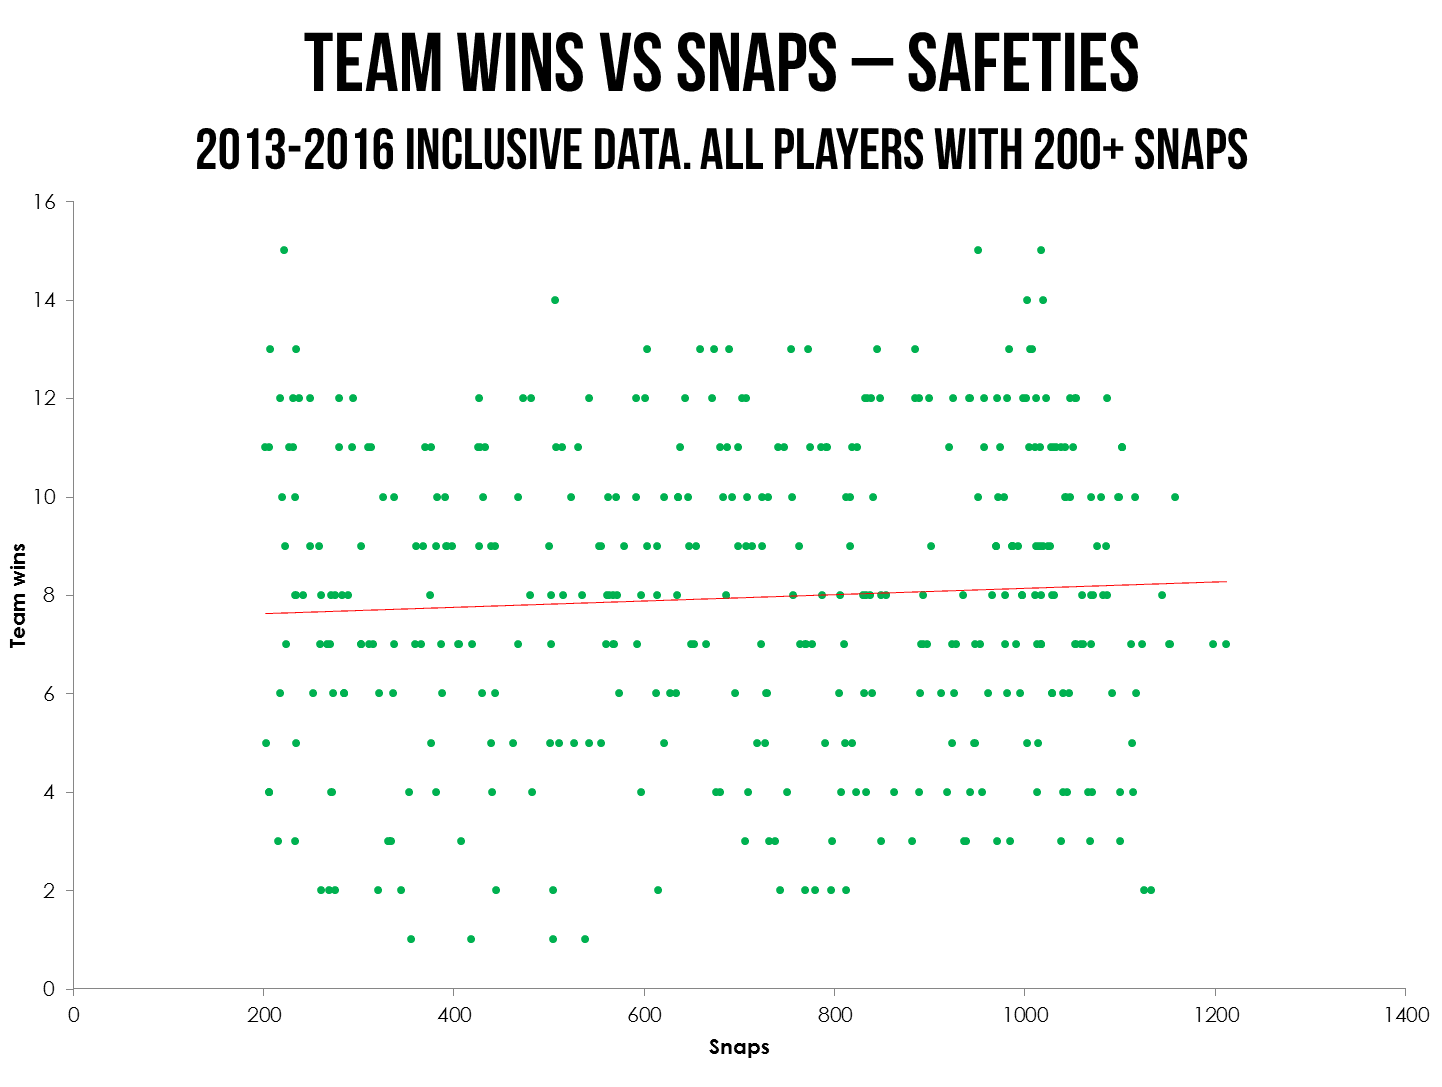
This is very similar to the above. This just shows the additional use of nickel and dime packages on better teams. Again, the Patriots are a good example. Their base has been a 4-2-5 for years because opposing teams are always desperate to catch up quickly.
So we’ve seen that it’s not as simple as the theory goes. Some positions play more or less depending on games won. But it’s not conclusive. I looked at points conceded instead of games won.
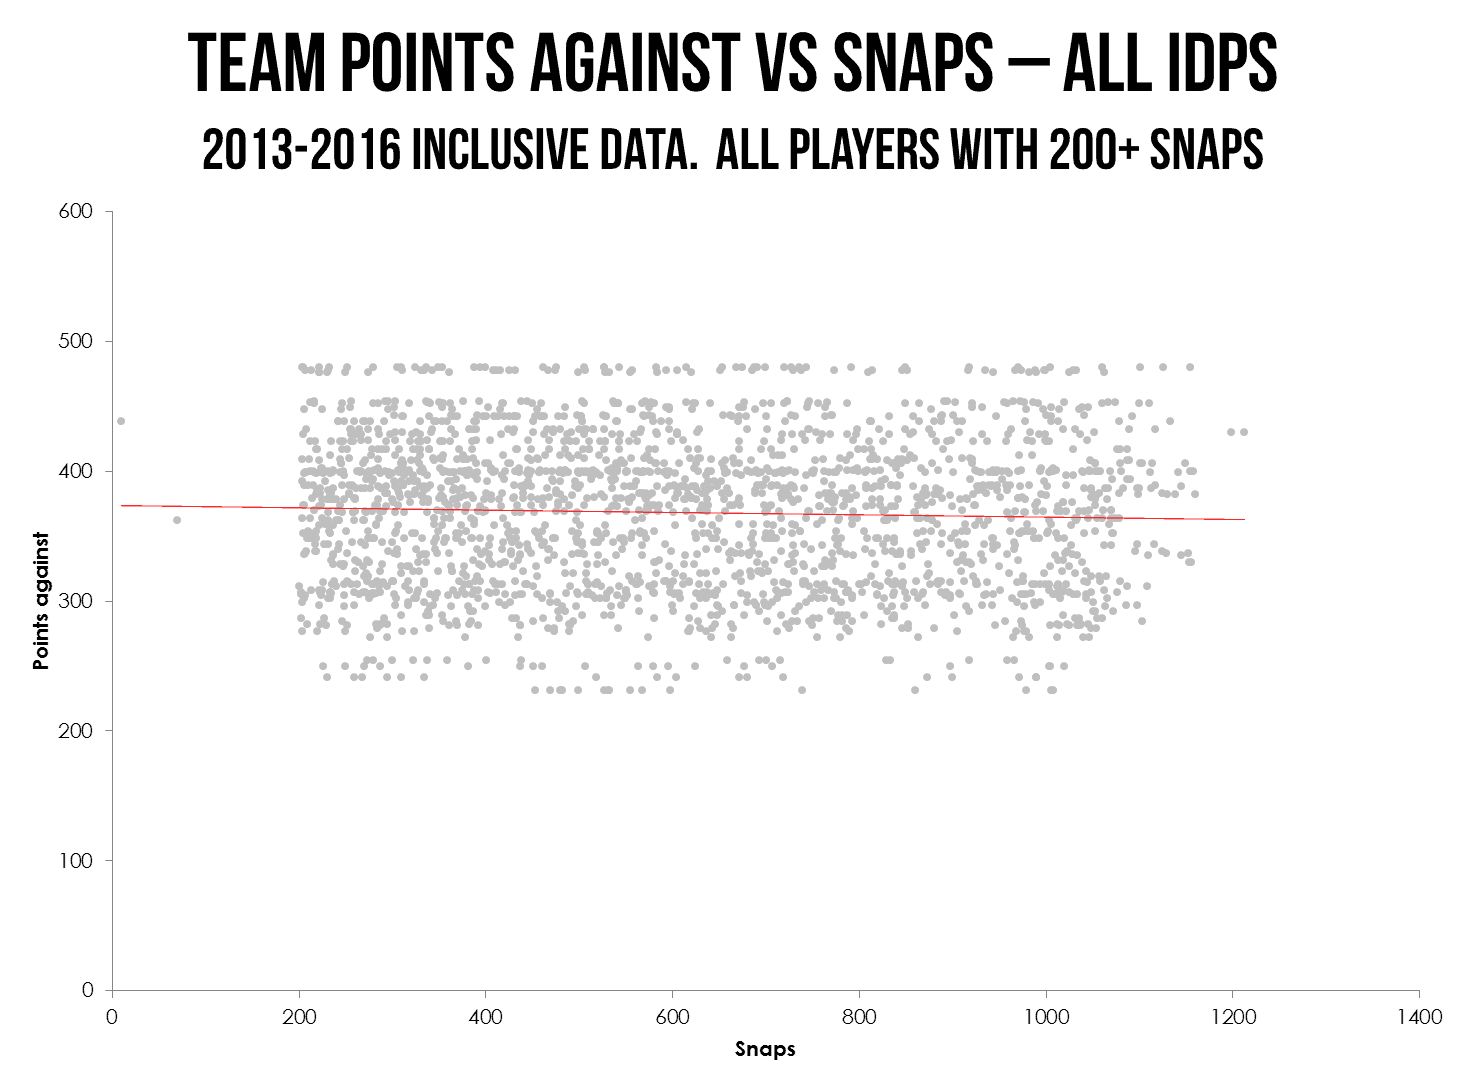
This correlation goes the other way around, but it backs up what we saw earlier. The more points a team concedes (i.e. the worse they are as an NFL team) the fewer snaps their IDPs play. It’s not a big correlation but it seems true in principle.
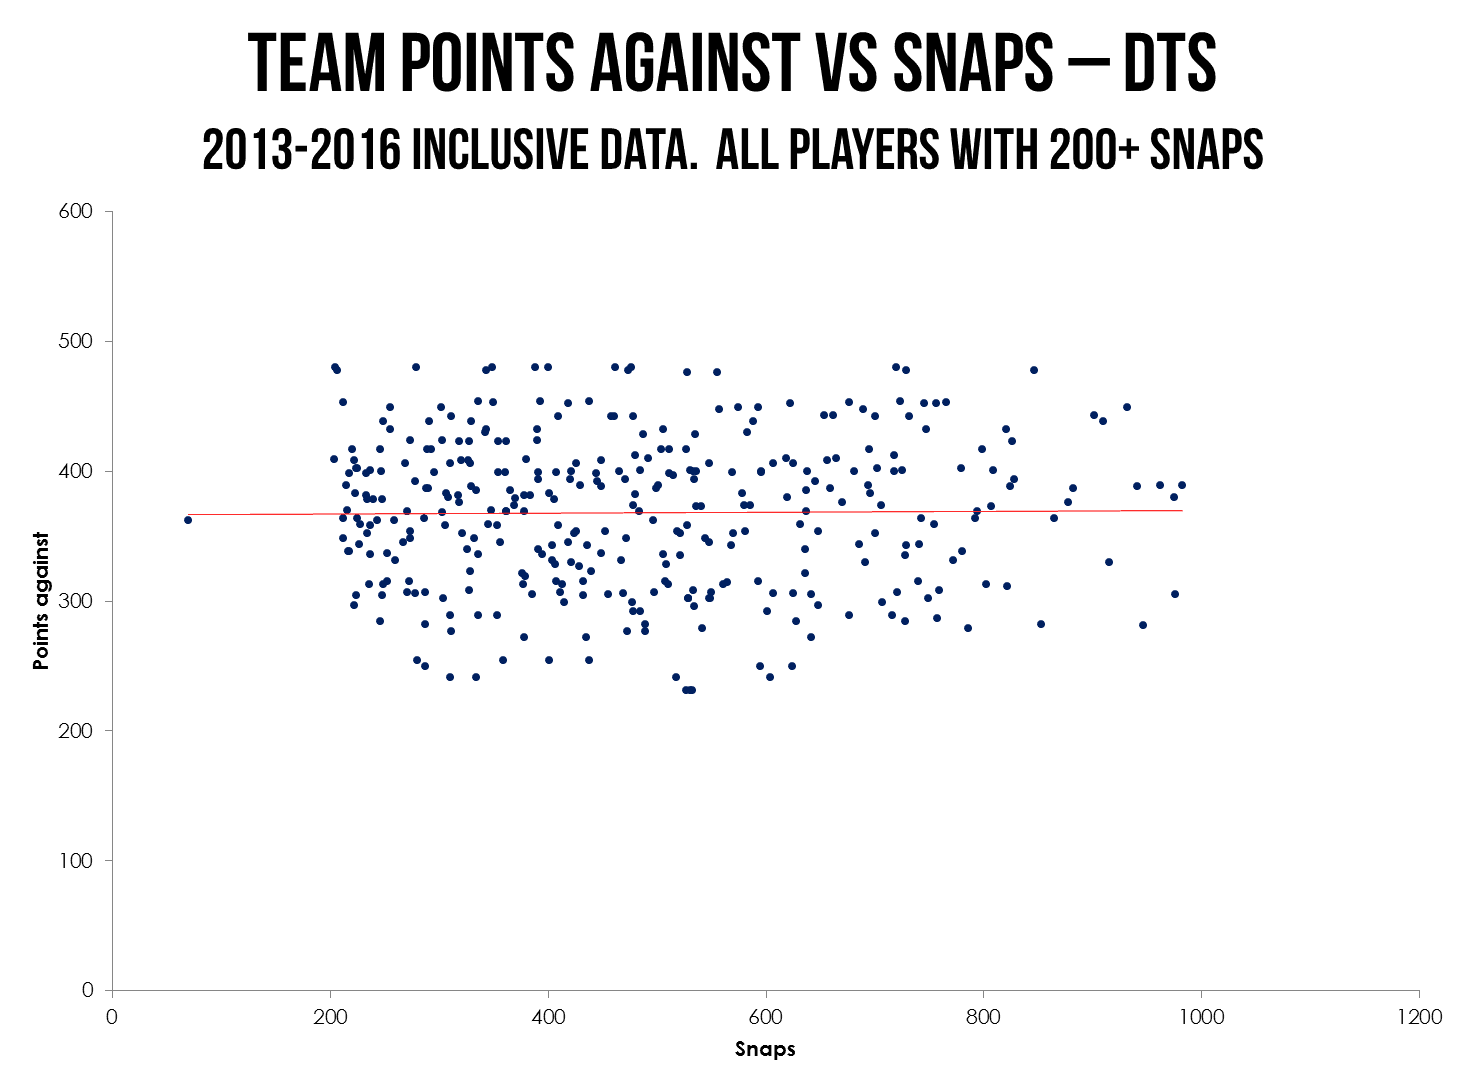
This is virtually flat. When looking at points against tackles, snap counts do not appreciably change.
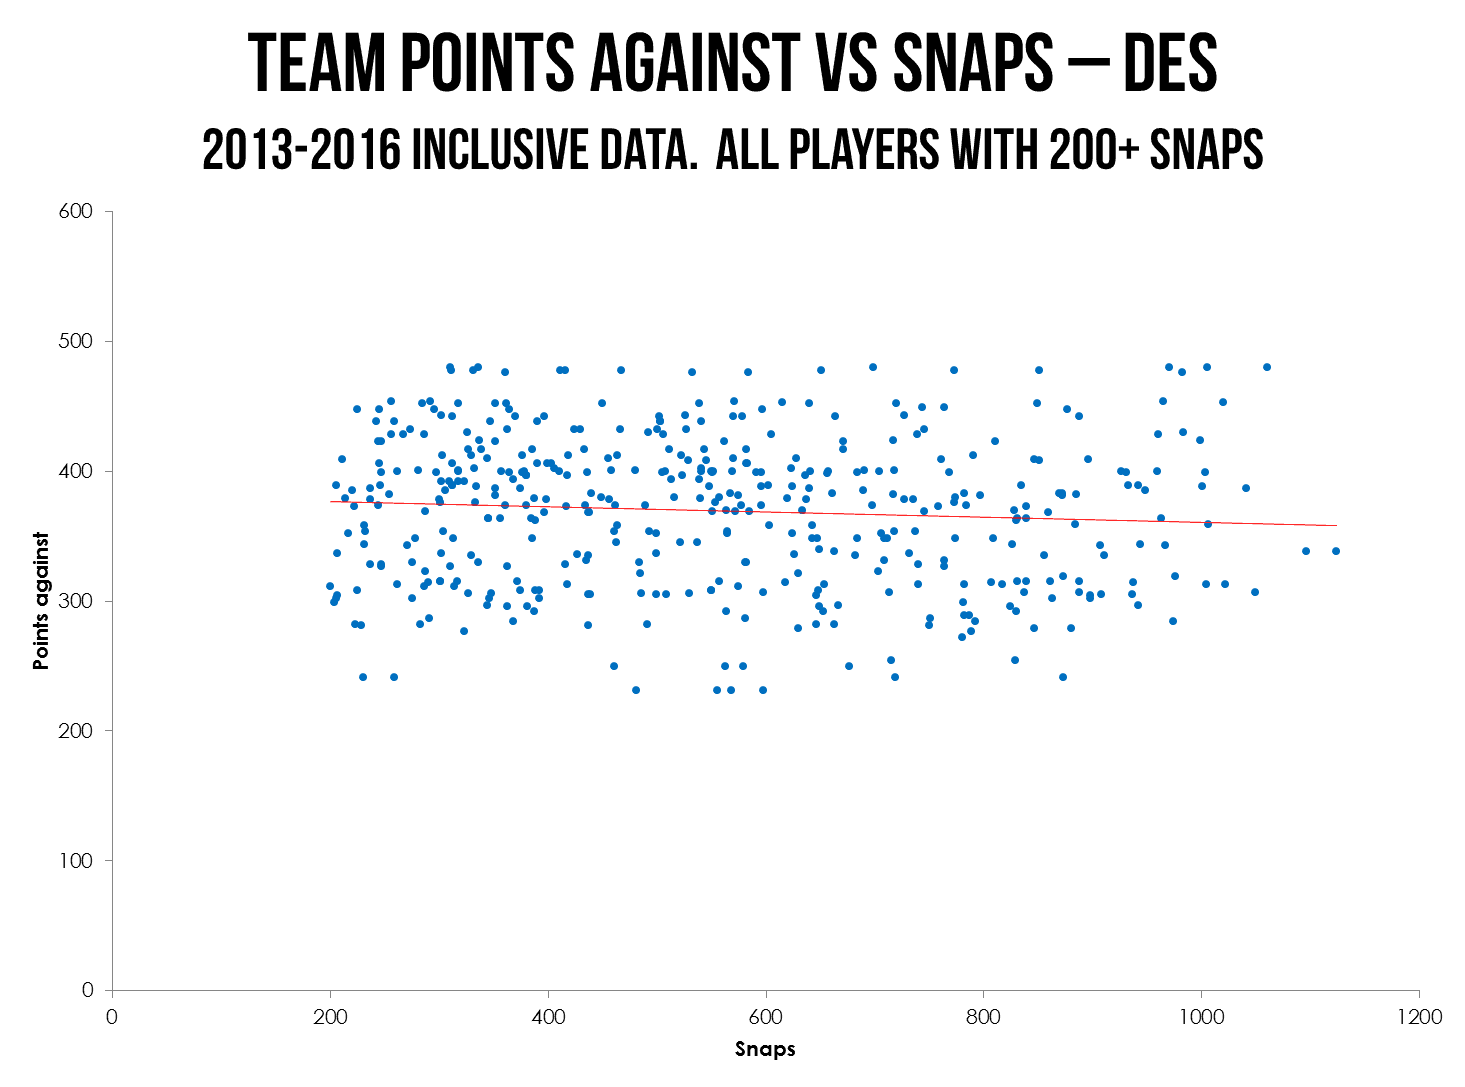
This is the other way around to what we saw earlier. The more points a team concedes, the fewer snaps DEs play. Although again, it’s not conclusive.
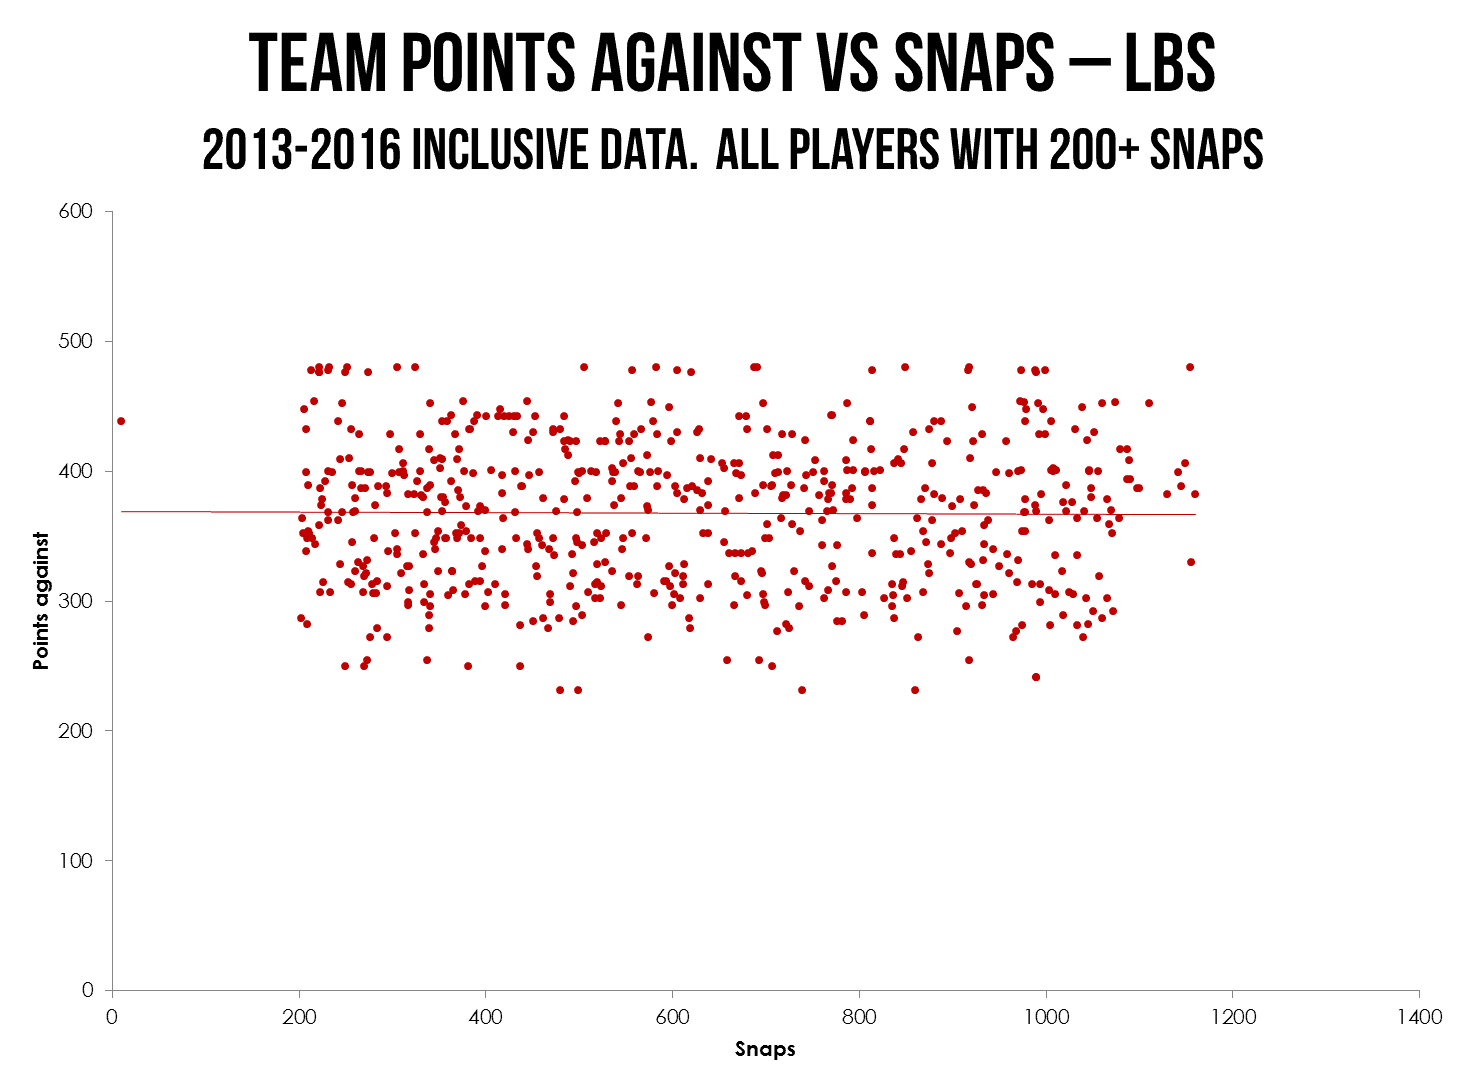
Similar to tackles above, there is no significant relationship here.
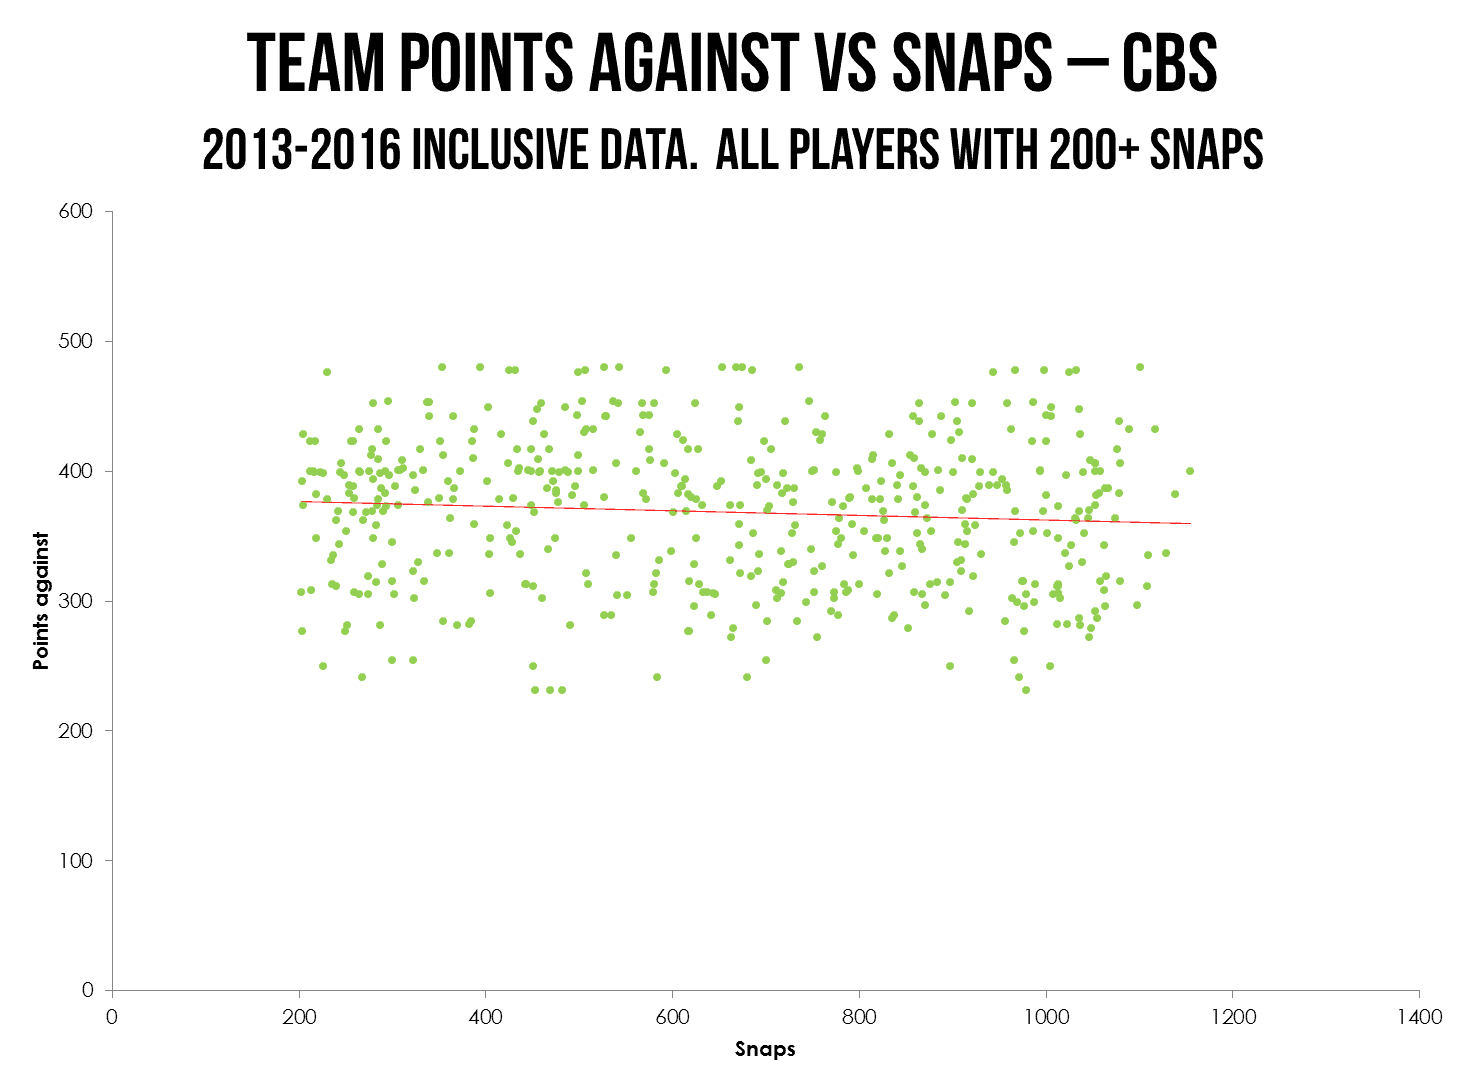
We do see a negative correlation here. SO broadly, the more points a team concedes, the fewer corners are on the field. As above, with wins this shows teams that are behind play more often against teams running to control the clock.
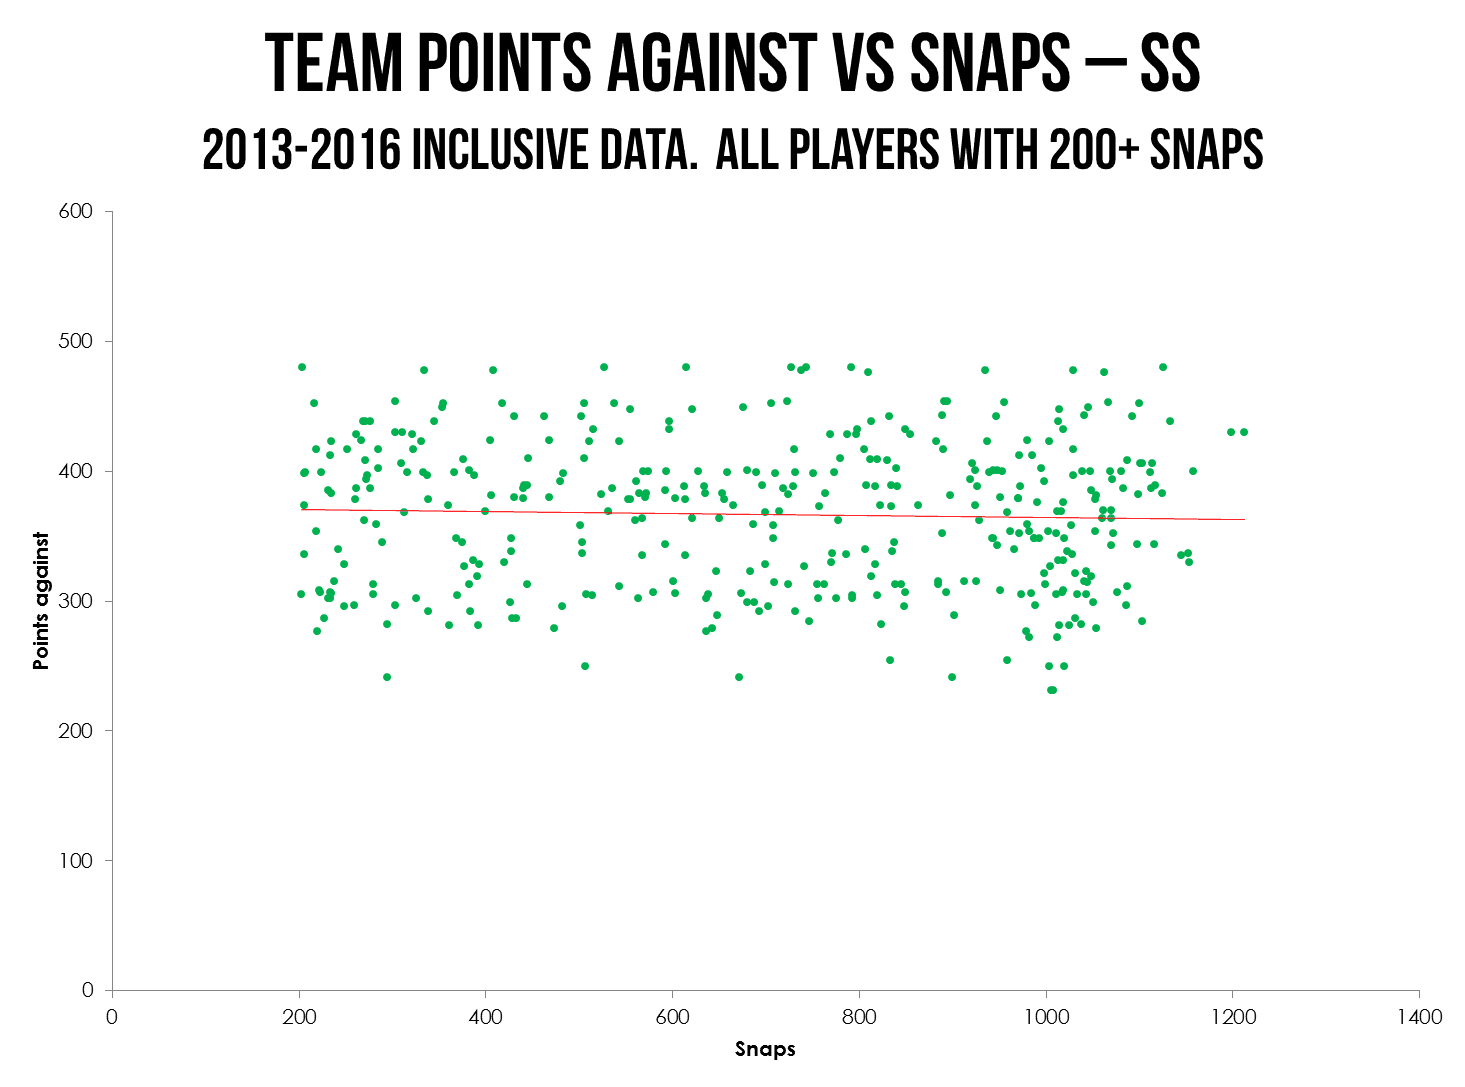
Finally, as with corners, we can see again that bad teams (i.e. those who concede more points) have their safeties on the field less as they’re often trying to stop the run.
So to summarize there were some fairly big shocks here for me.
- Overall there is no clear relationship to team quality and snap counts. IDPs on poor teams do NOT play more.
- Defensive tackles do play more on bad teams
- Defensive ends play more on good teams.
- Bad teams use linebackers slightly more than good teams.
- Bad teams use defensive backs less because they’re often in base rather than nickel or dime.
So how does that help? Going back to the impetus and the Jets, it seems we need to be smarter than simply saying “bad teams produce good IDPs”. We need to adjust by position. Using them as an example (and assuming they’re not very good in 2017), I would think the defensive backs will be on the field a bit less. This doesn’t mean Jamal Adams will play fewer snaps, as he’ll play on all three downs, but it does mean that the nickel and dime backs are likely to suffer a bit. In real terms Marcus Maye, will likely play fewer snaps than Duron Harmon in New England. On the other hand, being a bad team is good news for the linebacking corps and nose tackle. I would expect Bruce Carter and Steve McLendon to get a little bump compared to Elandon Roberts and Malcom Brown.
If you’re anything like me, this will take you a while to get your head around. A lot of the findings just seem counterintuitive. Which of course is why we’ve always been led to believe that bad teams make good conditions for IDPs. I would however advise caution. Very few of the gradients in these charts are steep, which means that the relationships are fairly weak. The information here is useful as a tiebreaker sometimes but should not be expected to massively alter the fortunes of players on very good or very bad teams. There are lots of examples where bad teams have produced good IDPs (Alec Ogletree, Paul Posluszny and Telvin Smith), but also many counterexamples. Ultimately this is a story best told across big data than individual cases because of the weak correlations. That itself is a headline because bad teams do not cause good IDPs.
I’d love to hear your thoughts and whether you have different theories about the data shown here. Feel free to comment here or you can find me on Twitter.
Thanks for reading.
[/am4show]
- Ten IDP Fantasy Football Stats You Need to Know after Week 16 - December 29, 2023
- Ten IDP Fantasy Football Stats You Need to Know after Week 15 - December 22, 2023
- Ten IDP Fantasy Football Stats You Need to Know after Week 14 - December 14, 2023


