Injury Distribution at the Running Back Position
A lot has been made recently about the health of the running back position. Through the constant beatings week in and out, there is nothing more valuable to your dynasty team than a durable bell cow. Let’s not fool ourselves, even through the perpetual devaluation of the position; we fantasize over these ever elusive unicorns.
Personally, I view the position through the lens that most players hold the talent to ascend to stardom, but lack the physical durability to maintain this talent throughout a season. With talent evaluation growing more and more popular, I find it incredibly important for fantasy owners to capitalize on finding the ability not just to find talent, but also durability. In this installment, I will describe the layout of how running backs are being injured, roll out a descriptive statistic that will help to eliminate durability, and finally put an end to the misuse of the term “injury prone”.
Seasonal Injury Distribution
The first stop in our injury investigation will be to look at how injuries have been distributed throughout time. Below, you will find a table outlining a number of time NFL running backs have spent on the Weekly Injury Repot (WIR). As I described in my last article, I choose to look at injury-weeks in place of unique events for several reasons.
- Not all injuries are equal. If I choose only to use the unique event, I will be misleading you immensely, because a simple knee tweak that doesn’t lead to any missed games will have a similar weight to an ACL tear. By using this counting approach we can position ourselves to look at severity in the short-term, and in future survival analysis articles.
- Teams don’t lie on injury reports. Zachary Binney (@zbinney_NFLinj) has published several articles on game time injury projection. In his analysis of team reporting, he indicates that was not an observed difference between teams. Either they are reporting correctly, or all are reporting in a similarly dishonest manner. Regardless, for this study, it will not matter.
- Lastly, injury time provides context as we search for a way to determine durability in running backs. To achieve this lofty goal, it is critical not only identify the running backs who can avoid injury, but also those able to maintain a workload despite an injury. By using person-weeks, we can build descriptive statistics to identify better who fits both categories. Oh, and don’t stop reading here, because I will reveal such a metric in this article.
Using strictly injured player-weeks caused some confusion to readers, which I hope to have cured by this drawn out explanation of its importance. The interpretation of these time variables can be difficult and somewhat counter-intuitive even to the most seasoned Epidemiologist.
Back to the Data!
Below is the person-week distribution of running back injuries from 2011 to 2016.
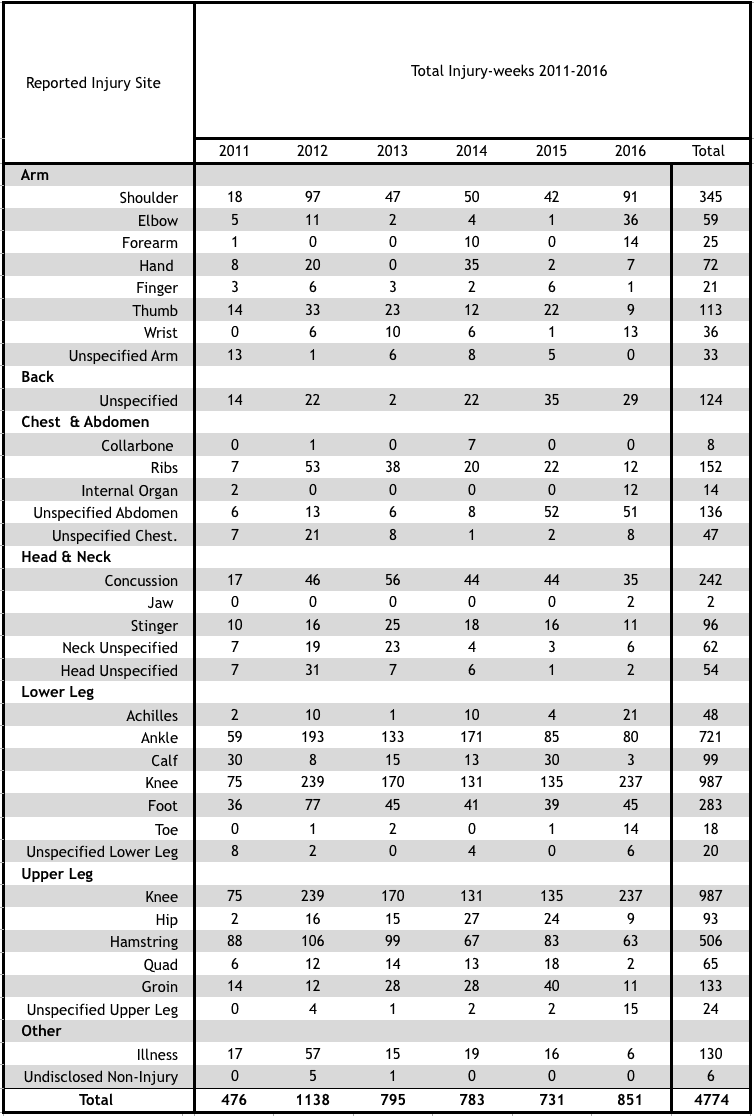
At first glance, you can see how much higher the injury frequencies compared to the quarterbacks. It is fine to give the eyeball test; however, we are unable at this point to definitively say that running backs are experiencing more injuries compared to the quarterbacks. I will study comparative injury rates to determine which injury each position is most susceptible.
As you can see, the most frequent injury that occurred in running backs was at the knee. The cause for this observation is tied with the severity of knee injuries within the population. To get a better idea of this assumption, we will move away from count data and introduce injury incidence. Incidence is the risk for receiving an injury within specified time-frame.
Below you will see the difference in injury proportion and incidence. Knee injuries are occurring more frequently and keep players on the injury reports longer than any other injury. This shows that knee injuries tend to be the most severe injuries at the position
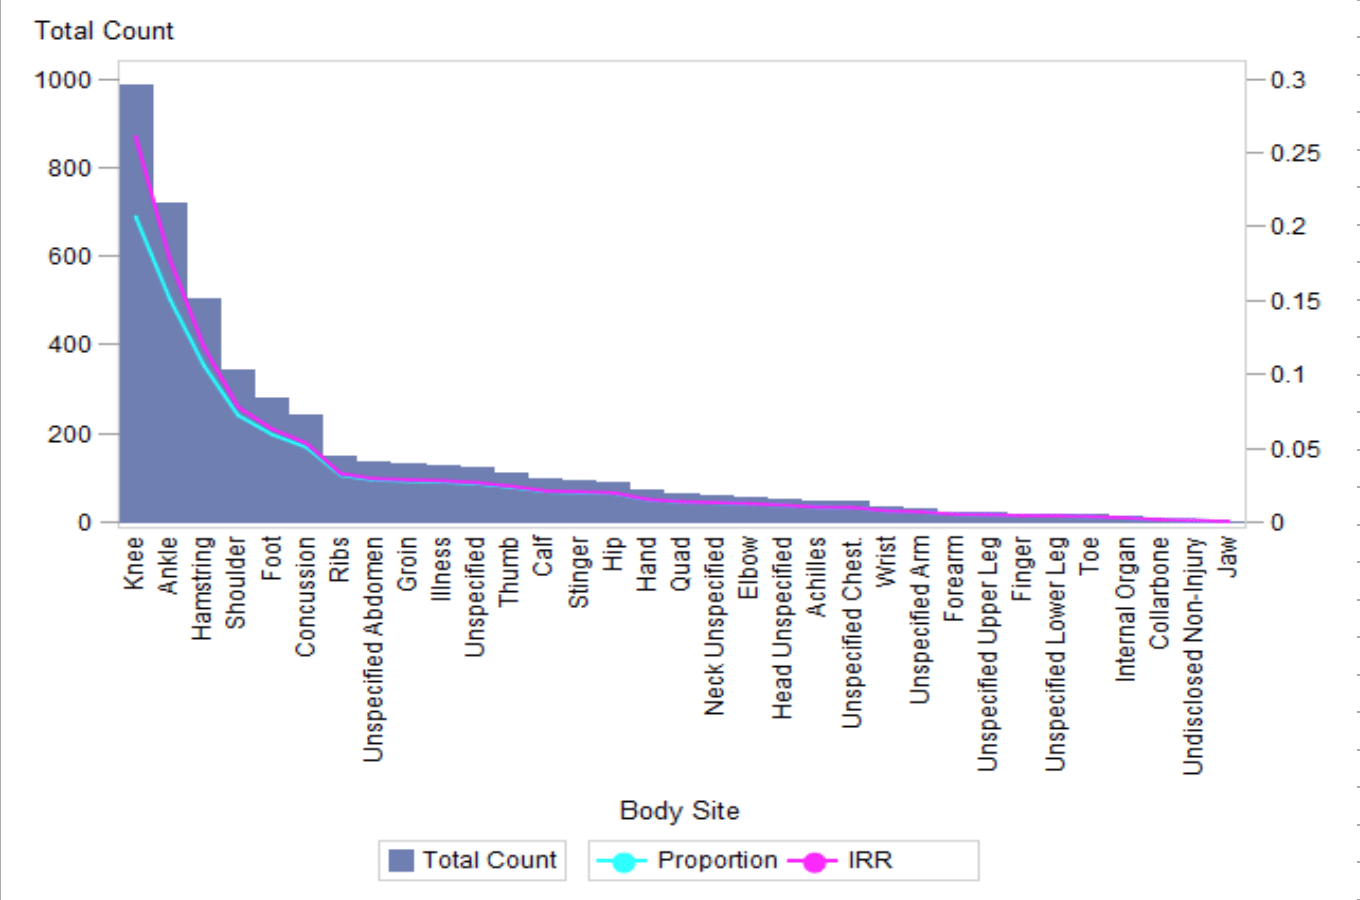
*prevalence is the proportion of injuries compared to the total number of individuals at risk in the population.
** Incidence is the total number of unique events over the injury-weeks during our investigation period.
Notable Running backs and their injury count over five seasons
The most commented aspect in my previous article was the table displaying the accumulation of player injuries through the study time frame. In the table below, you will find this same concept applied to running backs. The following are the top 30 running backs cited most frequently on the injury report.
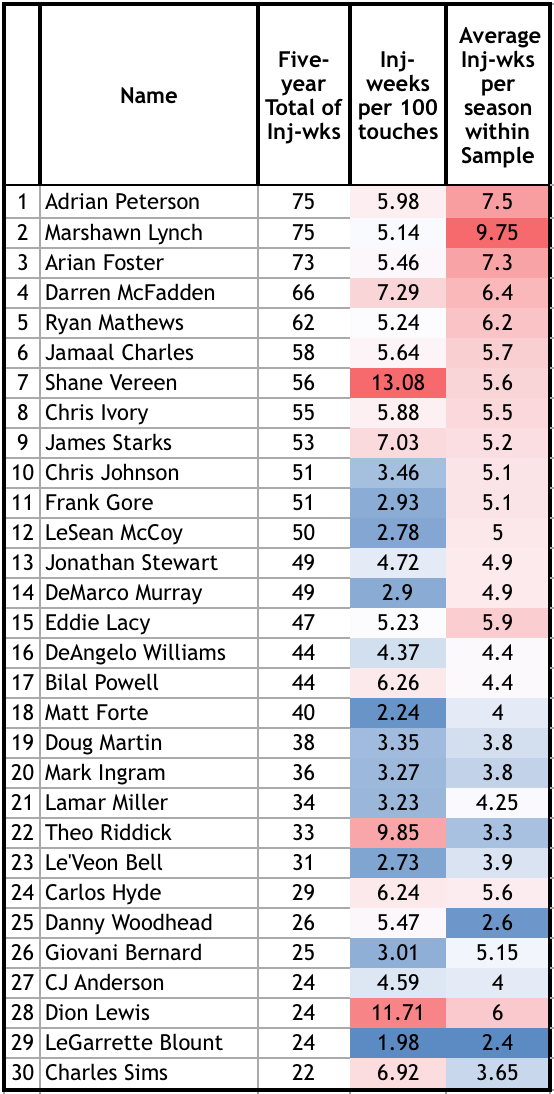
*cutoff for inclusion was drawn at unretired running backs with two seasons of 50 or more carries.
At the top of the list, you will find several older running backs who appear to be on the last legs of their career. The mounting injuries for both Jamaal Charles and Adrian Peterson have likely added to the skepticisms of teams about what they have left in the tank. Though they had illustrious careers, they rest alone with other retired vets: Marshawn Lynch and Arian Foster. This also makes for an interesting conversation if the Raiders do indeed add Lynch. Personally, I see their interest as a false flag, but Lynch could provide a short-term impact for your fantasy team after a year of healing.
Continuing to scan down, there are some highly valued young players who draw concern. Specifically, players like Theo Riddick, Charles Sims, and Dion Lewis. Of the young backs, none concern me more than Carlos Hyde. Below is a look at his cumulative injury weeks since entering the league in 2014.
Carlos Hyde
| Year | Injury | Week | Missed Gms | Wks on Inj Report | Wks Practiced on Inj | Season Ending? |
|---|---|---|---|---|---|---|
| 2014 | Ankle | Pre-season | 4 | 4 | 0 | No |
| Calf | 3 | 0 | 1 | 1 | No | |
| Shoulder | 14 | 0 | 1 | 1 | No | |
| Ankle | 15 | 3 | 3 | 0 | Yes | |
| Back | 15 | 3 | 3 | 0 | No | |
| 2015 | Concussion | 2 | 0 | 2 | 1 | No |
| Quadriceps Strain | 3 | 0 | 1 | 1 | No | |
| Foot Stress-Fracture | 6 | 8 | 9 | 2 | Yes | |
| 2016 | Concussion | Pre-season | 0 | 2 | 1 | No |
| Shoulder Strain | 6 | 4 | 4 | 5 | No | |
| Knee - Torn MCL | 16 | 1 | 2 | 0 | Yes |
It pains me to say this, but Carlos Hyde is nearing a “complete untouchable” category for me. Not only has he yet to complete a full season, he has an incredibly high propensity for injuries. Injury Propensity is what I define to be a high amount of cumulative injuries. The concept of propensity is different from the frequently overused term, “injury prone”. Injury prone is often misused in place of propensity, as being prone is an indication for a more susceptible to injury at the same site. Below, you will see that Chris Ivory fits the description of being prone to injury, but his propensity rests solely on his recurrent hamstring issues.
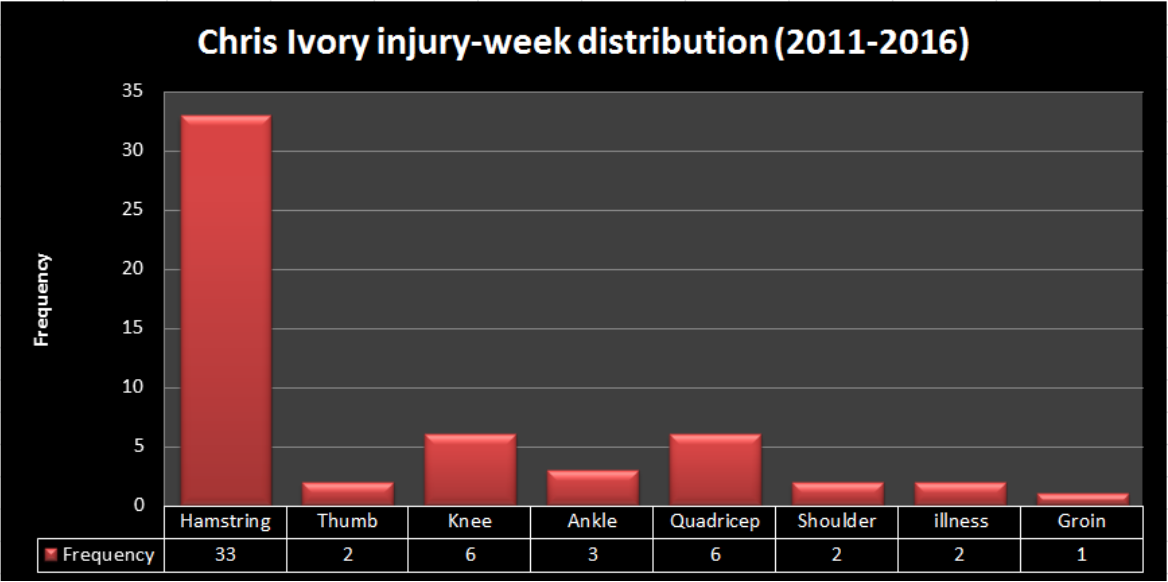
I know this topic has piqued a lot of interest. I will be working on an article outlining the true classification of “Injury Prone” and who falls within that category currently and historically. In a larger scope, I think propensity and proneness of a player both work together to enable us to identify both the durable ones and annual roster IR place-holders. However, propensity can often be misleading as it is affected by one’s age. This will absolutely be covered in my future work, so stay tuned for studies determining the threshold of the definition of injury prone and quantifying how age affects injury.
Injury-weeks per 100 touches
If you have been following me on Twitter, I have been sharing a time-based injury metric called Injury-weeks per touch. Depicted in table two, this proportion is the reciprocal rate of injury per touch. By using this metric we can begin to see more context about a player’s ability to both avoid and play through injuries. I have applied this concept on to the running backs above and found some very interesting results, especially for players that have been deemed overly burdened by injury.
First, it appears that there are several aging backs have maintained their workload well in the last five seasons. More specifically, it appears that many backs have been wrongfully labeled as an injury liability such as LeSean McCoy, DeMarco Murray, and Chris Johnson. For McCoy and Murray, I feel more confident in owning them moving forward as they appear to have much more tread on the tire than consensus might believe. Unfortunately, Chris Johnson will likely fail to appear relevant unless David Johnson falls to injury. I also think this descriptive statistic directly contradicts the idea that heavy workload seasons tend to be followed by injury plagued seasons. Of the backs in table two with 300+ carry seasons, only one is above average in injury-weeks per touch.
My second observation comes from those who are unable to maintain their carries through injury. Though it remains to be tested in a larger sample, we are able to see a very clear trend amongst the pass-catching back archetype – they depend heavily on their health to produce. As someone who has placed a premium on pass catching in dynasty assets, I don’t know that I can advocate this any further. Their value as they sit on your bench will likely fail to help win you a championship.
Though many don’t have a high value assigned to their Shane Vereen shares, players like Theo Riddick and Dion Lewis are still counted upon to produce moving forward. Based on this historical data, I would advise mitigating this abnormally high injury threat by trading away your shares. This advice might be met with skepticism, however I would not be doing my duty if I failed to tell you that you are playing with fire.
I will be writing an article solely outlining this statistic, provide a deeper explanation of how injury-weeks per touch should be used, how it is calculated, and establish the rates into quartiles (four groups) to help categorize these players for you, the reader.
The more I dig through these injuries, the more I see a full frontier untouched by the football community. Injuries have a hand in every players fall in annual production, ADP, and career longevity. I encourage you to begin to consider injuries as a context for assumptions about a player’s ability and future outlook. By correctly incorporating it into both your short and long-term decision making, you will have a massive advantage over your leaguemates.
Thanks for reading!
- The Top Five Durable Players by Position: Part Two - September 9, 2017
- The Top Five Durable Players by Position: Part One - September 6, 2017
- What are the Durability and Susceptibility Metrics? - July 16, 2017


