Fantasy Draft History – Heat Map
Every year it’s the same song and dance.
Draft pick fervor picks up steam heading into the end of the season as teams out of the playoff hunt begin looking to “next year”. After the season, all eyes focus on the NFL Combine and the fervor reaches a crescendo as the NFL Draft approaches. Fantasy draft picks never carry greater value than those couple weeks prior to the NFL Draft. Following, it’s nearly always the same result: the top picks retain the most value while most others decline as the hopes for marquee players going to first-tier situations instead land in less-than-ideal offenses or a crowded depth chart.
Part of the blindness that occurs each year around this time is due to most of us having a short-term memory. Rather than looking at the past as a guide to what has occurred in reality, we instead focus on the hope that is the year to come. We are brilliant in our humanity and optimism for what the future may hold.
But what HAS history shown us?
It’s been a few years since my last review of draft history. I used to perform the exercise annually toward determining the true value of those draft selections. What if I could tell you that the 1.01 in your fantasy draft is no better than a 50/50 proposition? Or, if a first round selection at or after the 1.09 of a twelve-team league nets you a productive fantasy player only 10% of the time? How about the 1.04 being worthwhile only 22% of the time while the 1.03 has the greatest success rate of any first round selection?
Intrigued yet?
What we know is that history may only suggest what the future may hold and in no way dictates it. But without history, we have no tools to help guide us in the future. What follows is a nine year draft study of one of my PPR dynasty leagues assembled into a heat map of sorts. I’ve taken the top three rounds of each year and broken down the picks into one of four categories:
- Stud – A player that plays every week regardless of matchup
- Starter – A routinely productive and valuable weekly player
- Bench – A player that has had production for periods of time, but is only played in dire need
- Bust – A player that never had a level of consistency and is likely on the waiver wire
To be sure, how each player fits into these categories is my own exercise and you the reader may disagree such that the percentages may shift, but I think you will find that the labels are relatively appropriate and the matrices material enough to provide some level of usefulness. In any case, let’s get to the history so that we can take a closer look. Firstly, below are the colors of my labels that provide the heat map:

Once we have these established, it makes looking at a given year or set of years much easier in that it quickly colors (no pun intended) the view. Below are years 2008 – 2016, nine years of a 12-Team PPR league, three rounds for each. Just a couple quick notes:
- Rookies and free agents are represented
- Defenses are included on occasion and are always listed as “Bench”
- Very recent history is difficult to categorize so I use a balance between production and trend
- It’s far more important to pay attention to two groupings: Orange/Yellow and Bench/Bust
- As with all historical drafts, hindsight is always 20/20. Cut the coaches some slack
Let’s get to it!
[am4show have=’g1;’ guest_error=’sub_message’ user_error=’sub_message’ ]
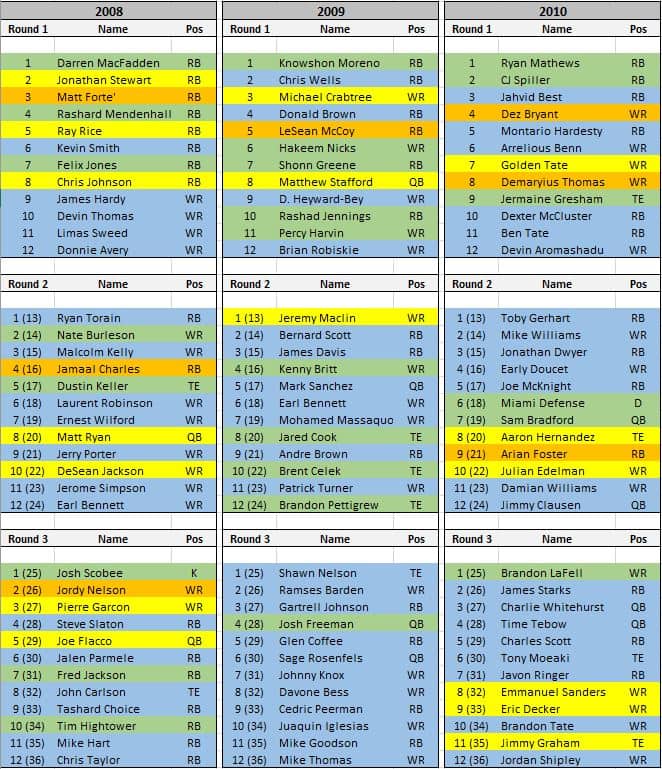
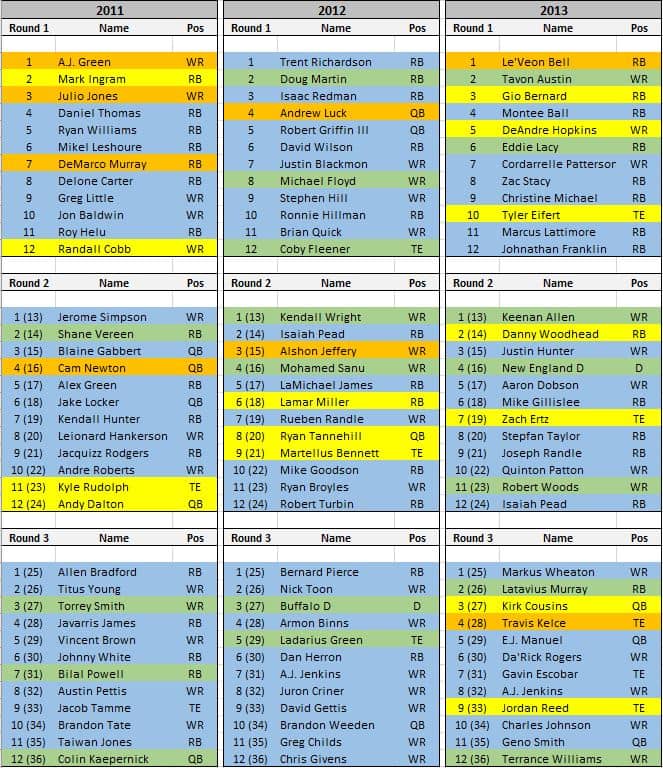
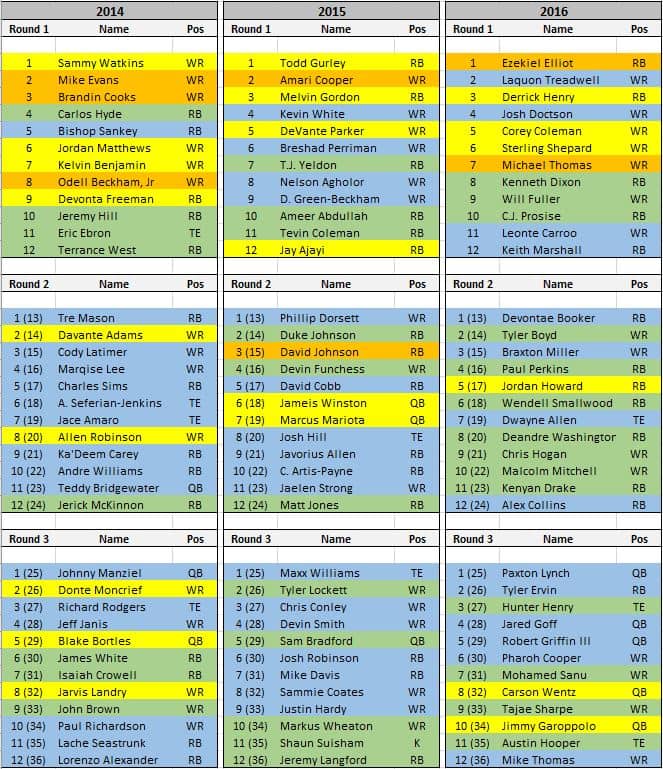
Rather interesting is it not?
Before moving on, take a quick look at the last three years. Last year I wrote a piece about the the quality of certain positions within recent drafts, noting specifically the increased results in recent history. Most notably in the position of receivers, either teams have increased their ‘hit’ rate due to increased metrics and intelligence or players are simply better. Either way, arrows do appear to be pointing up. Lastly, note the sea of blue in most years, especially outside of round one. We’ll go deeper into the rabbit hole now.
The next graphic shows all of these drafts broken down by pick and production category.
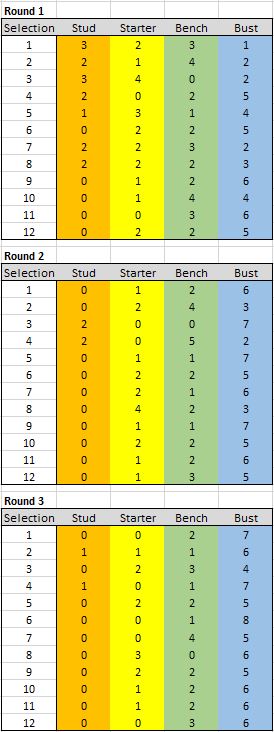
And lastly, all drafts broken down into category by round:

Analysis
I could spend hours breaking down what we see here but I’ll allow you to draw what you will from it. Here are a few of my notes.
Every year will have it’s own complexion obviously. Drawing from specific selections is an interesting exercise but nine years of results will offer a lot of variability. I like to look at broader trends with some specificity when there’s something to be gained:
- The 1.01 isn’t a risk free selection. Only 56% (5) have panned out. Three of which were studs
- Of the 108 first round selections, only 34% (37) have become studs or starters
- Of the 108 second round selections, only 20% (22) have become studs or starters
- Of the 108 third round selections, only 13% (14) have become studs or starters
- Of the 324 selections during the nine year period, 77% (251) have been either busts or bench players
- Statistically speaking, the 1.03 has been the best (70%) producer within the first round
- 1.11 produced no studs or starters during this period
- Of the studs, 68% (15) have come from the first round
Summary
Again, we could analyze this endlessly but probably don’t need to outside of generalities.
The point from this exercise is to show something that I’ve long been able to show in previous years, there is gold to be found in the rookie draft but to believe you can build a championship caliber team from it is folly unless lady luck strongly favors you. The 1.03 selection being the statistically best selection isn’t beyond reason. Marquee names dominate much of the discussion leading into the NFL draft. These players are often selected by fantasy coaches far more based on selection number than situation. With quality talent at the 1.03 in fantasy combined with a better situation, it is likely that this combination provides for the best balance leading to fantasy selection.
When last I performed this study, second round selections produced at a 15% level. As stated earlier, we’ve seen better results in recent history, now up to 20%. And at a 13% rate, the third round is a very poor bet.
What this all boils down to is knowing your odds into what you are trading away to acquire draft picks. Do you tend to be a better drafter than your league-mates with a greater eye for talent and situation? Or are you acquiring due to the fun and hype of the draft? Either are quite okay but you must keep your eyes open. This stratification continues to show that as a competing team, your best bet is to move your late first round selections, and beyond, for production level players to teams looking to rebuild. Allow others to roll the dice while you acquire players with known production.
The hype of the rookie draft is all too real. The parroting of the fantasy community whips up a fervor that sends many into senseless trades and false hopes. This is a time to capitalize if you can see your way clear. If not, then do your homework and enjoy the fun of the draft. Regardless of the numbers above, fantasy just isn’t the same without the excitement of rookie selections.
Draft well!
Follow me on Twitter: @DLF_Jeff
[/am4show]
- Lineup Advice: Wrap-up, Thank You and Goodbye (TTFN) - January 1, 2024
- Lineup Advice: Week 17 – Championship Edition - December 26, 2023
- Lineup Advice: Week 16 – The “What is” Edition - December 19, 2023


