Hit Me Baby! One More Time? Part Two
Anyone who follows me on Twitter knows that I pump out a load of nuggets about players and top tens in the stats I like to track. One of my core tenets is that it’s very, very hard to remain at the very top or bottom of efficiency metrics in the NFL. The circumstances that go into being an outlier are simply too tough to recreate across years. I’ve just finished building my core dataset out to include all 2015 as well as 2016 so I wanted to look at whether that is true. Can players manage to stay at the top or bottom across seasons? Obviously two seasons doesn’t necessarily prove it either way but it’ll be really helpful in determining how much we can predict using these numbers about 2017.
Test subjects
Rather than talk about this in abstract terms I wanted to use real-world player examples to show how players can move around. So first I want to look at a few different players to see what happened to them. To do this I picked a bunch of players from the top of my head that were good performers in one of those seasons at least. This is the list of examples I’ve picked:
- Danielle Hunter
- Ziggy Ansah
- Vontaze Burfict
- Telvin Smith
- Damon “Big Snacks” Harrison
- Ndamokung Suh
- Landon Collins
- Morgan Burnett
- Marcus Peters
- Logan Ryan
I covered the first six players in the previous part of this article. Now let’s look at the defensive backs.
[am4show have=’g1;’ guest_error=’sub_message’ user_error=’sub_message’ ]
Landon Collins
OK. The consensus opinion is that Landon Collins struggled as a rookie in 2015 playing free safety. He was moved to a more traditional strong safety role in 2016 and suddenly exploded. This is how tackle efficiency over the two seasons:
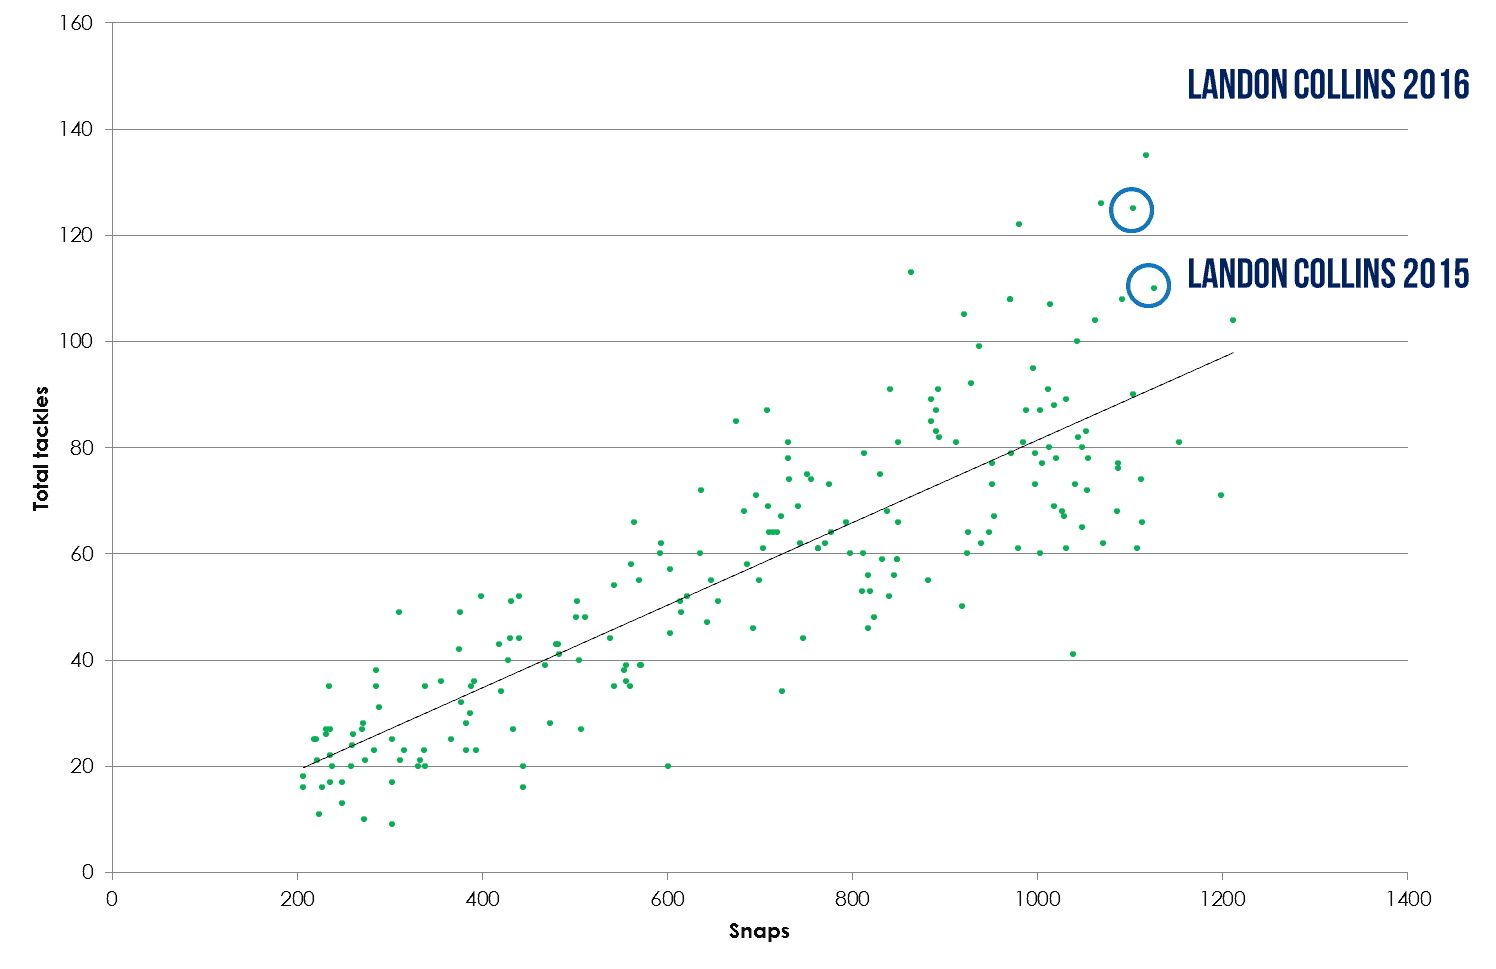
Hmmm. It doesn’t seem all that different to me frankly. Those are two excellent seasons in the tackle world. Let’s see how he held up in coverage:
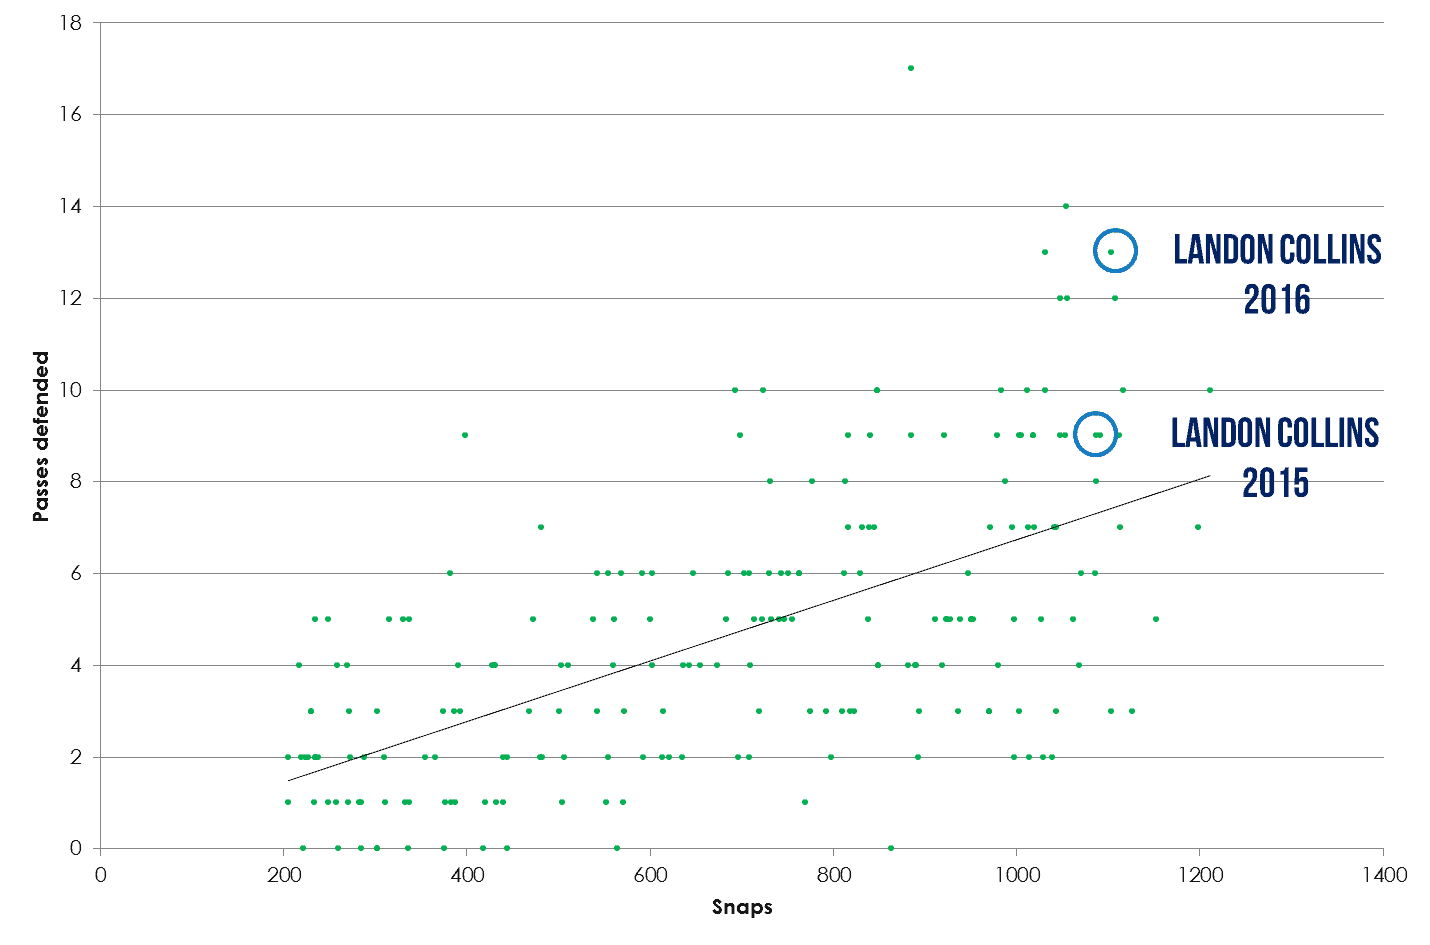
Collins was efficient as a rookie here too, but in 2016 he shot up to truly exceptional levels. Collins was good as a pass rusher too, so here’s how that looked:
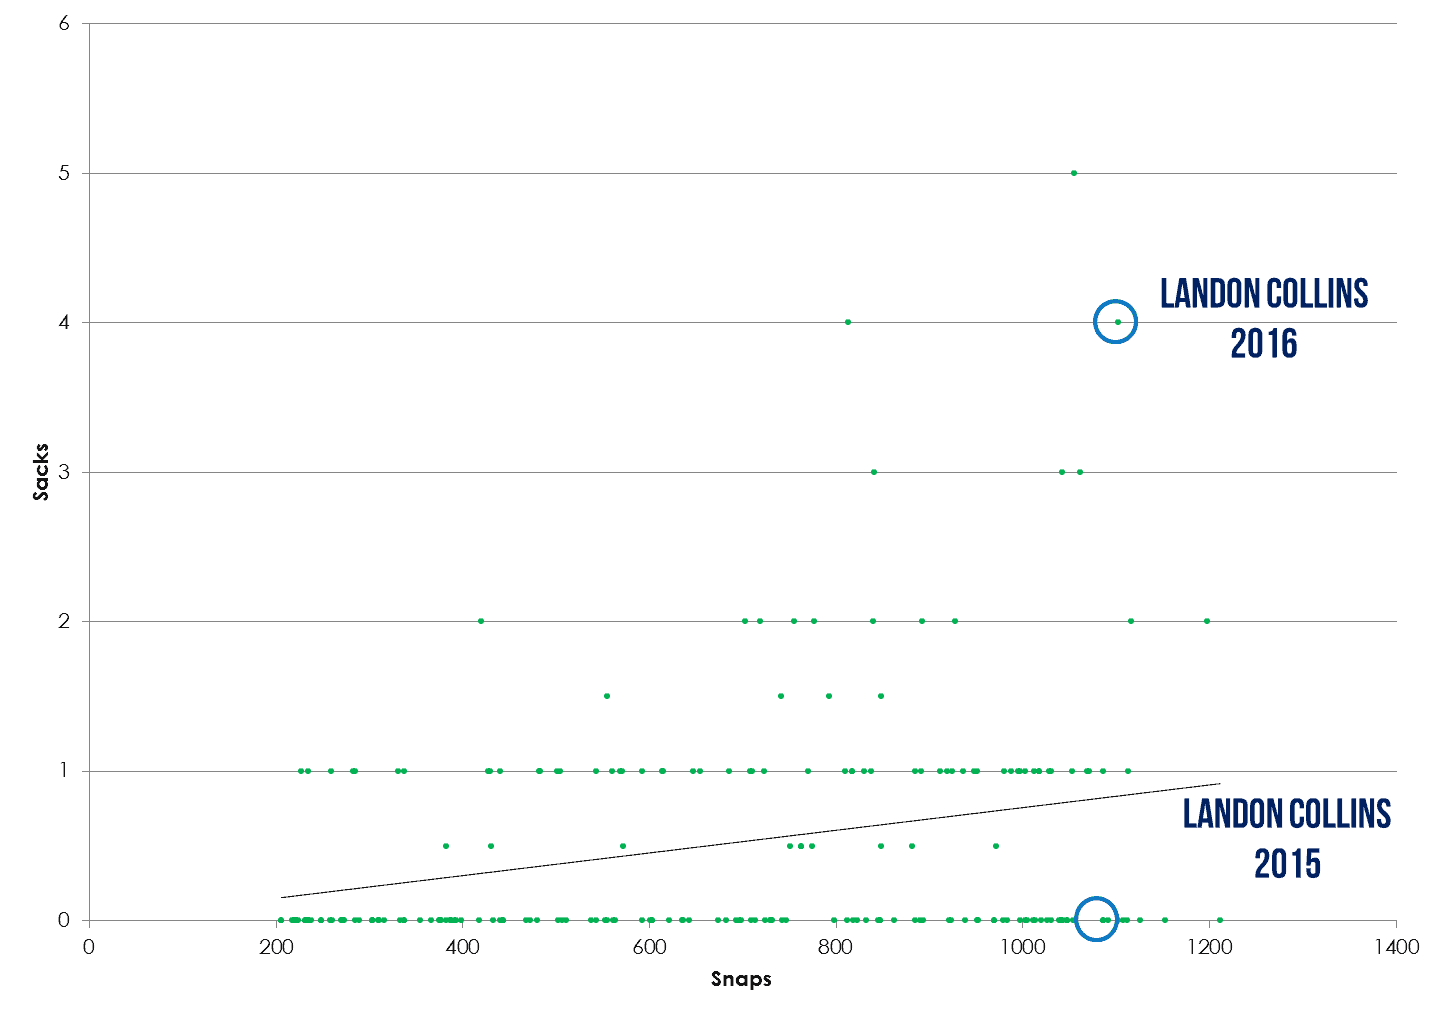
OK that’s pretty clear. As a rookie he didn’t manage a sack. As a sophomore his four sacks were near the top of the list for safeties. That is one stat that might be very hard to recreate.
Morgan Burnett
I love Burnett. He’s been a solid IDP player for years and he’s still 28 years old. He played a fascinating hybrid LB/S role in 2016 so how did he look across seasons?
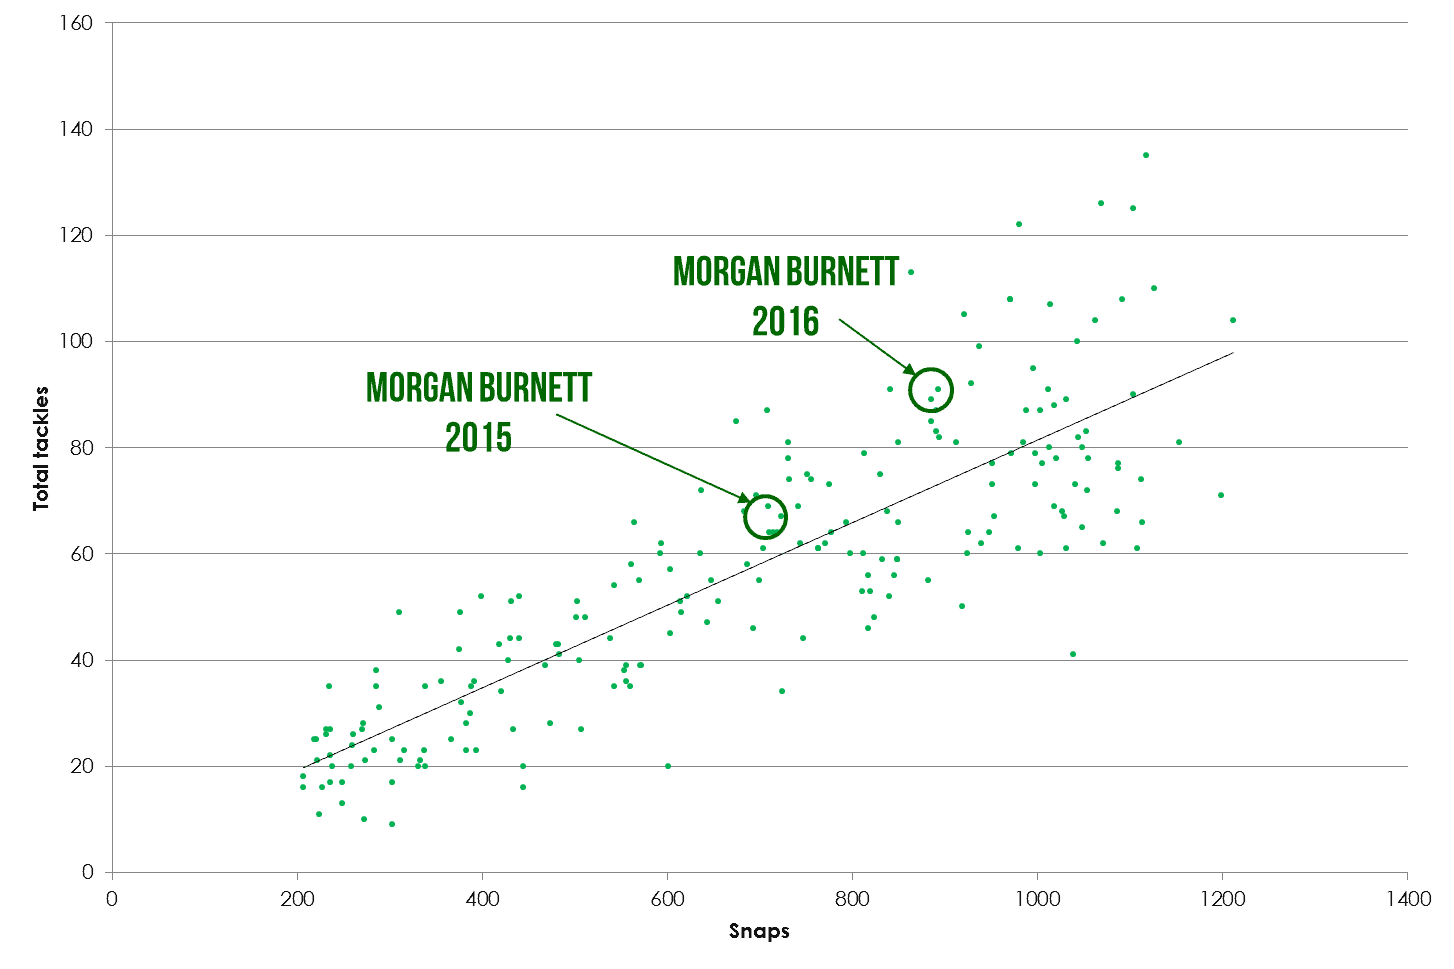
This surprises me a little. Namely that it’s middle of the pack. Given Burnett is clearly a top 12 safety, I was expecting this to look better. The volume and total tackles increased in 2016 but the efficiency remained about the same. He’s well above the line so he’s doing well, but the limited snaps are holding him back. Let’s look at his play in coverage.
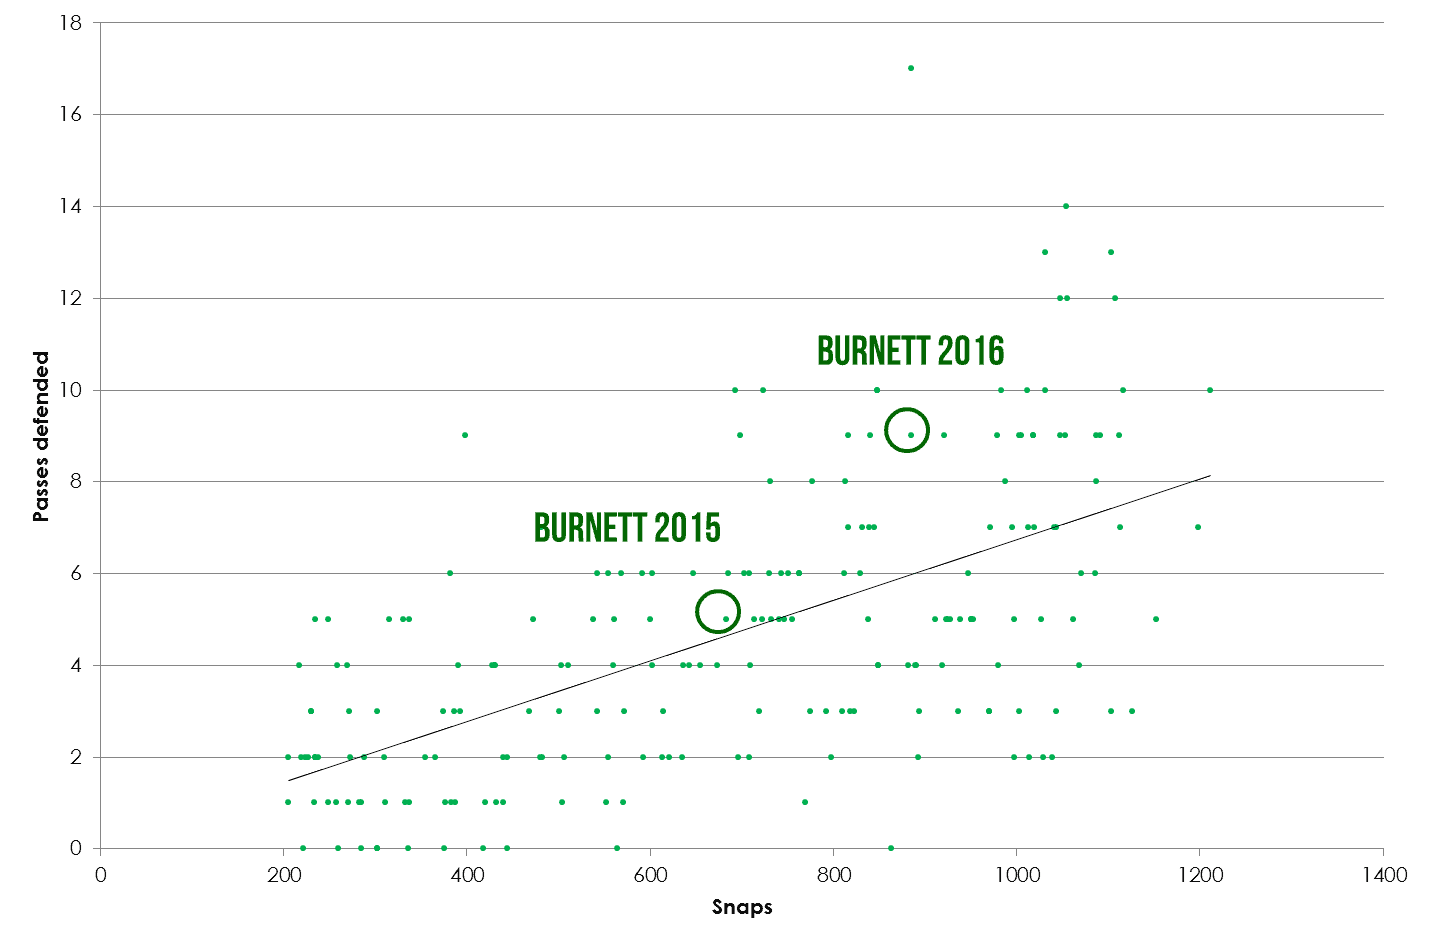
There was quite an improvement here in 2016. In 2015 he was a league average player in coverage, but in 2016 he actually made some plays. To break it down further, this is where he sat in 2015:
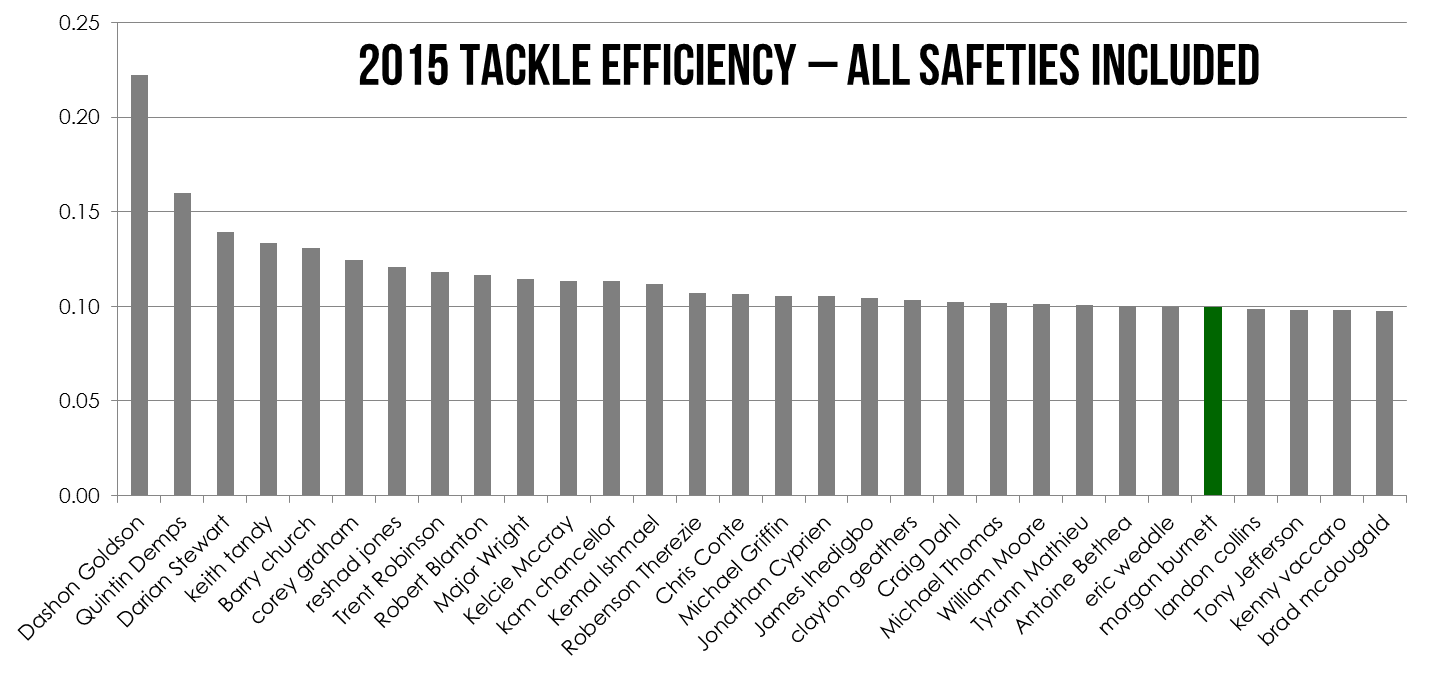
Top 30 is OK, but not impressive. This is his 2016 standing:
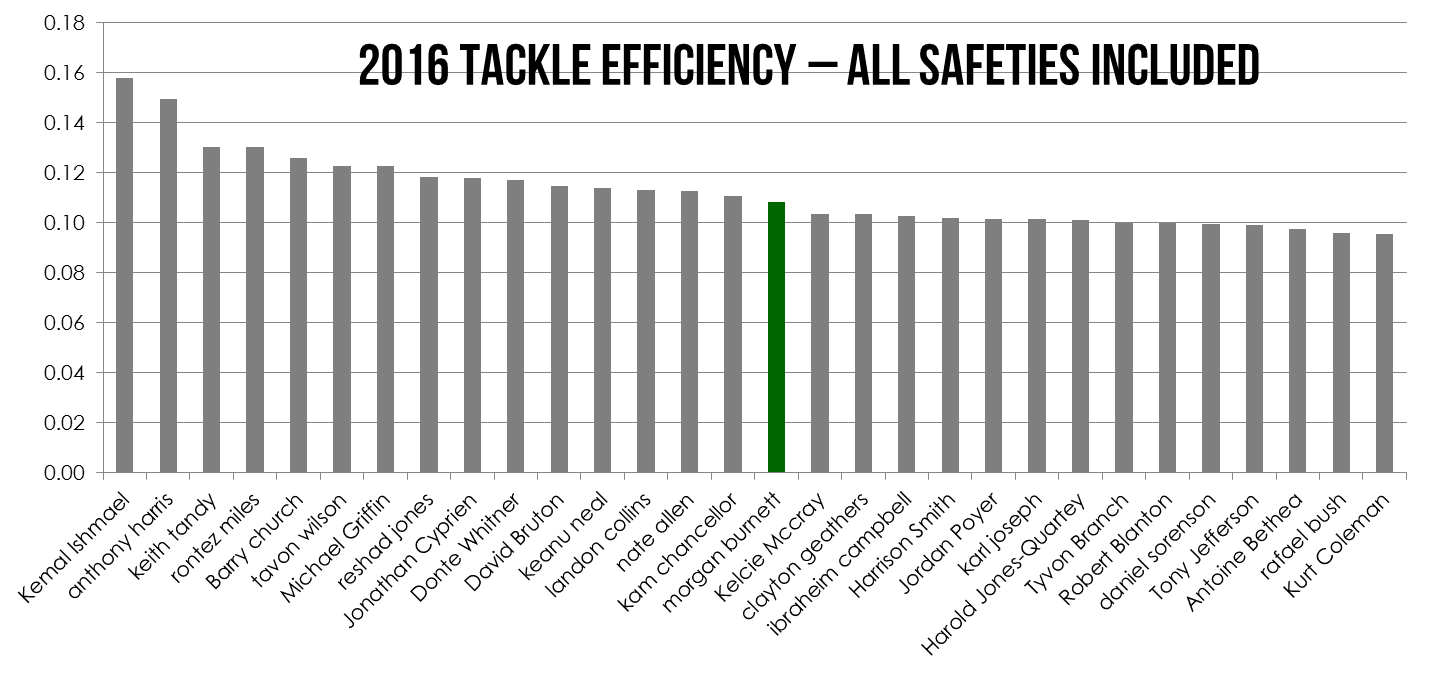
It was much better, but for a player with a reputation for playing like a linebacker, this isn’t impressive.
So we’ve seen that efficiency is pretty variable across most positions. Let’s see what we can see about perhaps the least predictable position in dynasty – cornerback.
Marcus Peters
Peters exploded onto the scene in 2015 and promptly led the league in interceptions as a rookie. The naysayers dismissed this and simply said he was targeted heavily playing across from Sean Smith. Smith left for Oakland and Peters was again a top fantasy asset in 2016. So let’s see how he stacks up:
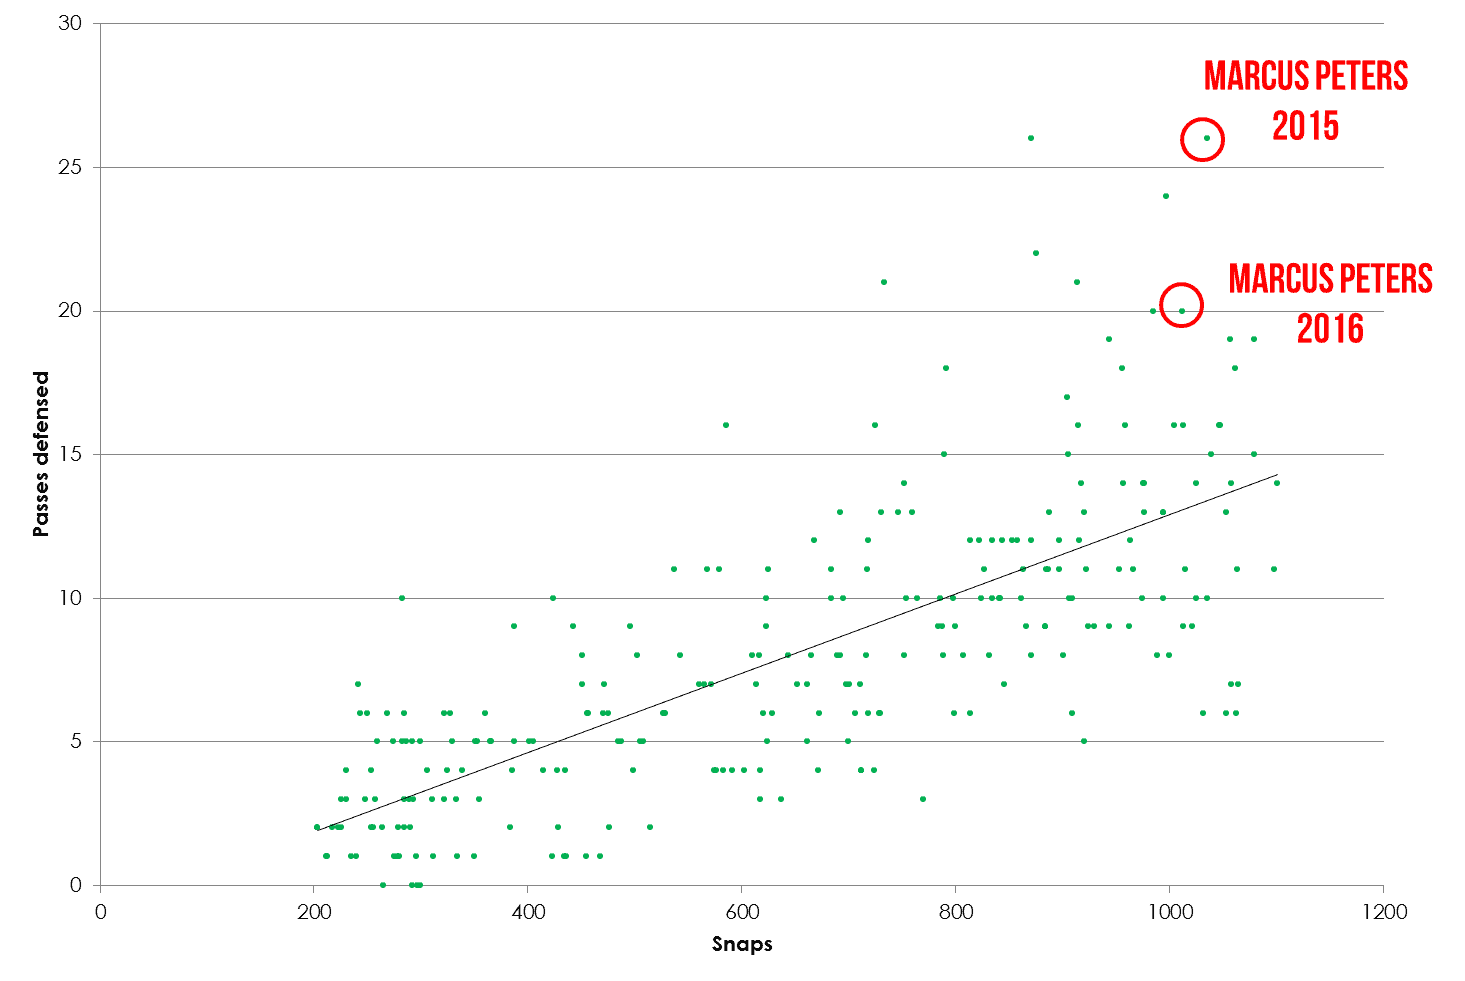
Pretty compelling stuff. It’s clear that he is an elite talent at making plays in coverage and may continue to be so. But since so much of a corner’s value is about tackling in FF let’s look at how he stacks up there:
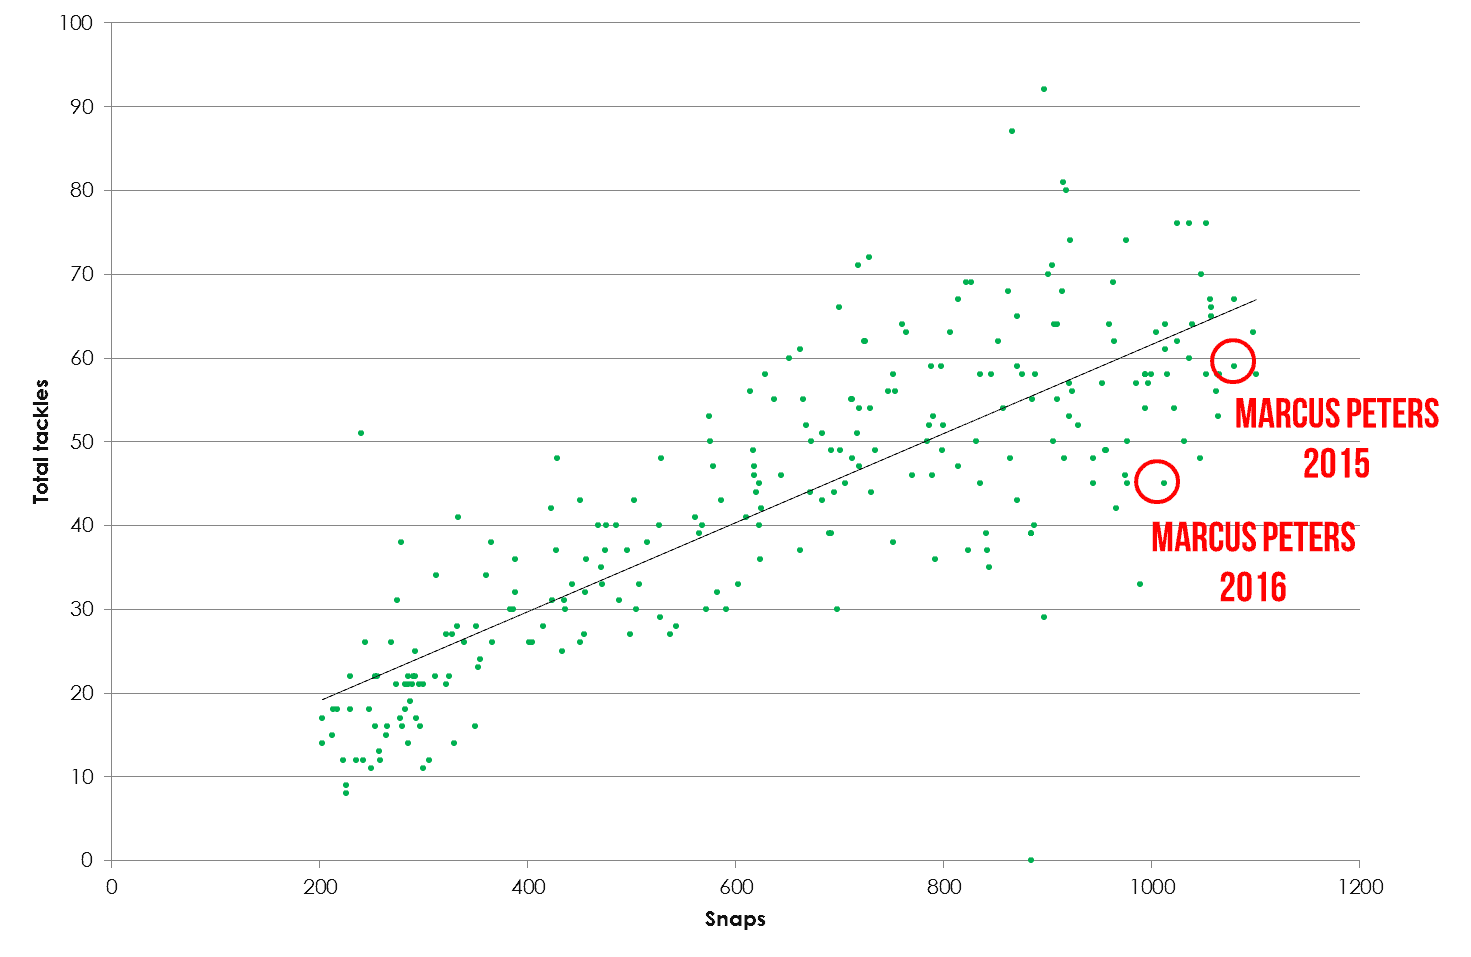
Badly is the answer. As suspected in 2015 he had a very high volume and although he was slightly inefficient he still managed to put up numbers. In 2016 that changed with Smith gone and he was simply bad. The number of tackles you get out of Peters is low for the amount he plays. He scores points anyway because of his plays in coverage but in tackle-heavy leagues this severely limits his usefulness.
Logan Ryan
In some of my leagues Logan Ryan was a top three corner each of the last two seasons. But his play is vastly different from Peters’. This is how he looks in the coverage game:
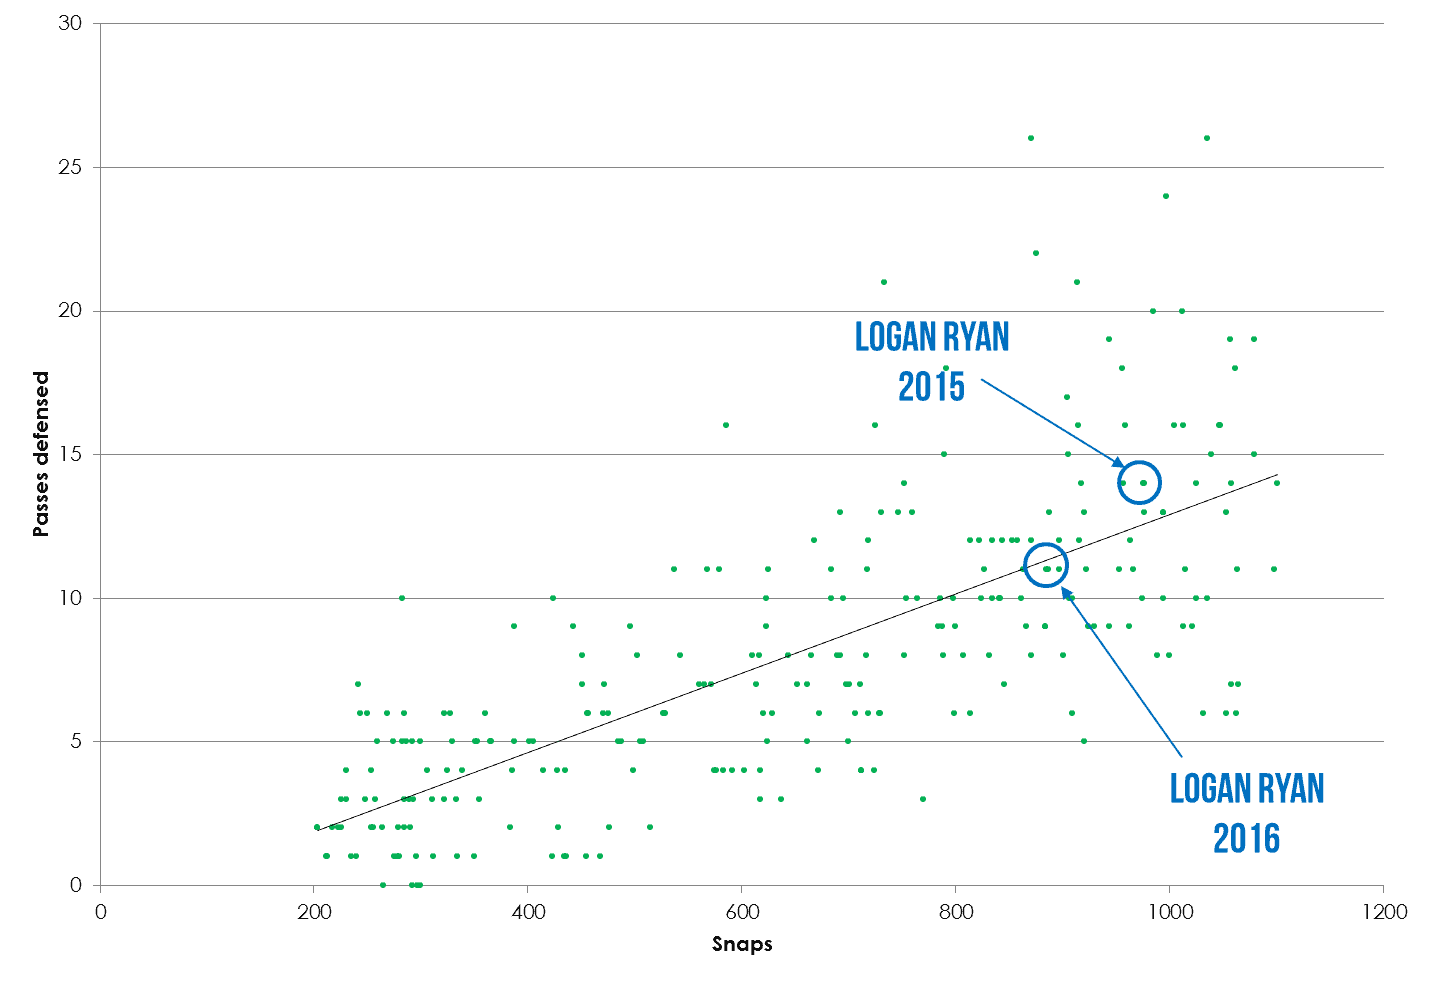
Strictly average, quite frankly. There was a slight difference in volume, but basically he produced what you’d expect him to given his snap count. Of course; he wasn’t in your team because you expected him to make plays on the ball. He was in your team because you expected tackles. This is how he charted in tackle efficiency:
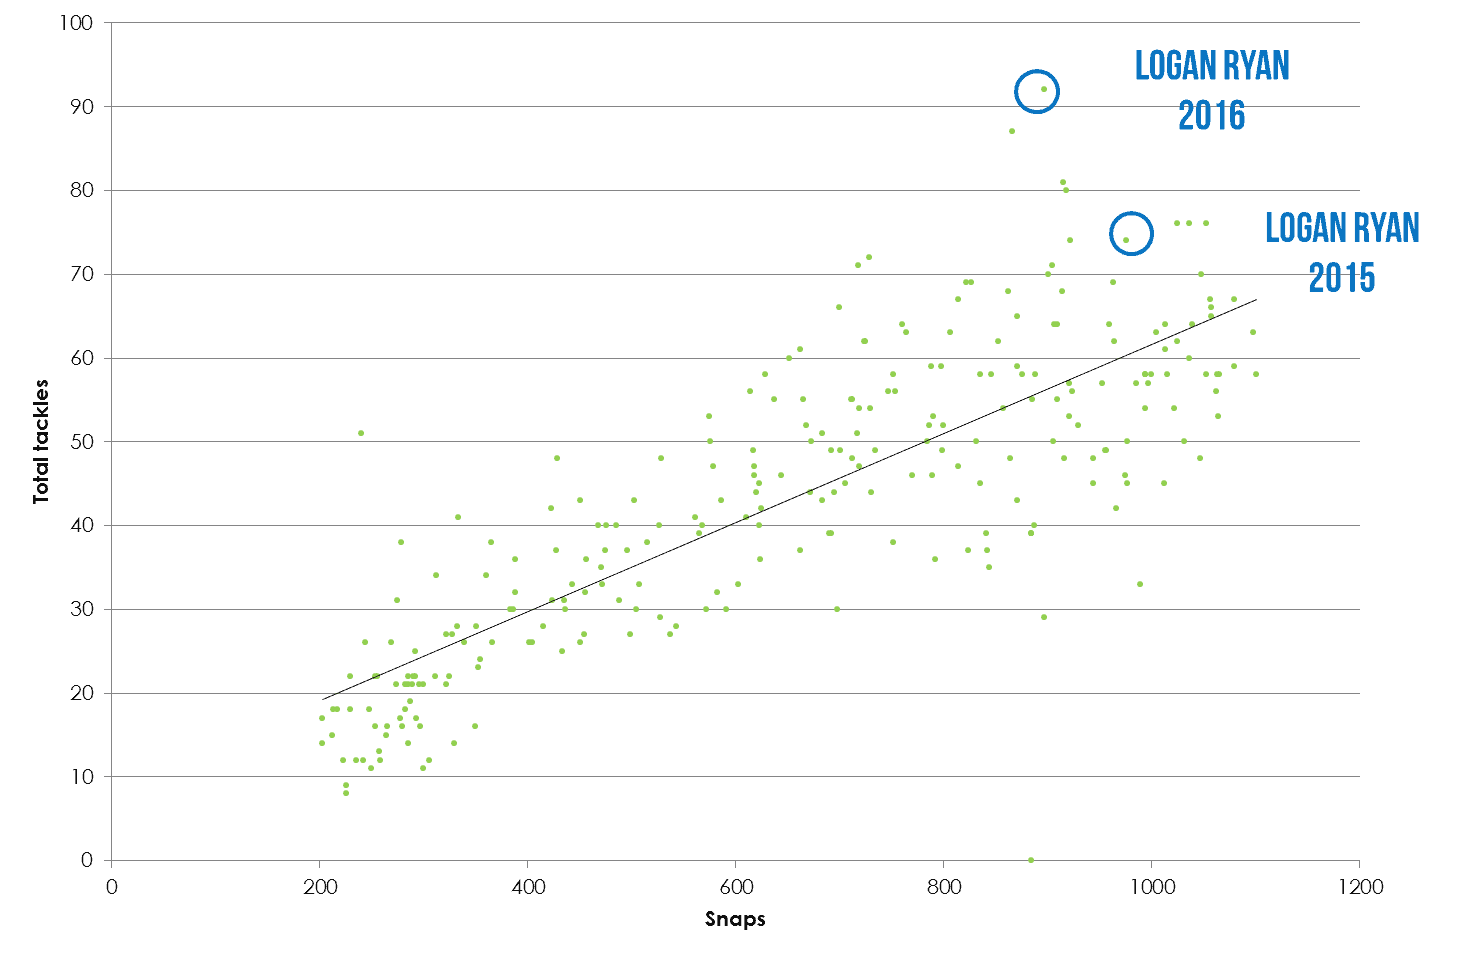
Wow. 2015 was a good season. 2016 was exceptional. He’s clearly a good tackler and should continue to be so in Tennessee even in a different role but I would expect him to drop back a bit. That 2016 performance was just too good to repeat.
Summary
We’ve seen that even in elite players, performance and efficiency can be very different. Some players have managed to repeat amazing numbers (Snacks Harrison, Marcus Peters, Landon Collins) and some have failed to live up to lofty expectations. I’ll be looking at overall trends in more detail as well as trying to add more data so we can start to see which seasons are the exception and which are the norm. In the meantime I hope I’ve helped you look at stats in a bit more detail than simply numbers themselves. As always with IDP, the ability for players to maximise opportunity at scale is absolutely key. Until next time!
[/am4show]
- Ten IDP Fantasy Football Stats You Need to Know after Week 16 - December 29, 2023
- Ten IDP Fantasy Football Stats You Need to Know after Week 15 - December 22, 2023
- Ten IDP Fantasy Football Stats You Need to Know after Week 14 - December 14, 2023


