Efficiency in IDPs: Solos! Is it Me You’re Looking For?
A few weeks ago I wrote an article about efficiency. Which IDPs scored well compared to how long they were on the field? The issue is: there is there’s very little consistency in IDP scoring. Players who were efficient with my settings may be less so with yours. So what I wanted to do was try and be a bit more universal and go back to core concepts which can be applied more directly to your own league – because I want your team to win. I want you to pick players at great value and avoid the pitfalls of buying players at their peak. Mainly because if those things happen there’s a (small) chance you say nice things about me on Twitter. That would be ace. So today I wanted to look at the most basic building block of IDP fantasy football: the solo tackle.
Personally, I favour big-play scoring (I’ve got an article coming out soon on why this is) but even so, tackles are fundamental. If you can identify players who get more tackles per opportunity than the next guy you’ll score more points.
I’ll only be looking at defensive tackle, defensive end and linebacker here. Defensive backs behave quite differently so I’ll be covering them separately.
Underlying factors
Good football players record tackles. This is the core concept of how many of us think about defensive players. Unfortunately it’s flawed. Here is a graph to show PFF grade (in my opinion the best proxy to use as a measuring stick for how good players are) vs number of tackles from the whole 2016 season:
[am4show have=’g1;’ guest_error=’sub_message’ user_error=’sub_message’ ]

As you can see there’s a negative correlation. The worse a player is the more tackles he records. Crazy right? How do bad players make more plays than good players? Of course it’s more complicated than that and actually varies a lot by position. Here’s the same data just for defensive ends:
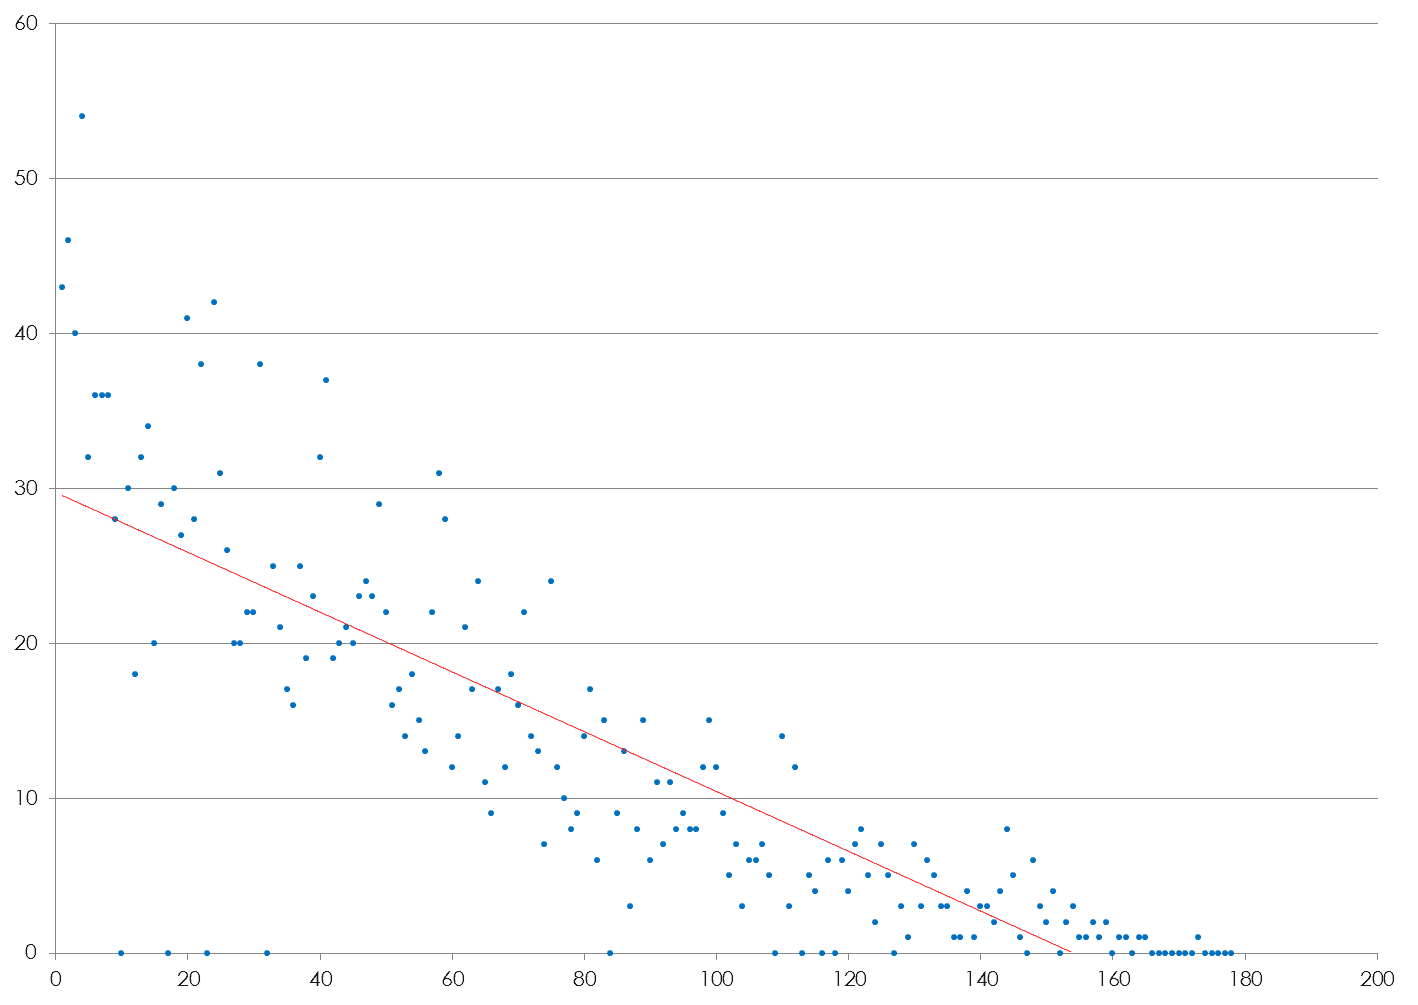
Again a negative correlation but this one is easier to get your head around. If you’re calling plays against a team with a good end and a bad end (let’s use the Bengals as an example with good Carlos Dunlap opposite bad Michael Johnson) which side do you run against? Of course it depends on lots of other factors but mainly you run against the bad player right? There’s less chance of him blowing your play up. Put simply that’s exactly why worse NFL ends get more tackles. So you pick bad players and get more tackles right?
Wrong. Here’s the same data for all other positions showing a positive correlation:
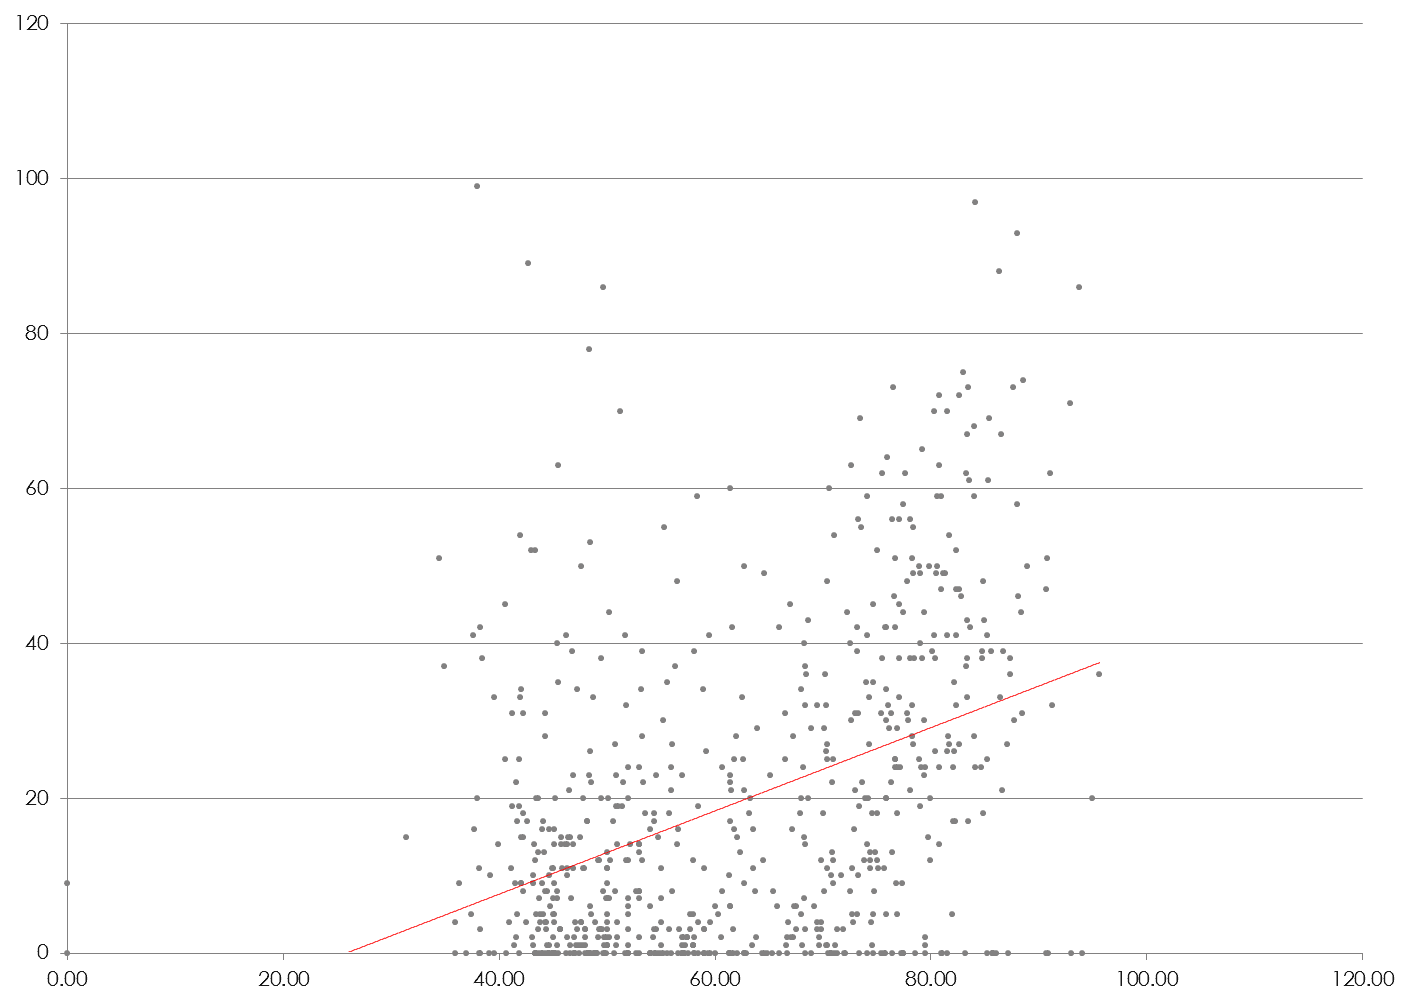
Each of the other IDP positions (DT, LB, CB and S) all have positive correlations. Broadly the ‘better’ those players are the more tackles they get. Of course most NFL players aren’t simply trying to rack up tackles. They have other responsibilities. Fortunately our friends at PFF give us more data than just a grade. They can tell us how good players are purely in the run game. This is how tackles correlate against run stopping grade:
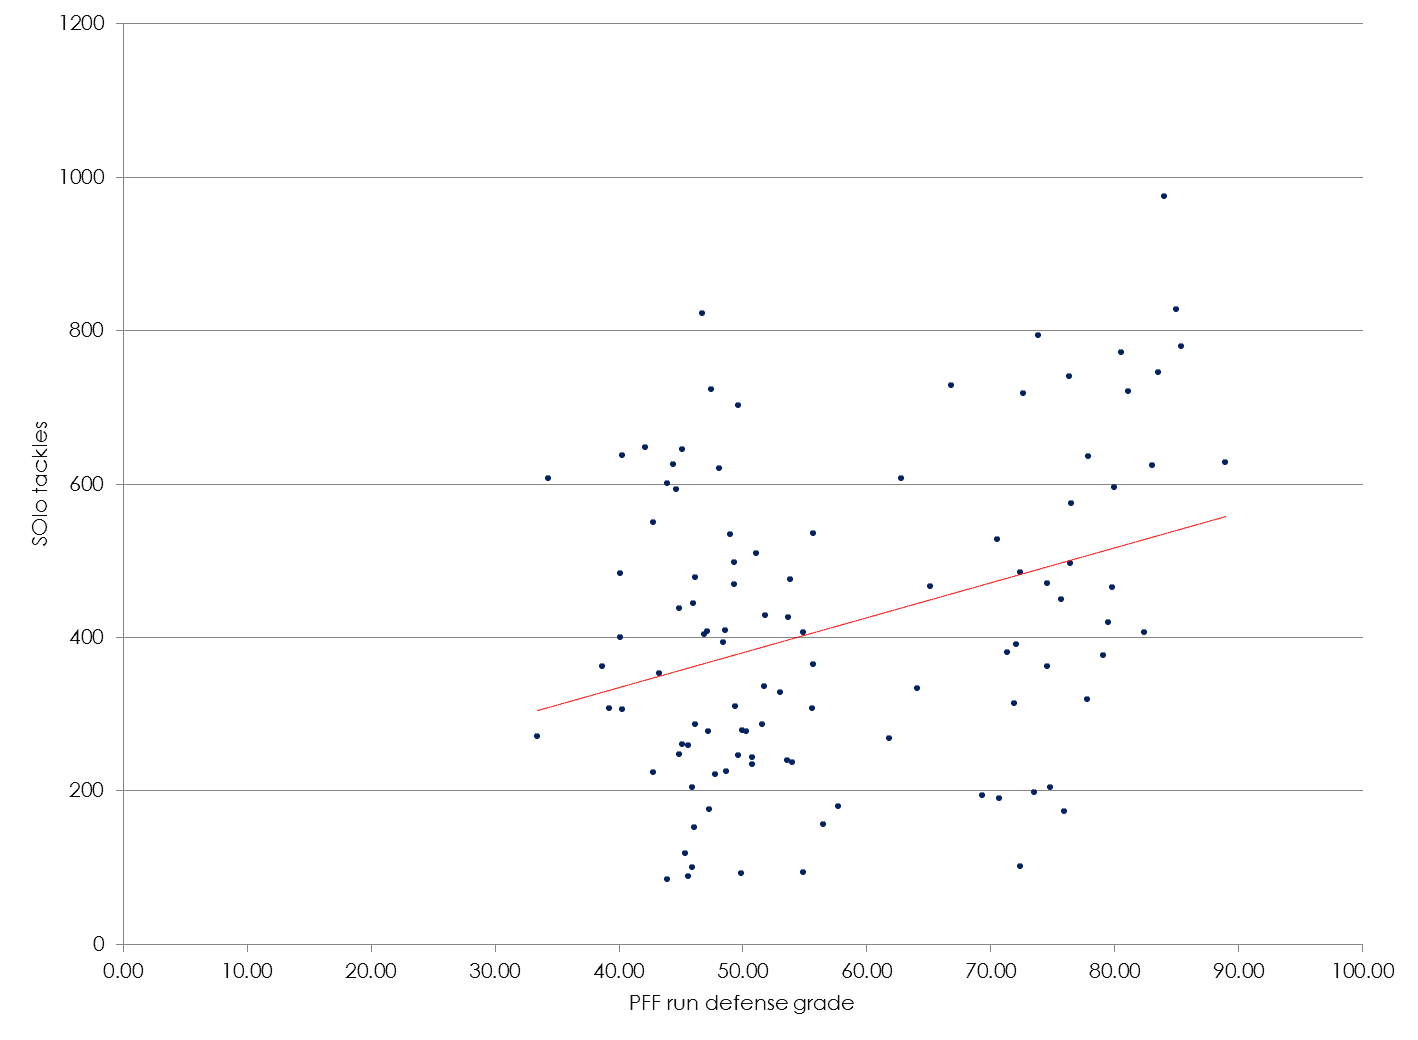
Interesting. There’s definitely a positive relationship here but it’s not clear. That holds true across all the positions but the clearest relationship is with safeties:
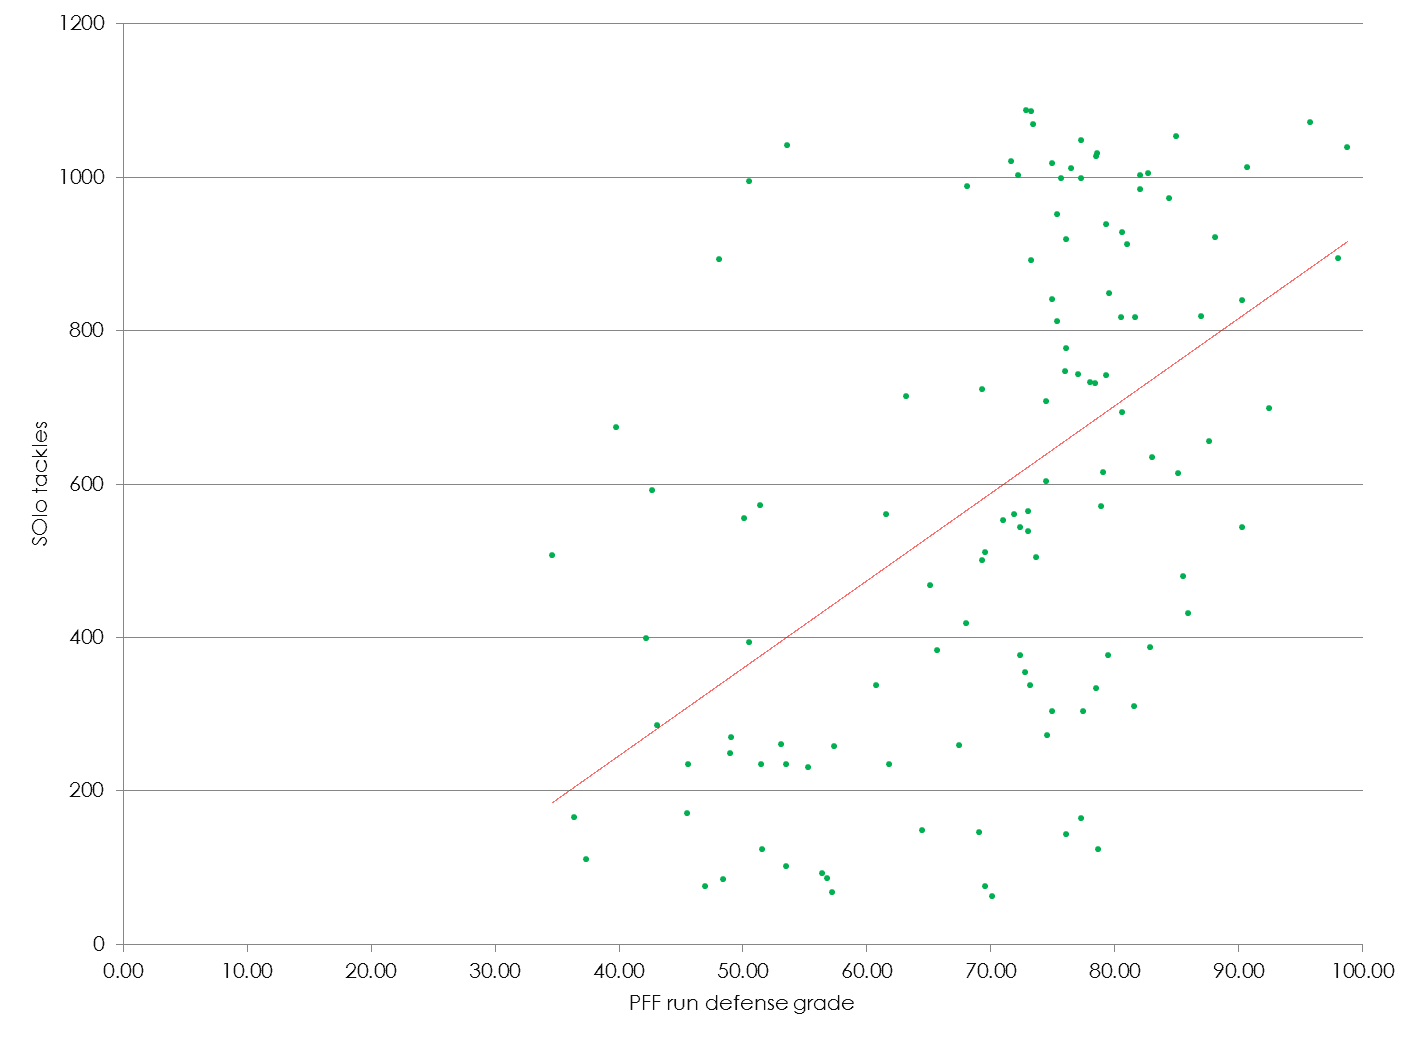
As any self-respecting IDP-head knows you want safeties that are good in the run game. They might not be as integral to modern NFL defenses as free safeties are becoming (witness the Seahawks being able to play well without Kam Chancellor but being crippled without Earl Thomas) but for fantasy purposes that’s where the value is.
So the takeout from this is:
- Ability in the run game is definitely a good indicator for players who will rack up tackles for you.
- Mostly you can pick better players and they’ll get more tackles for you.
- With defensive ends then the ones who play the run well will give you a better floor than pass-rushing specialists
Efficiency: Tackles per snaps
We’re not in the business of evaluating players as an intellectual exercise of course. We’re in the business of working out which players will score fantasy points for your teams. Working out which positions will get tackles is easy. The next question is how can we assess which players within those positions will be better at recording those tackles than others?
This is where efficiency comes in of course. Here I’m specifically talking about tackles per snap. This is how the two stats correlate:
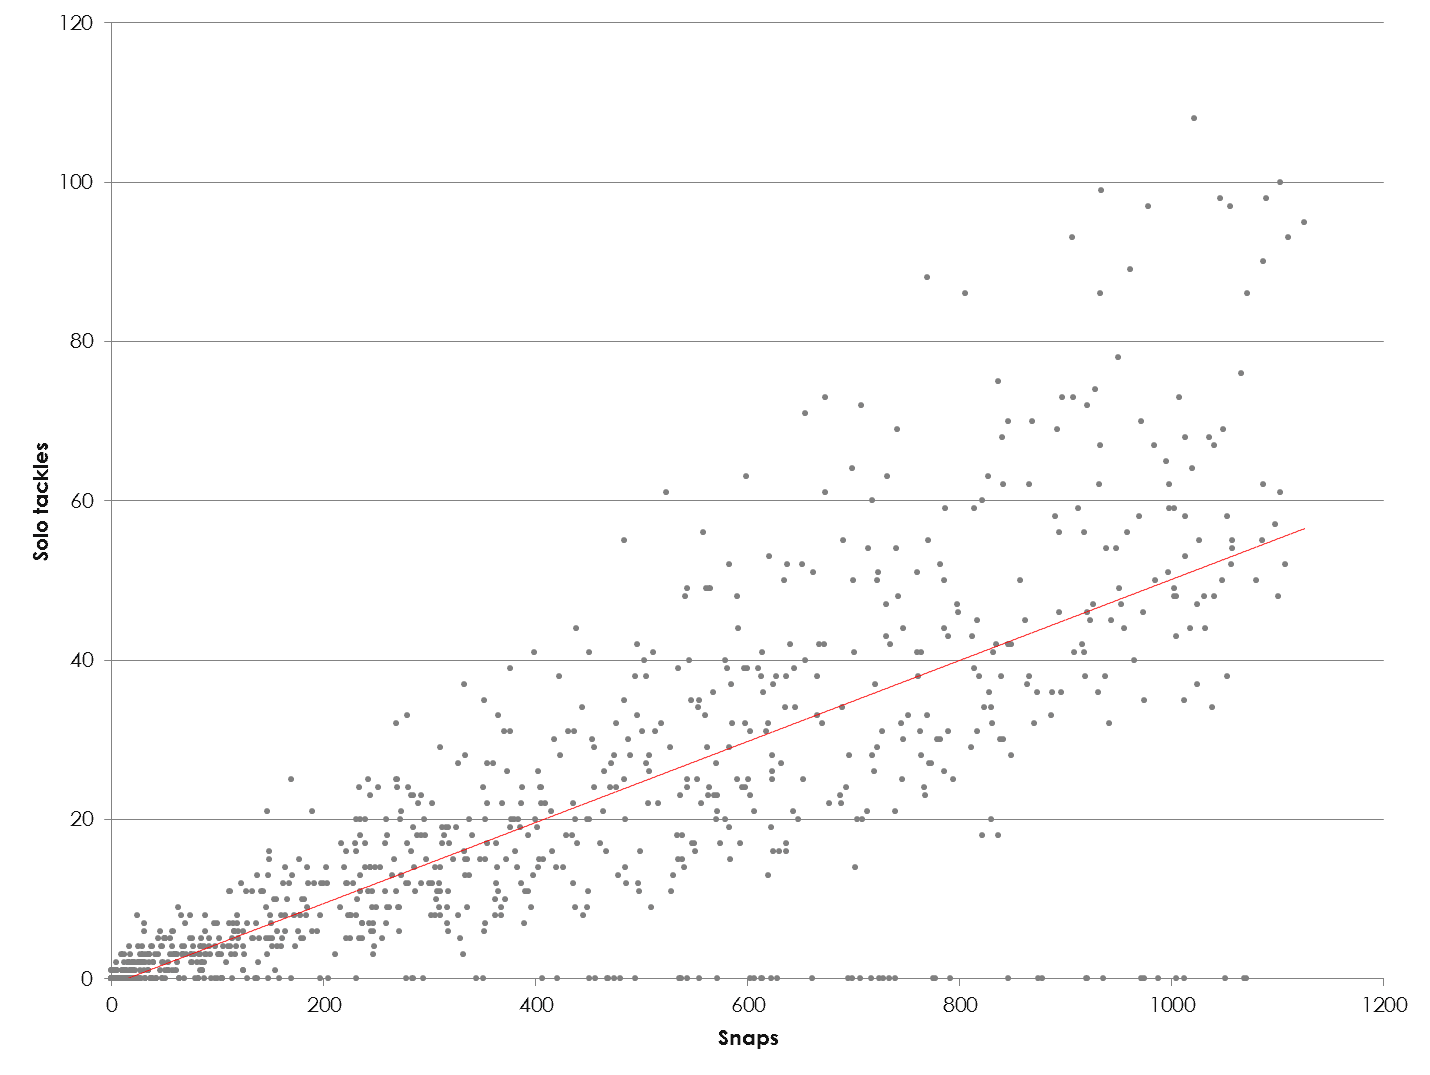
So obviously anyone above the line is more efficient than average whilst anyone below the line is less efficient than average. The key is being able to predict which players are in which category within the roughly 1,000 defensive players used each season. A great deal of fantasy players just rely on name value to do this. Every time you see Von Miller or Richard Sherman drafted way too early that’s what’s going on. But that’s rarely sensible. Too often it results in you either drafting players on fame rather than production or buying them at peak price.
Efficient tacklers
To work out breakout players, we need to set benchmarks. To do that I’ll be setting my base population as all defensive players in the NFL who played more than 200 snaps in 2016. To give you an idea of where that cut-off is it includes 597 players. Just missing out were people like Bene Benwikere, Eddie Goldman and Stephone Anthony.
The average efficiency figure for those players was 0.05. i.e. IDPs recorded one solo tackle for every 20 snaps they were on the field. Our job is to find the opportunities within that.
Defensive tackle
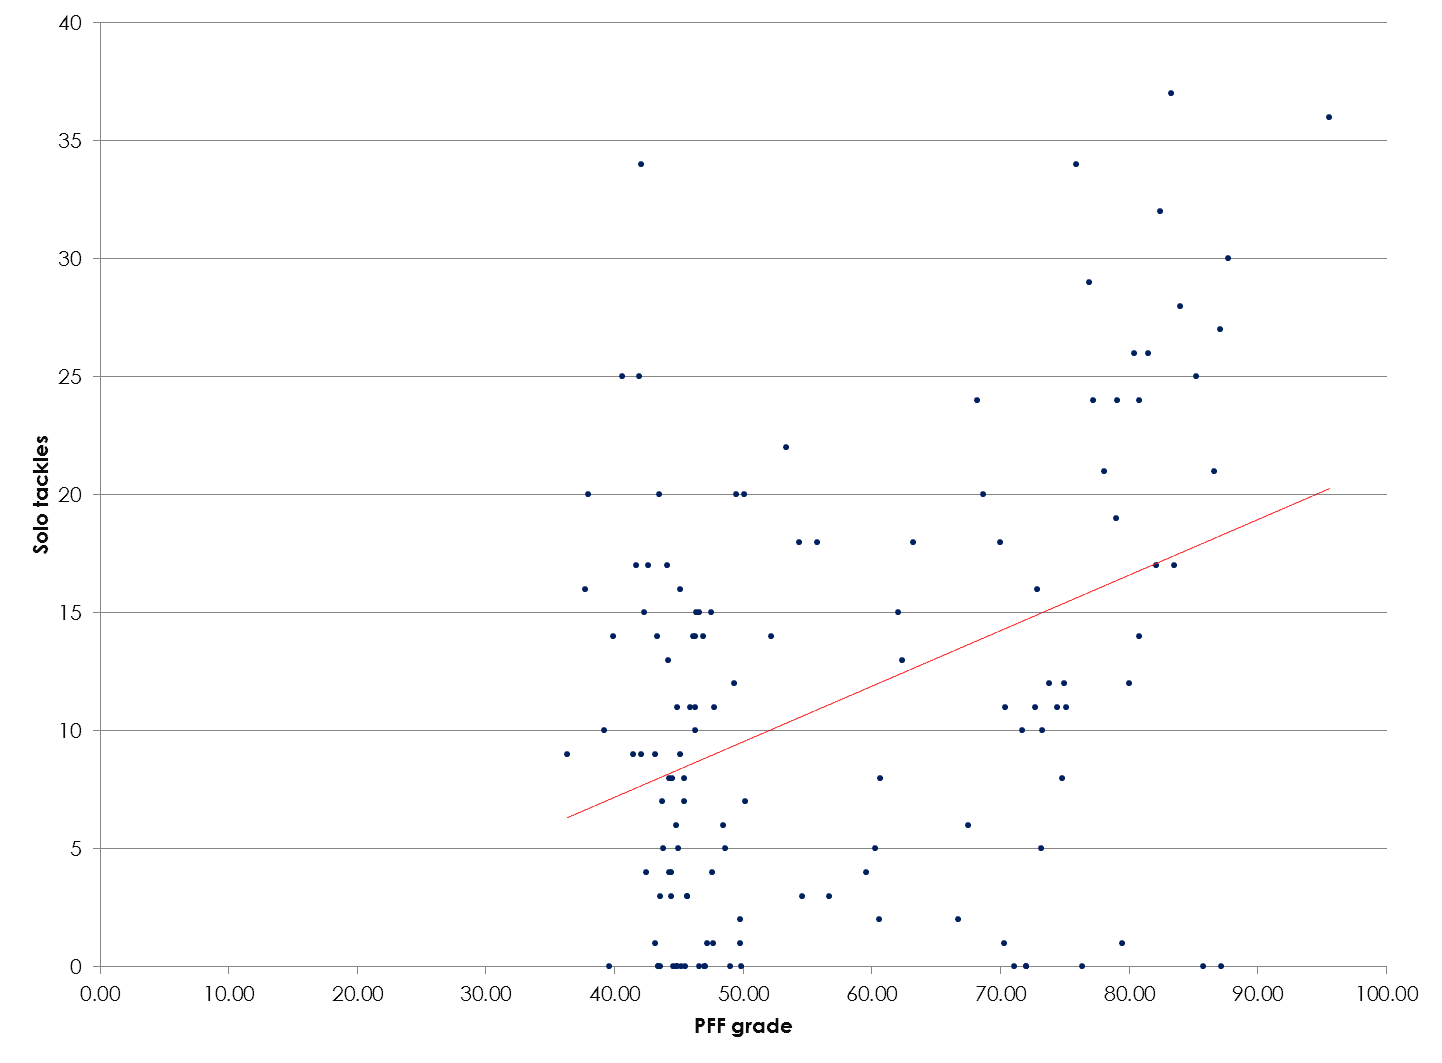
So we can see that there is a correlation with defensive tackle’s overall grades. When you break it down further that relationships gets less clear. Basically, you can get tackles out of run-stoppers as well as pass-rushers at DT. However we also know that the role of a DT in a 4-3 scheme is pretty different to a nose tackle in a 3-4. And you can see that in efficiency split by scheme here:
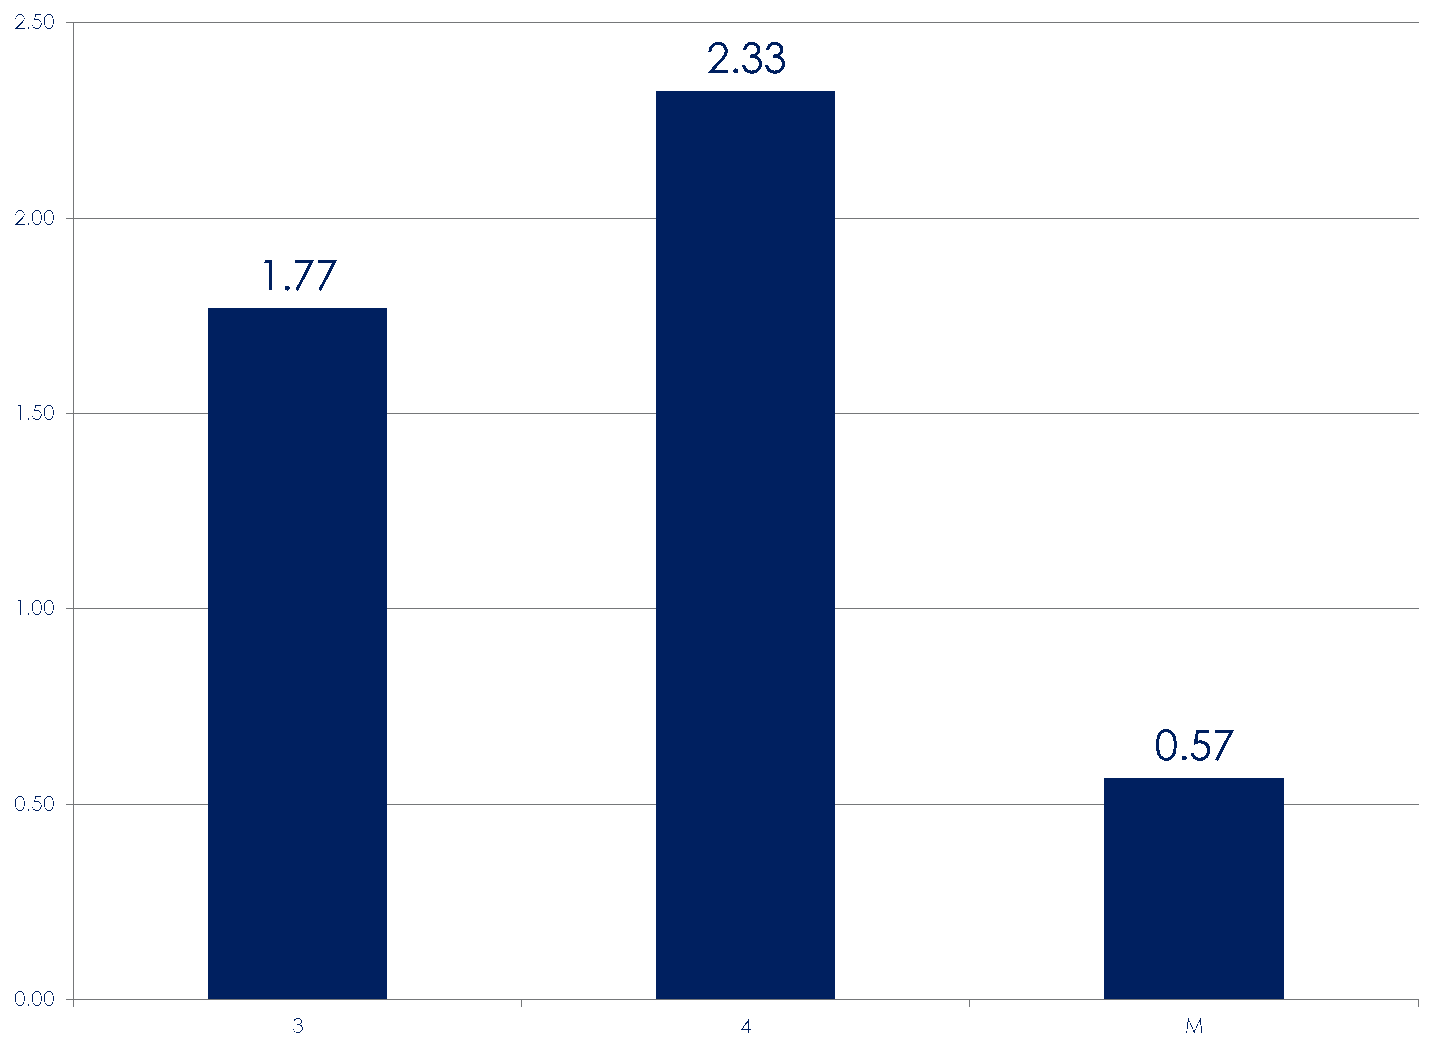
So essentially continue as we all currently do here. Look for pass-rushing 3-technique/under-tackles in 4-3 schemes.
Defensive End
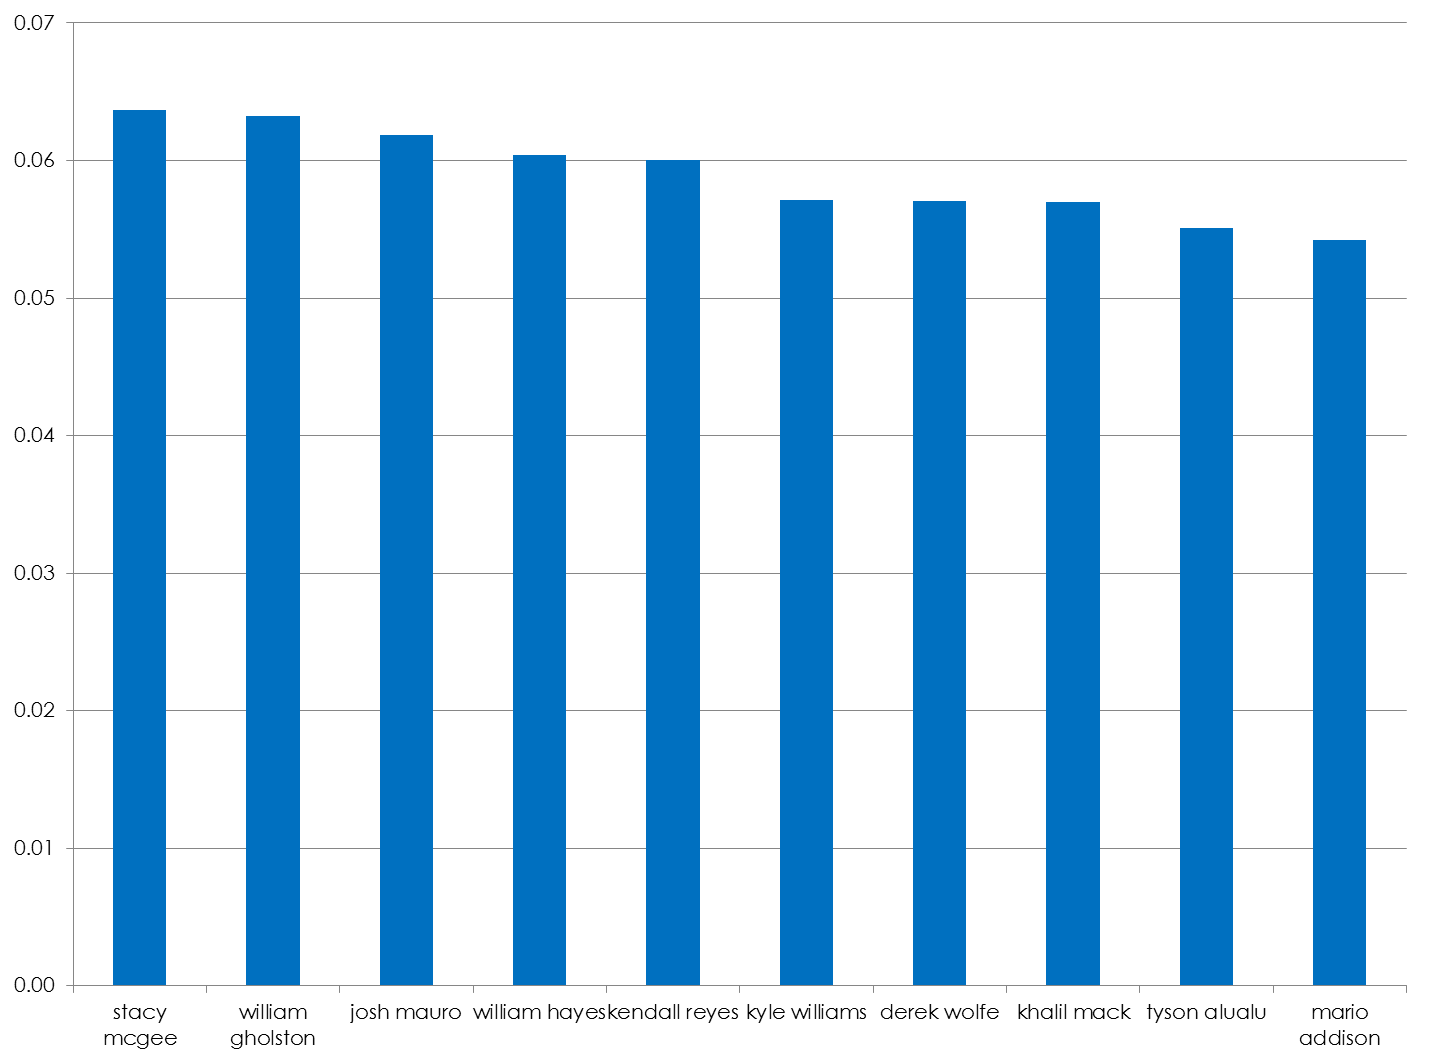
As we saw earlier, there is a clear inverse relationship between pass rushers and tackles within the DE position. As such there are only two top pass rushers within the top ten here (Khalil Mack and Mario Addison). It should come as no surprise to you that the non-sexy names here are the more efficient at making tackles.
Additionally 4-3 base DEs tend to be much more efficient in the run game. So to find breakout players you simply need to identify players in a 4-3 base scheme who play high volume but are NOT known for their sack rates.
Linebacker
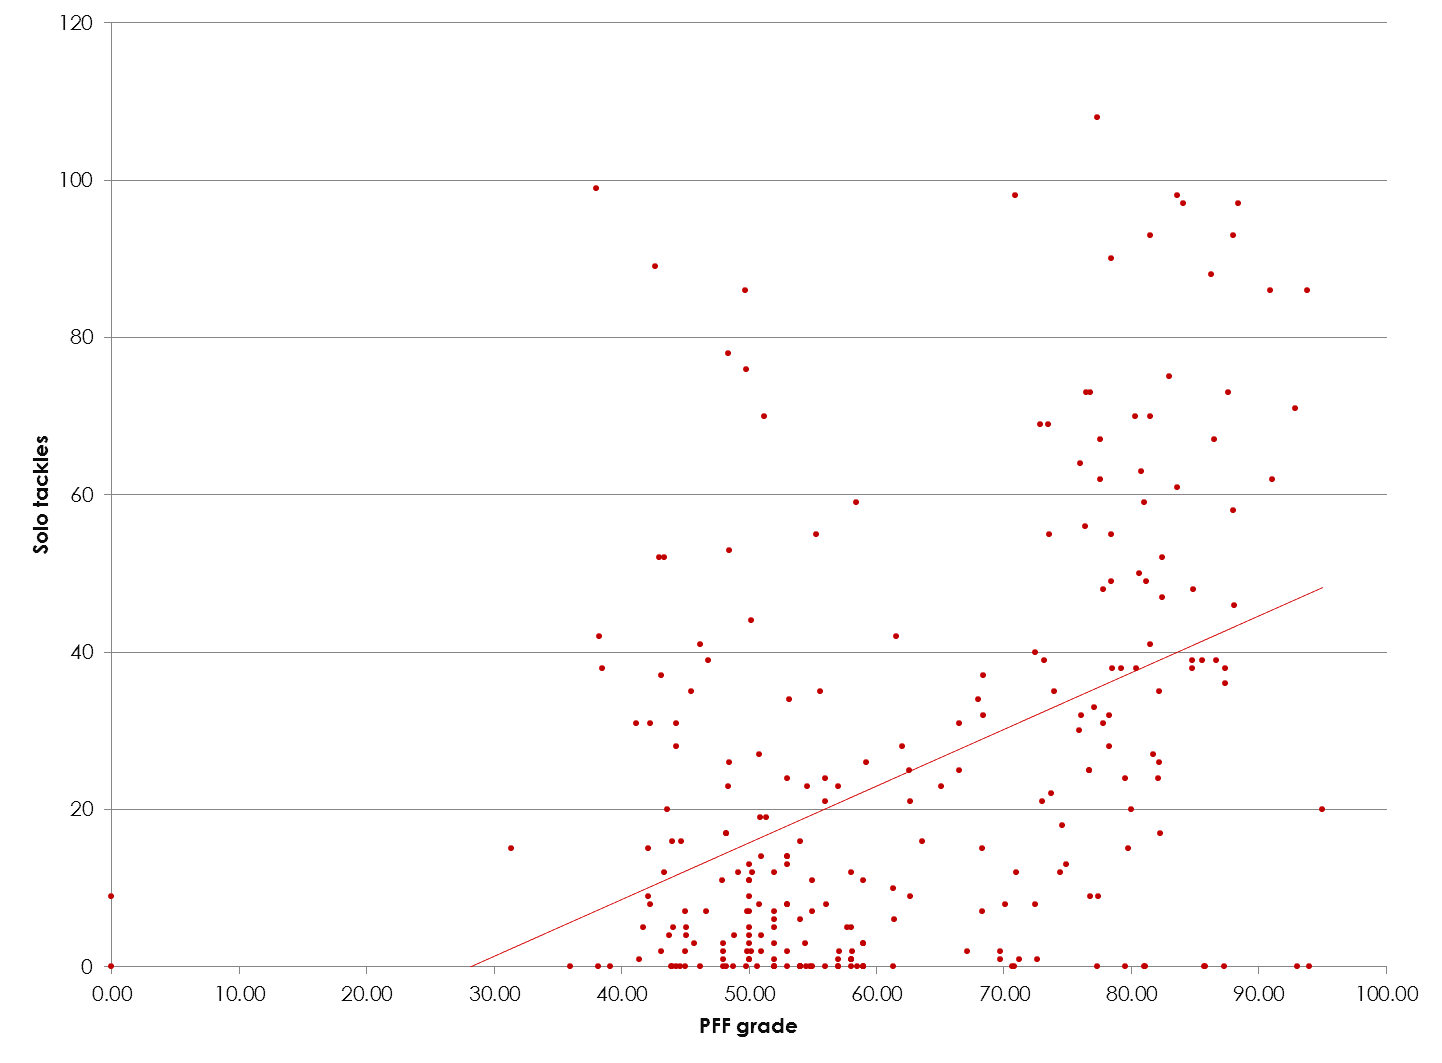
There is a strong relationship between overall grade and tackles. This doesn’t sound unusual, but we saw earlier the inverse was true of DEs. Whereas that is down to teams running at bad players linebackers as a group have much more ability to make plays where breakdowns occur elsewhere.
Here’s the top ten efficient LBs from 2016:
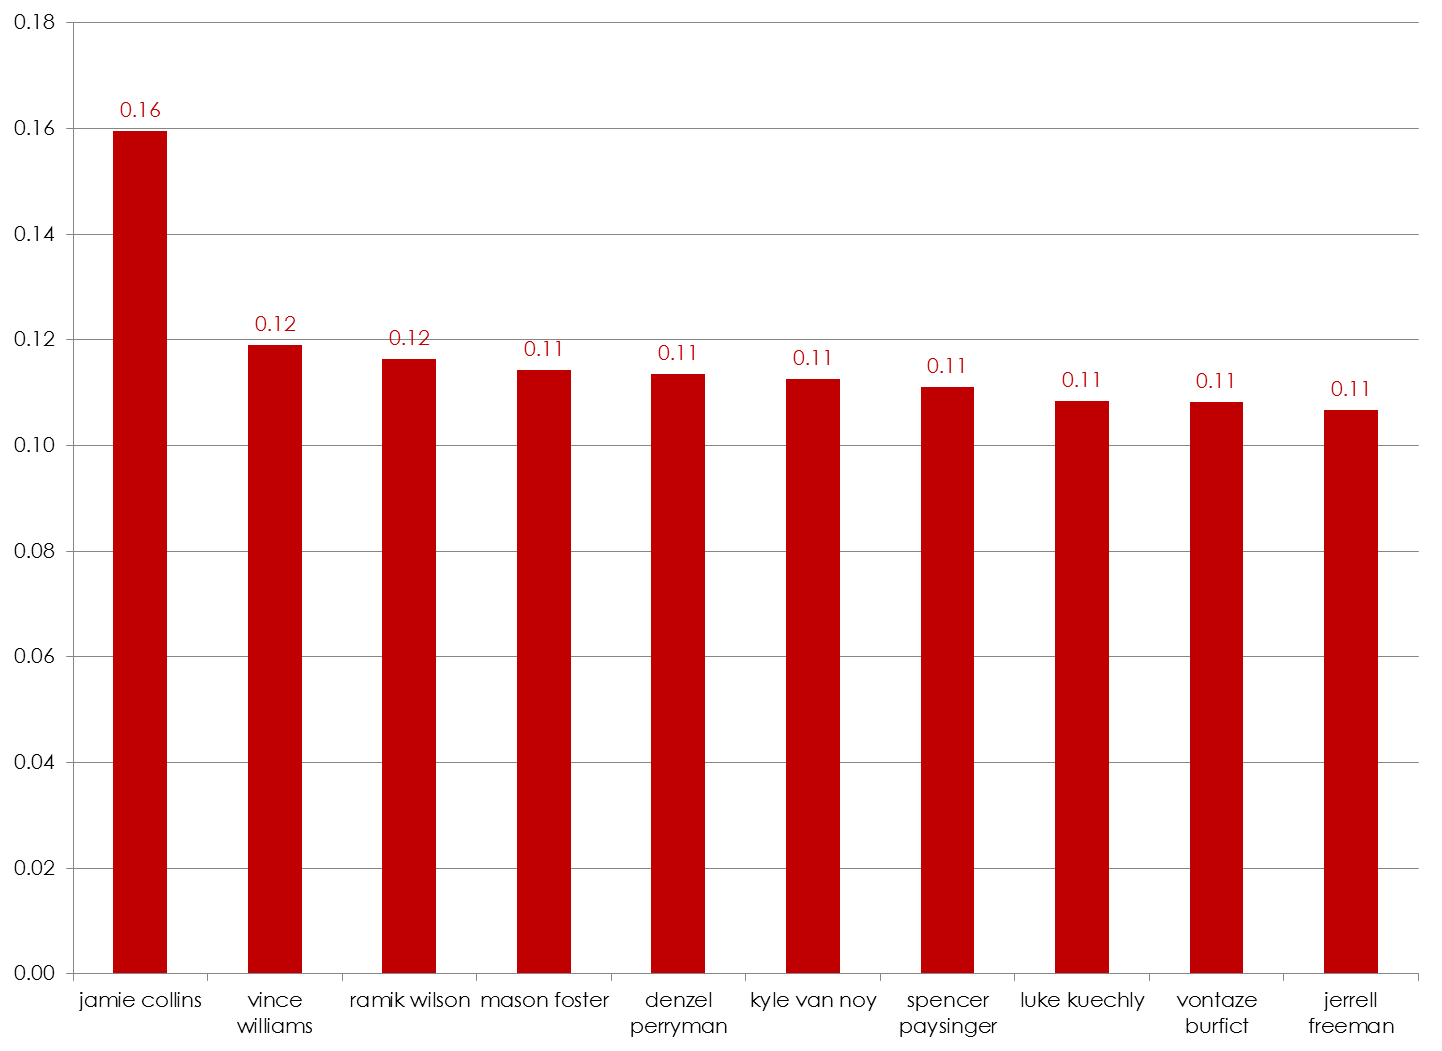
Interesting eh? Jamie Collins tends to have a reputation as a big play specialist but he managed to be a terror against the run for the time he was on the field. It’s also worth noting that there aren’t many run-stopping specialists here. You could argue Denzel Perryman and Vince Williams but apart from that these are players who are good in coverage. To be a really effective LB in solo tackles you need to be the first player on hand to mop up tackles after receptions have been made. Here’s the league LB data sorted by team:
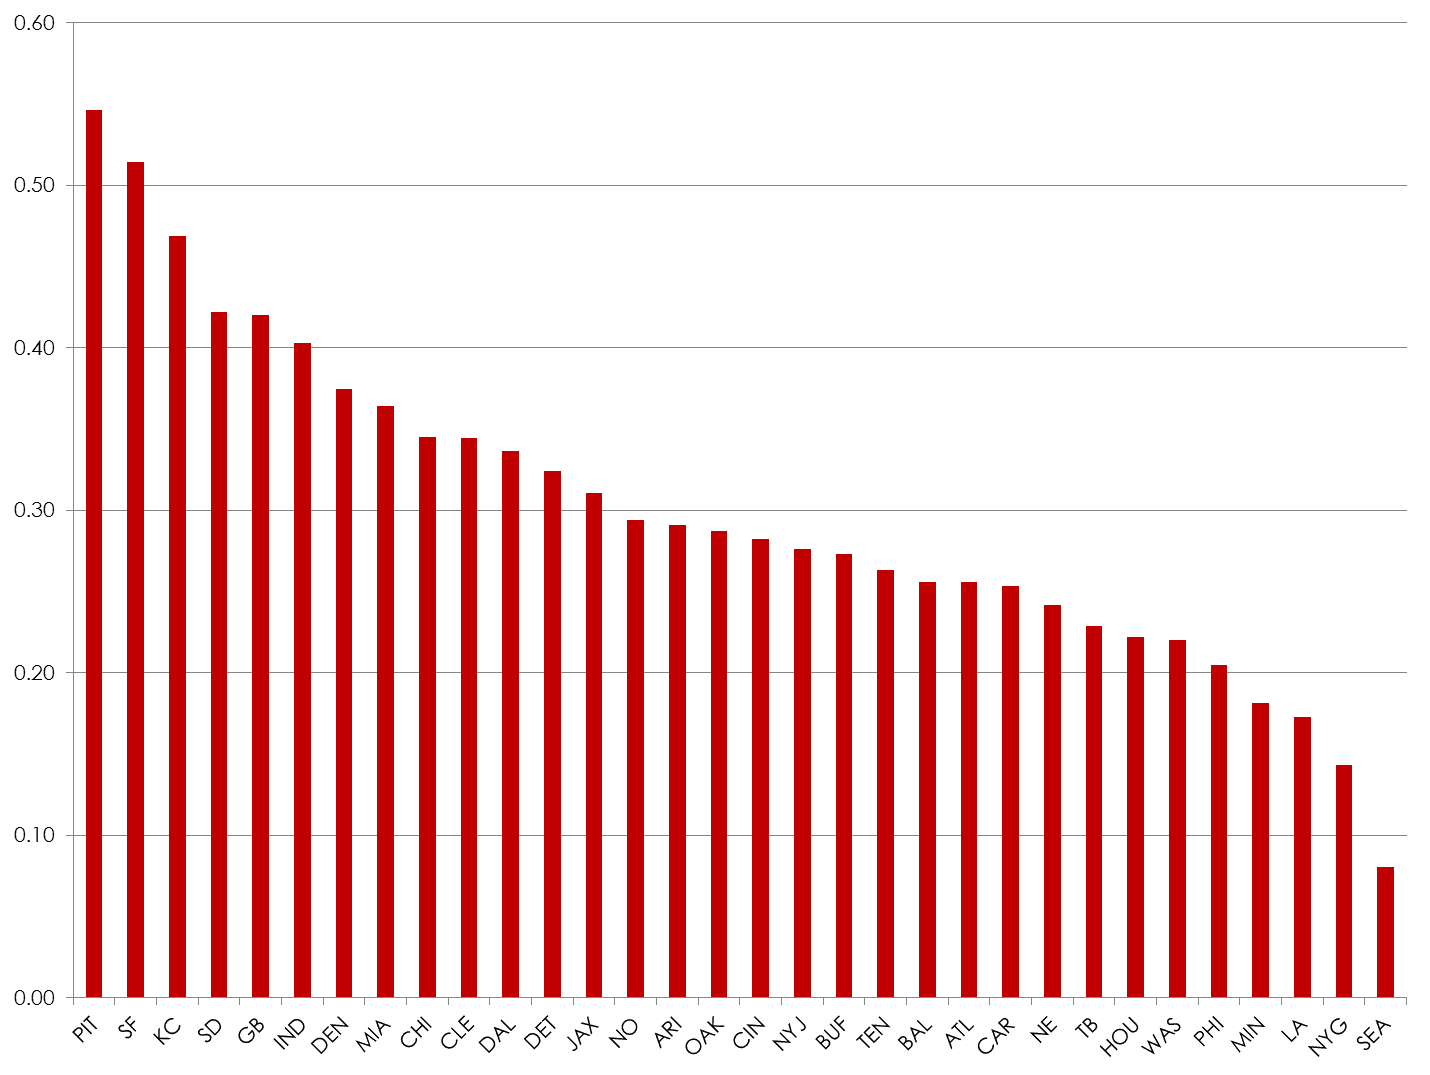
The Steelers and Chiefs are really high here. Given how much zone defence they play this meshes with what we’ve already seen. The LBs you want are no longer the hard-nosed, run-stopping Brandon Spikes’ of the past. You want LBs who can sit in zone coverage and flow to the ball.
Age
In dynasty football we all have a clear preference for young players because we think we can plug them in and leave them for a decade or more. This is how NFL defensive stats broke down by age between 2010 and 2016:
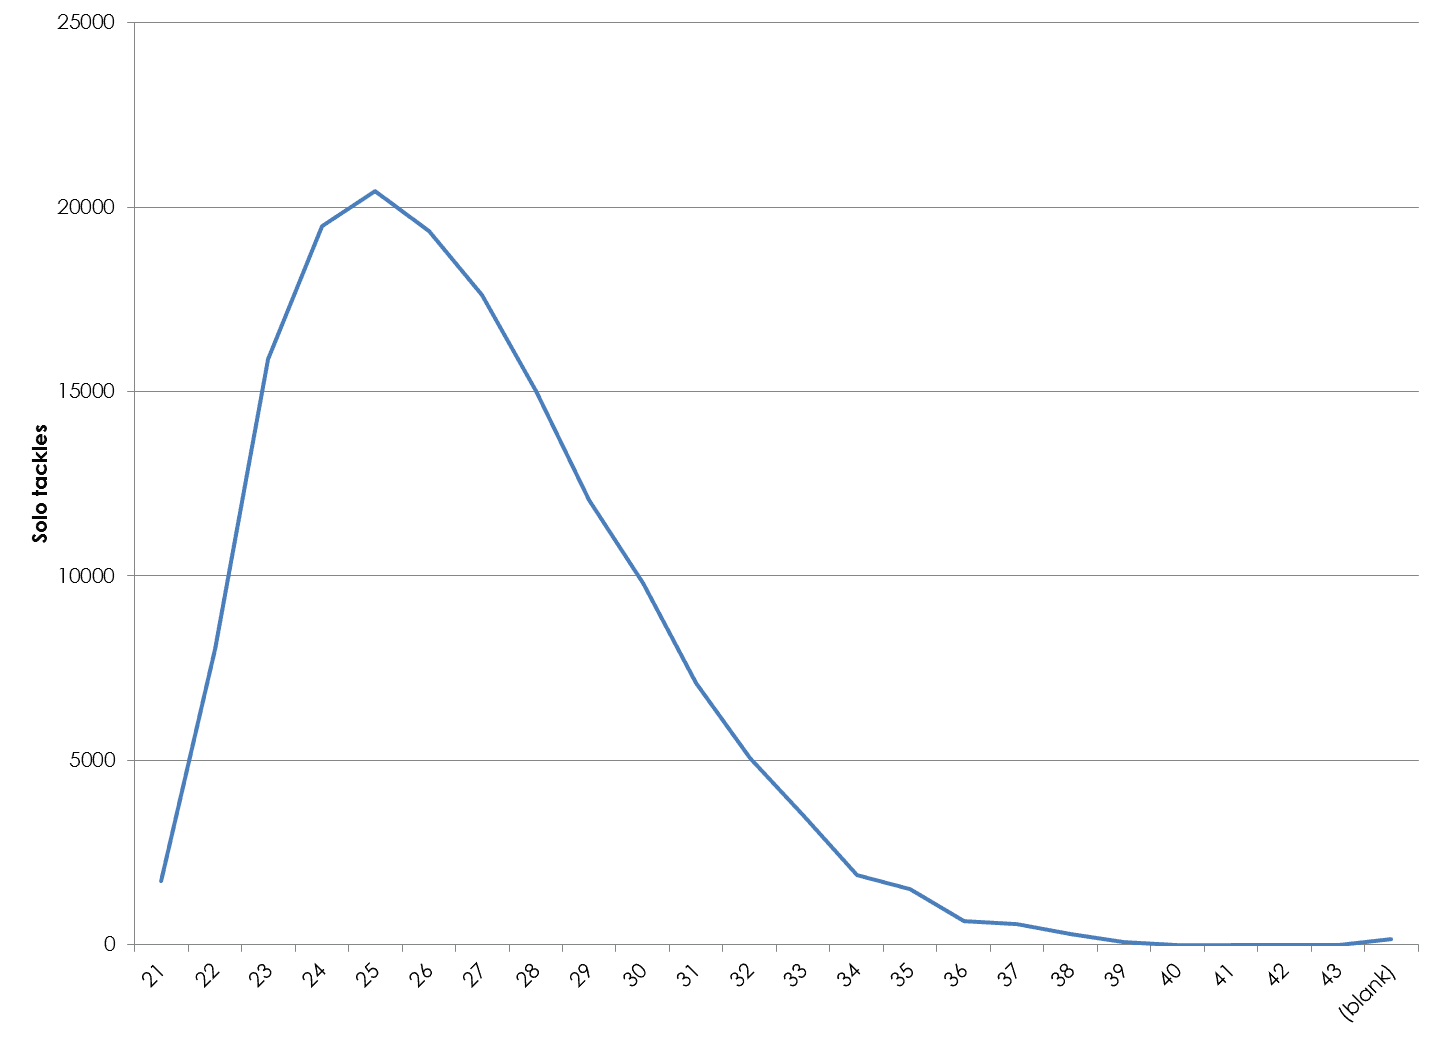
You can see there’s a sharp drop-off after 26/27. So although the players that do manage to stay in the league tend to keep producing at a decent level there are a great many players who just don’t produce into their late 20s.
Summarizing
Tackles are a funny stat. We all think we understand intrinsically what they are and how they come to be on the football field, but actually player quality is often fairly separate to production. They key is understanding what sort of players tend to produce well, how important tackles in your particular league settings and how much you therefore concentrate on finding them as opposed to players who produce other stats.
My recommendation is to try and divorce your preference/distaste for individual players during the off-season and try thinking of them as team slots. I.e. Panthers Linebacker #2 rather than Thomas Davis.
Tackles tend to create a lot of IDP’s floors. Hopefully when you’re looking for players this data will allow you to make fewer mistakes and find more players who are at least productive.
Good luck!
[/am4show]
- Ten IDP Fantasy Football Stats You Need to Know after Week 16 - December 29, 2023
- Ten IDP Fantasy Football Stats You Need to Know after Week 15 - December 22, 2023
- Ten IDP Fantasy Football Stats You Need to Know after Week 14 - December 14, 2023


