Dynasty Command Center: Making the Machine, Part One
In the last Dynasty Command Center, I outlined some of the issues I think prevent us from properly valuing (or ranking) players. These issues include bias (age and pedigree), groupthink, and mere ownership effect. My aim is to limit personal bias in player valuation, because when we are playing a long game (and we are) we ought to be investing in the right players, for the right reasons.
In this installment, we’re going to look at production.
Read this twice: the player values and ranks you will see in this article are only reflective of my production model. My entire formula for player valuation includes production, age from years of decline, pedigree, risk, and adjusted opportunity. You’ll get the final rankings, which are based on all the variables, in Dynasty Command Center: Making the Machine, Part Two.
Production – Laying the Foundation
[am4show have=’g1;’ guest_error=’sub_message’ user_error=’sub_message’ ]
This is a futures game, I get it. But answering the questions, “how does a player produce in comparison to peers?” and “how consistently is this player start-able?” are probably the most important things we can do to begin forming player values. Two common ways of answering the question “how does a player produce in comparison to peers?” are:
- Total player points
- Average player points per game
Each of those methods has its merit. Total player points refer not only to production, but inherently account for player availability. Except in rare instances, total points leaders are not players who have missed a significant number of games. However, total points do not give us any information about a player’s consistency. Total player points also can be misleading because the most productive players on a per-game basis may have been injured or suspended, allowing a less productive, but more available player to end up with more total points at season’s end.
Analyzing average player points per game gives us information about who was producing at the highest levels when on the field. This levels the analysis to a per-game evaluation of effectiveness; however, we now lose the inherent information about player availability (is 15 points per game based on one appearance or 16?).
My biggest problem with using total player points or average player points per game is that neither gives us any information about how consistently a player is start-able, and I believe that’s the most important measure of a player in weekly, head-to-head style dynasty football. It looks like that’s what the clear majority of us are playing, too:
Across your dynasty portfolio, the majority of your leagues are:
— Curtis Patrick (@DynastyCommand) February 15, 2017
Considering your entire dynasty portfolio, in the majority of your leagues you:
— Curtis Patrick (@DynastyCommand) February 15, 2017
Now that we’ve established we’re all basically playing the same game, let me share how I think we can do this better, or at least, differently.
Head-to-head style fantasy is a high-floor game. Weekly lineup setting is a high-floor game. We should be evaluating player production in terms of how consistently a player is start-able! I’m not saying total points aren’t important. At the end of the season, that 46-point outburst in week six could make the difference in a total points style tie-breaker. However, the path of least resistance to the playoffs is a great win-loss record, and the path of least resistance to a great win percentage is players who consistently turn in start-able performances.
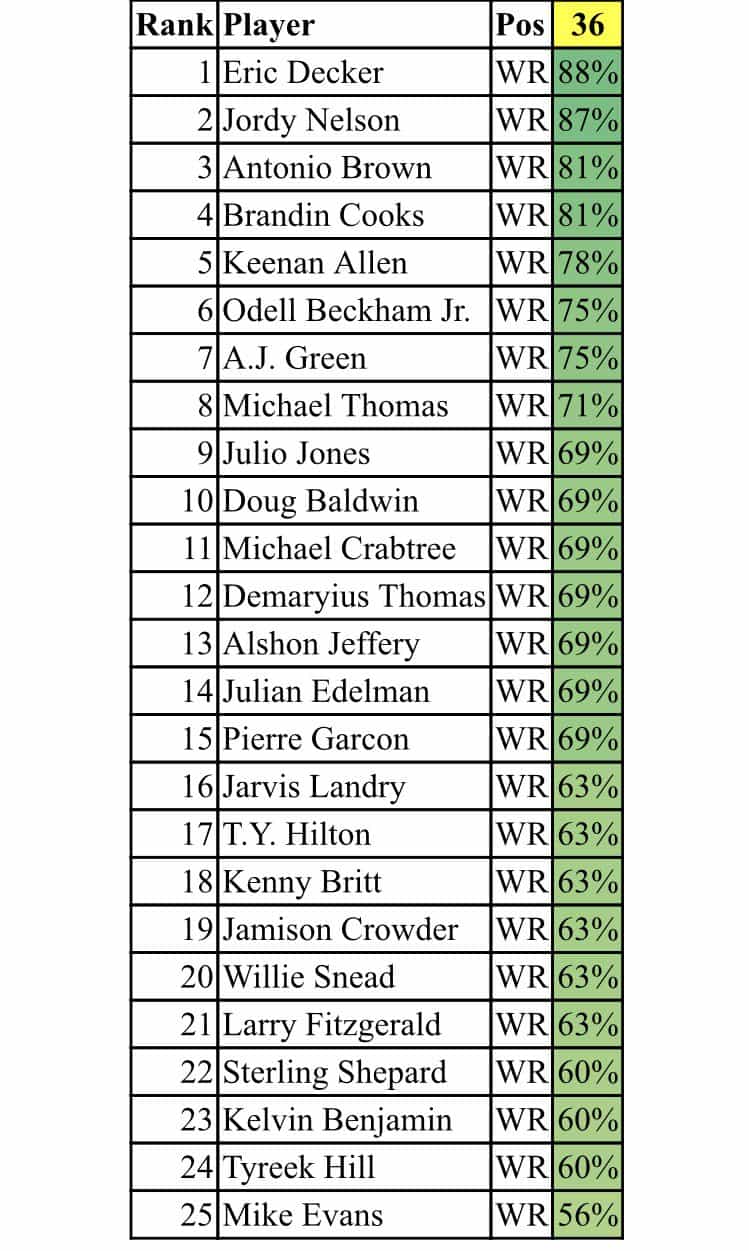
Let’s consider the wide receiver position. A typical league requires three WRs to start per week. I’m going to begin measuring wide receiver production based on the frequency with which a player finishes in the top-36. If a wide receiver finishes outside the top-36 in a week, he wasn’t a preferable play, so from now on I’m not giving players any credit for production if they finished at WR37 or below. Zero credit.
Instead, I’m building a production profile using top-36 finish percentage using a player’s most recent 16 games. If a player missed time in 2016, then I will fill in the blanks for these production gaps with 2015 production (again, only using up to a total of the 16 most recent games). There will be some players who still do not have 16 games in aggregate, even using the two seasons. However, I’ll be penalizing these players later for the games they missed via a “risk modifier”. We’ll discuss that in a subsequent installment.
Using only top-36 finishes in the manner I explained above, here are the top-25 WRs in dynasty:

Obviously, there’s a problem. Only using top-36 finishes ignores player ceiling altogether and just ensures we are getting at least the bare minimum acceptable value from a player. As I workshopped through this issue, I eventually determined that top-36 is the right place to draw the line, but higher finishes need to be parsed and receive greater weight.
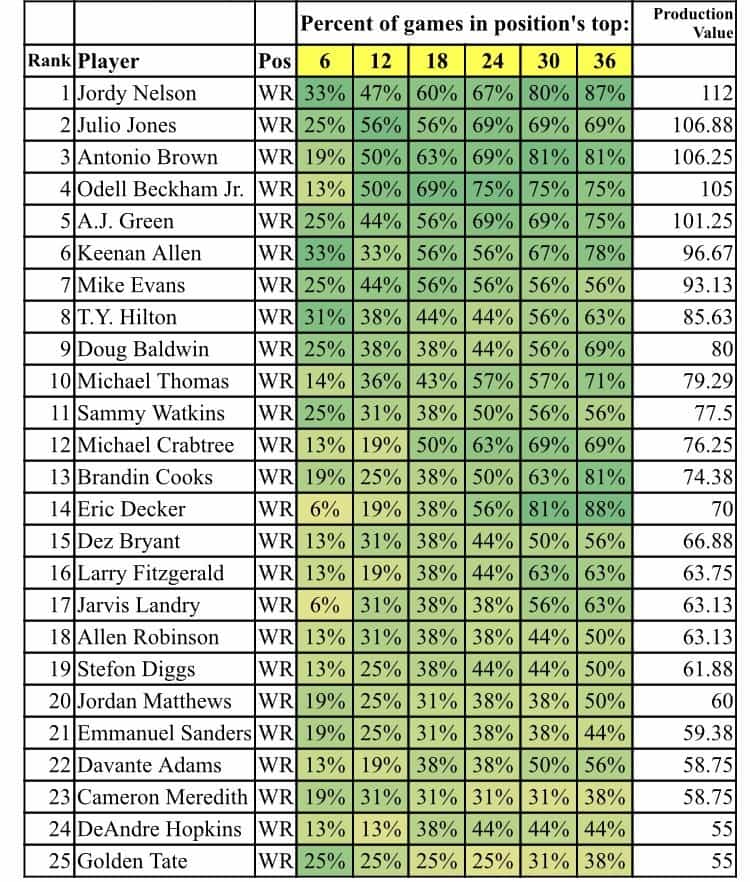
My final formula for player production value is an equation which assigns value to all top-36 finishes, but gives higher finishes considerably more weight:
6(Top 6%) + 5(Top 12 %) + 4(Top 18%) + 3(Top 24%) + 2(Top 30%) + (Top 36%) x100
Based solely on my production model (and ignoring all other modifiers I mentioned earlier in article), here are the top-25 WRs in dynasty:

In the next installment of Dynasty Command Center: Making the Machine, I’ll show you how I developed modifiers to account for a player’s remaining years from age of decline, pedigree, risk, and adjusted opportunity. Each of these modifiers plays a very important role in the final player values, so as you can imagine, the list you see above will look much, much different next time.
Curtis Patrick
[/am4show]
- Mount Bust-More? Historical Context for 2017’s Early First Round WRs - December 28, 2017
- The Return of Josh Gordon - December 2, 2017
- Player Value: Two Wide Receivers Who Might Never Be Cheaper - September 15, 2017


