Editor’s note: This is the final piece in a three part research paper. Check out part one and part two before you proceed.
DISCUSSION OF FINDINGS
Obviously, while the outcome is not entirely unexpected given what I believed coming into the project, a model that beats the draft by a wide margin is an audacious enough result that it caused me to go back to both professors to review my approach. In addition to those reviews and the subsequent vetting of this paper, I believe there are several reasons to expect these results will hold up to a more rigorous review:
- Everything reported here has been cross-validated.
- In addition to walking both professors through the process and presenting it to the entire department, I also went back to the original data and worked through it from scratch again to document the process and replicate the original results.
- Calling what was in my head a hypothesis would be too strong, but I had a clear image of the relationships in the data and the model is a good step forward in terms of representing that mental image. The formal model is backed by intuitively simple ideas.
- The break points defining WR types and variables segments weren’t arrived at via trial and error or optimization during this analysis. The final models are the first formal models built using the segmented records and segmented variables, and many of the break points were similar to those used naively for the last few years.
With all that said, if these results are correct they may represent only a partial realization of the total lift available over draft position:
[am4show have=’g1;’ guest_error=’sub_message’ user_error=’sub_message’ ]
- Sample sizes are too small to fully replicate the naïve models, but I believe those models are better than the one presented in this paper. Fortunately, the available sample will continue to grow each year as more players enter the league.
- Using the best two of a player’s first five years in the response variable may overstate the value of draft position as a predictor. The best measure of a player may be what he does after his rookie contract, and with the passage of time we’ll be able to shift the response variable to the best three of the first six years, best four of eight, etc. to capture more data from the “second contract” period.
- Since the break points defining WR types and variable segments weren’t arrived at via trial and error or optimization, there could be some marginal value to tweaking those breakpoints or segmenting the variables differently.
SUBSEQUENT WORK, IMPROVED RESULTS & LIMITATIONS
Despite having finished the practicum and made a final presentation, work to improve them continued afterward. Those findings are presented here.
“Physical” and “Developmental” Latent Variables: In addition to exploring neural networks, I wondered what might happen if the variables were combined to create two latent variables (variables that are not directly measured, but inferred from other variables that are directly measured) – physical and developmental:
Physical Variables – Height, BMI, Size, Speed, Explosion, Agility
Developmental Variables – logDraft, Age, Volume, Skill
Grouping the variables this way, running separate stepwise regression for each vs the response variable, and using the output of those regressions as inputs in a new model improved the overall results significantly. Taking the best available result for each WR type using different permutations of this approach further improved the total lift vs draft position:
(Note that the raw totals reported here are not directly comparable to the raw totals in the table above due to a change in the response variable that shifted the total error downward across the board.)
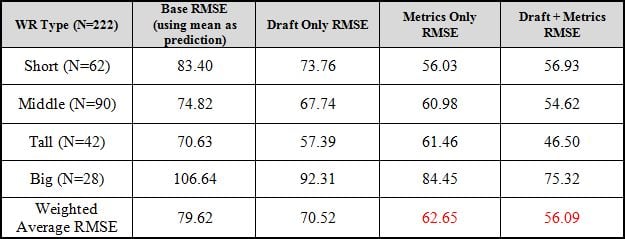
Again, the raw numbers can’t be compared across the two tables due to an improvement in the way the response variable is calculated, but the overall lift here compared to draft position alone is now approximately 160%.
It’s possible that some of the lift is due to measuring only the receiving component of a WRs value (and not blocking or special teams value), but similar improvement shows up even looking at only early round picks (who are presumably being drafted primarily for receiving skill).
One interesting item in these results is that when the data is organized in this way it’s possible to beat draft position without using draft position as in input.
A second interesting finding is the relative value of draft position vs the metrics. If the error reduction provided by the draft only (9.1) and the metrics only (17.0) were summed it would result in a total error reduction of 26.1. Given that the actual error reduction for draft plus metrics is almost as large (23.5) it implies that there is very little overlap between the two – that draft position has historically measured something valuable, but has made relatively little use of the quantitative data available.
LIMITATIONS OF THE RESEARCH
There are a couple caveats in terms of actually using these models. First, they were built using data from 1999-2011, so don’t reflect what’s happened in the last four years. Given the explosion in big data and analytics it seems likely that draft position increasingly reflects these findings and that it will become increasingly difficult to beat draft position going forward. And in fact in 2013 and 2014 the average “development” score (the output of the developmental variables component of the model) for drafted WRs has gone up by nearly 50%.
On the other hand, it seems likely that looking at additional or improved inputs in a new way might improve these models even further.
The second caveat is that there’s a large portion of the original dataset for which the data is incomplete. In some cases missing data can be estimated or may not be relevant, but in many cases missing values mean that a prospect can only be modeled less formally.
Finally, these models were built as an approximation of a naïve model developed via intuition and years of playing with the data informally, and there are instances when the output is wrong (where predicted values for a player don’t match the NFL career outcome) for reasons I believe are explainable. In particular I believe that the sample size limitations preventing the data from being subset into 10 or 12 WR types result in higher average errors than might be realized with a larger data set.
Regardless of the limitations, these results demonstrate the importance of quantitative measurements and that data from a player’s NCAA career and the NFL combine can be used to improve on more subjective methods and that draft position, at least through 2011, has not realized the full value of that data.
[/am4show]
- Beating the NFL Draft: Part Three - April 15, 2016
- Beating the NFL Draft: Part Two - April 14, 2016
- Beating the NFL Draft: Part One - April 13, 2016

These three articles were a waste of our time and confusing. I pay for this site to see sleepers and value players to draft, so can we see more on this and about idp rankings. Thx
Sorry you thought it was confusing Al!
In terms of sleepers, after a couple fantastic drafts this year is a bad year for them IMO. But two worth a shot are Darius Jackson (RB) and Boehringer. Though the cat seems to be out of the bag on Boehringer, if he sticks with a team and can adjust to the speed of the NFL (no guarantees coming from so far off the radar) I think his closest comp is Vincent Jackson. Jackson was a lot bigger coming into the league, but plays at 230 pounds — which is about where Boehringer is today.
I liked these articles, personally, great job, Rob! I think the average fan and dynasty owner is just used to seeing more simplistic analyses such as a rankings list, or a draft profile with 3-4 bullet points each for strengths and weaknesses of a player, or even just reading a name of a projected NFL Pro Comp. I don’t have a stats background and I’d be lying if I said these 3 articles were the quickest reads I’ve ever had on DLF, but I really enjoyed the very in depth analysis. The inflections of BMI at 26 and 28 were particularly interesting to me, as I normally am a sucker for massive WR’s (proud Kelvin Benjamin owner reporting). For a WR, a BMI of 28.0 corresponds to 6’4 230, which is really as ideal of size as we as owners can ask for when scouting. Calvin’s combine recorded 6’5 239 corresponds to a 28.3, for example, confirming how much an absolute robot he was. Julio’s at a 27.5, while Moss was at 25.6, nearly at the other inflection point. And since you talked about Moritz Boehringer, I plugged in his height and weight and his BMI according to his pro day numbers is 27.6. Adds a bit more interest into his future for me, because he’s just physically so impressive, and although very raw, he’s FAR more physically impressive of a specimen as a WR than the last overseas sensation we dealt with, Jarryd Hayne at RB.
P.S: Maybe DePodesta is looking for a right hand man up in Cleveland! Send him your resume!
Thanks JK — appreciate the comments! I’m available if Podesta comes calling. 🙂
My general impression from draft watching is that there are absolutely teams using at least some of these ideas. Seattle, Baltimore, NYG, Dallas, New England, Pittsburgh (the last two say they don’t but I don’t believe them). And then they layer their own “subjective” scouting stuff on top of it. I think it’s a mistake if the scouts themselves start using this stuff though. Whatever they’ve been doing historically adds a lot of value and is a great stand-alone input. If I Ran the Circus, I’d hire a bunch of respected old-school guys, tell them to keep doing what they’ve been doing and to stay the hell away from anything like my article. (Win/win for them I think.) Then use the quant stuff as a separate input/filter.
On Boehringer, NFL Draft Scout added him to their database in the last few days so I finally modeled him last night (informally). If he can adjust to the speed of the NFL/the higher level of competition he’s a great prospect. I entered him as if he were a DIII player and he looks just like you’d expect him too. He’s a high bust risk, but his comps are great. Vincent Jackson is the closest overall fit but if he plays at ~230 he’s also a more athletic version of guys like Colston, Evans and Marshall. And the weak background doesn’t even hurt him as much as it might since reports are that he’s arriving in the NFL at 22yo.
So based on this, how would you rank the 2016 rookie wide receivers?
Coleman is my runaway #1 as long as he’s drafted inside the first 20-25 picks. Anything outside that would make me wonder what the NFL knows that we don’t. If his draft position matches the modeled projection he’s as clean as a prospect can get. Everything fits together just right.
Treadwell and Doctsun are higher risks than I like given the price, but it wouldn’t surprise me if either of them turned out to be great. Fuller would be in that same group, but he’s cheaper (at least today) and I like the risk/reward for him. Fuller makes me wish I had good numbers for Marvin Harrison.
If Carroo were clean off the field and being projected as an early pick I’d absolutely love him. But he’s got some obvious yellow flags and the fact that the NFL is reportedly considering him only worth a 3rd sort of confirms that.
I don’t really know what to do with Shepherd.
Wouldn’t touch Boyd, Higgins, Thomas, Miller and Lawler.
In terms of late darts Boehringer is absolutely worth a shot. As is Keyarris Garrett if he works his way into the 2/3 turn. Per the model Garrett has some non-trivial dings, but a highish draft position would make some of them go away and the price is right.
I thought this was a fascinating analysis. However, I can foresee something of a backlash if you aren’t going to actually use the model with real inputs (eg 2016 rookies) , but just define its statistical validation. Maybe a commitment to do that in the near future, might have been a helpful addition.
Yeah Steve — what’s the best way to present this data for public consumption going forward is something I struggle with. There are a few problems…
1) Key data is missing for a lot of prospects. If you remember from the first article my data set was 222 out of maybe 375-400 original records that weren’t pulled for reasons other than missing data. So almost half of all prospects don’t have something the formal models need.
2) Because there are only enough total records to subset the WRs into four groups, the models sometimes produce projections I believe are wrong for reasons I *think* I understand. Or at least have a hypothesis about — something that can be tested as we have more similar players come into the league.
3) There are still combinations of variables that are fairly unique — where there are few/no similar players who’ve come into the league in the last 18 years. This is less of an issue than it used to be, but still comes up every year. One example this year is Josh Doctsun. He’s in a pretty good place overall, but is kind of in-between some guys that have been good and guys who haven’t been good on a few measures. Can a guy be over an inch shorter than AJ Green and still play like Green? (I dont think so, but that’s an educated guess.) What does it mean for a guy with Doctsun’s build to have an NCAA efficiency measure in-between players like Antonio Bryant and Brandon Lloyd on the low side, and Driver/Johnson/Holt on the high side? At the end of the day I don’t know. He absolutely could be great, and I’d take a shot at him if he were cheap. But at his current price I like other players better. I know from my blog (defunct) that some people love that discussion, but lot of others just “want to know who to draft and who the sleepers are.”
4) While draft position hasn’t historically incorporated all of this data, it’s still be really important so modeling pre-draft requires some assumptions that will be wrong at least some of the time. Also, it’s plain to see that teams are incorporating at least the “developmental” piece of the model in the last couple years which cuts out some of the draft-beating value.
So all told, maybe a third of a given class can be modeled using the formal stuff I presented here. Typically what I do is use the method above informally, and discuss the different possibilities in places where there are holes, missing data, uncertainty about draft position or players for whom a low draft position could be for non-talent reasons. Like with Doctsun above.
The point of the paper is to show that the general approach works (i.e. it has been better than using draft position) — i.e. to validate the general idea that grouping WRs on the basis of build, looking at where they are developmentally, and then comparing them ONLY using specific segments of the combine variables is the best way to find similar WR comparisons.
Hope that’s helpful!
Is there really no way to edit a comment?
Measure twice, cut once! 😉
Fascinating read and I would love to see more like it in the future! Did you consider including non-receiving stats in the Skill variable? I’m thinking of return yards especially (Antonio Brown is 10th in the NCAA for punt yards / return per sports-reference), as well as rushing yards.
Thanks again for writing this, and great work!
Great article Rob – I love the approach and organization you used, even if it’s not suited for all dynasty owners (art films still get made and enjoyed, mainstream be damned).
My question would be whether there is a bias in the combine/drills participation. Obviously, injured players might not turn in a full set of numbers, but my intuition is that first-round locks might skip more drills than others. If that’s the case, perhaps the model is better-trained for second- and third-day WRs than first-rounders.
Do you have the distribution of the WRs with missing data, with draft position on the x axis?