2015 NFL Combine Correlations
Last year, I wrote an article entitled NFL Combine Correlations which examined combine scores relative to fantasy production for running backs, wide receivers and tight ends in the 2014 fantasy season. There is much debate about the value of combine metrics, and I’m curious how much they contribute to fantasy production.
This article will examine the 2015 data using similar methods.
Here is a summary of methods used in this data collection:
1. I recorded total fantasy points for the top 36 running backs, wide receivers and tight ends in the 2015 season.
2. For each player, I recorded their NFL Combine performance in the 40 yard dash, bench press, vertical, broad jump, shuttle and 3 cone drill.
3. I grouped 36 players at each position into Tiers 1, 2 and 3. Tier 1 would be the top performers in the combine drill, tier 2 would be middle-of-the-pack and Tier 3 would be the worst performers in each drill.
4. I recorded age for each tier to evaluate whether this could be a confounding variable.
5. I recorded ADP from My Fantasy League.
[am4show have=’g1;’ guest_error=’sub_message’ user_error=’sub_message’ ]
Not all drills have 36 scores available as some athletes missed drills due to injury or other reasons.
Quick summary of the combine drills:
40 yard dash – Measures explosiveness from the starting position and speed.
Bench press – Technically a test of strength, but more importantly evaluates endurance and dedication to get stronger. If an athlete comes up short, is it time to question their work habits?
Vertical jump – Tests explosiveness and power in the lower extremities.
Broad jump – Tests lower body strength and explosiveness.
3 cone drill – Change of direction and agility highlight this drill.
Shuttle run – Shows lateral quickness, explosiveness and change of direction in a small space.
Table 1: 2014 Summary of Drills (Points per game)
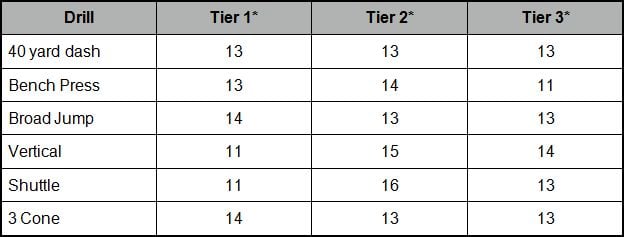
*Average points per game (PPG)
Table 1 shows the average points per game within each tier for the top 36 running backs in the 2014 season.
The most important drills to predict fantasy production for 2014 running backs appeared to be 3 cone, broad jump and bench press. 3 Cone is intuitive, given running backs benefit from short-area quickness and agility. The top two tiers scored more fantasy points in the bench press. It’s hard to hypothesize why this would specifically help running backs, but perhaps it’s an indicator of effort and overall strength, both of which would be beneficial. Broad jump tests lower body strength and explosiveness, both of which benefit a running back.
It is still striking that even for drills like the 3 cone, broad jump and bench press, the difference in average PPG is 1-3 points. While it’s possible 1-3 points could influence the outcome of a game, it seems like a small margin considering the importance portrayed for combine results.
Table 2: 2015 40 yard dash
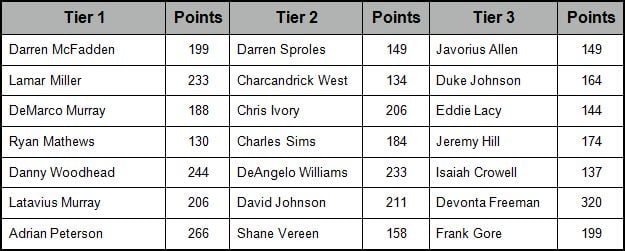
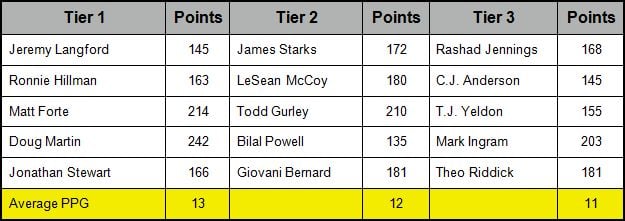
Unlike the 2014 data, there does appear to be a separation between the top two tiers in fantasy production in the 40 yard dash. Within each tier, we can find examples of players who were high-level producers, such as Freeman in tier 3 and Williams in tier 2. But tier 1 has the advantage in fantasy production for 2015.
Table 3: 2015 40 yard dash
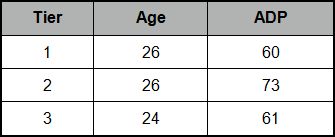
Tier 1 didn’t benefit from younger age, and ADP is spread across a similar distribution. Tier 3 had the youngest average age, and whether their relatively worse 40 yard dash performance indicates a lack of athleticism or explosiveness, it will be interesting to see if these tiers shift in subsequent years.
Table 4: 2015 3 cone

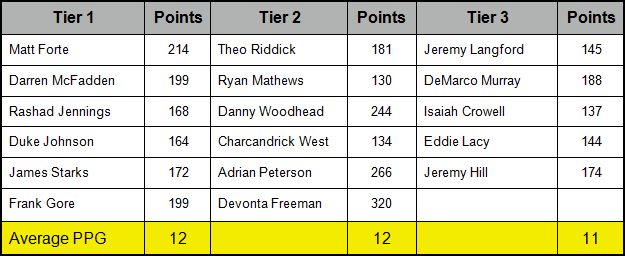
Similar to 2014, the 3 cone drill seems to impact fantasy production, as tiers 1 and 2 separate from tier 3 in average PPG. If there is a priority drill in the combine that predicts fantasy production for running backs, it’s the 3 cone.
Table 5: 2015 3 cone
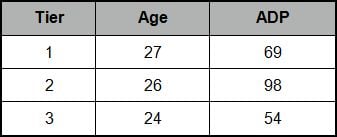
Similar to the 40 yard dash, the top tiers featured older players. ADP shows the worst tier had the highest ADP, and this undoubtedly had a lot to do with the disappointing production of Hill, Lacy, Murray and Anderson. Maybe a bounce back in 2016 will help bring this tier back up, but notably 3 cone in 2014 was still ruled by tier 1.
Table 6: 2015 Bench Press

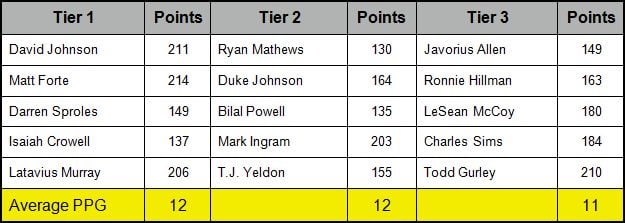
Bench press may not be prioritized by talent evaluators compared to other drills at the combine, but for running backs, this is two years in a row that it was a factor. This may not be specific for running backs, but players who spend more time in the weight room working on their craft have a reason to be more productive. It might be time to pay more attention to the bench press, at least for fantasy production.
Table 7: 2015 Bench Press
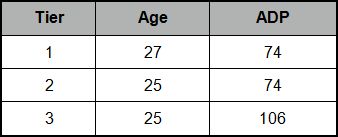
We’re starting to see a trend with age across all tiers. Older running backs seem to have better metrics and fantasy production. In the bench press, ADP valuation is appropriately distributed.
Table 8: 2015 Shuttle

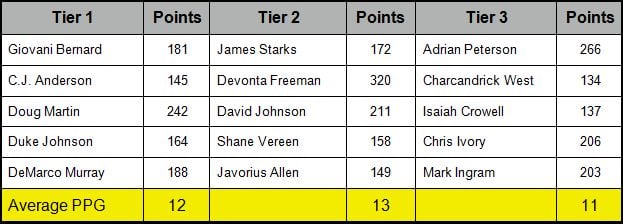
Top two tiers performed better in the shuttle, and this seems reasonable. The shuttle tests lateral agility and change-of-direction, both skills being important for running backs. Shuttle is a drill to monitor for our dynasty rookie running backs.
Table 9: 2015 Shuttle
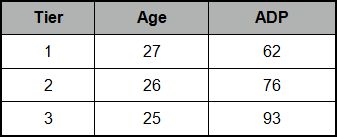
Once again, older running backs rule in the combine and with fantasy production. Is it time to re-evaluate our stance on older running backs in dynasty? Or, is the younger generation of running backs deficient in these metrics? If so, this would be especially concerning as the older generation of running backs fades away. Hopefully we will get an influx of metrics superstars in the next wave of rookie running backs.
Table 10: 2015 Broad jump

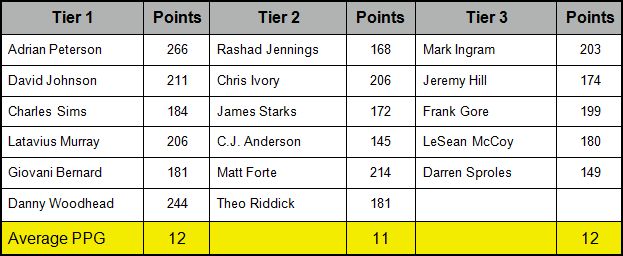
The broad jump is the first combine measure that did not influence 2015 fantasy production. This is in contrast to the 2014 class, but given a separation of one point per game, it’s possible that a few points could sway results in either direction.
Table 11: 2015 Broad jump
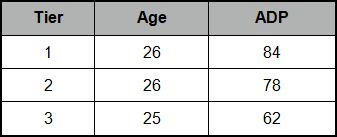
If there is one consolation in this drill, it’s that tier 1 performers came at a value relative to tier 3 players. Still, there was no overall difference in average fantasy points, unless you drafted Peterson, Woodhead, and Ingram on the same team.
Table 12: 2015 Vertical

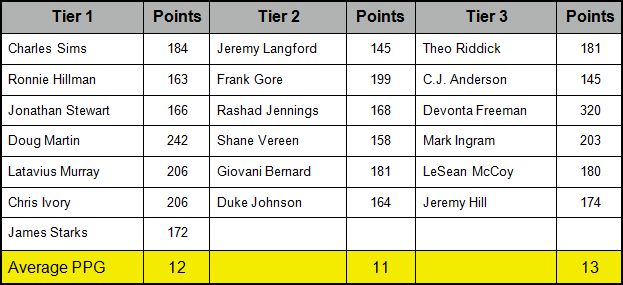
The vertical did not predict fantasy production for running backs in both 2014 and 2015. It seems that the vertical drill isn’t as important for running backs, and it can be downgraded in importance when evaluating rookies for our dynasty teams.
Table 13: 2015 Vertical
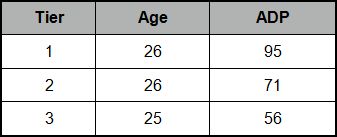
Similar to the broad jump, tier 1 performers were better values on draft day. Older players like Peterson, Woodhead, and Starks pumped up tier 1 performance, but it wasn’t enough to outscore their tier 3 brethren.
Conclusion:
1. The 3 cone drill and bench press are the only drills with the highest average fantasy production at running back in both 2014 and 2015 seasons. When evaluating rookie running backs, focusing on 3 cone and bench press drills may be fruitful for dynasty owners.
2. The 40 yard dash and shuttle held value in predicting fantasy production for the 2015 season.
3. The broad jump drill has questionable merit and the vertical drill doesn’t seem to be an important indicator for fantasy production at the running back position.
4. Regardless of all drills, it’s important to note that separation of average PPG, regardless of any drill, is marginal at best (1-3 points). While combine metrics may help in the evaluation of rookie running backs, we must remember that athletes with lesser scores still have a similar chance to be high-level fantasy producers. Freeman finished in several tier 3 groups, and didn’t finish in a single tier 1 group, yet finished the 2015 season as the top scoring running back in fantasy (320 points).
[/am4show]
- Dynasty Capsule: Carolina Panthers - February 3, 2017
- The Dynasty Doctor: CJ Anderson - January 25, 2017
- The Dynasty Doctor: Week 15 - December 20, 2016


