Roughing the Kicker: A Study in Dynasty Profitability (Part One)

I’m sure you’ve wondered it before: “Am I really a winner in fantasy football?” I think everyone who isn’t keeping detailed records has probably asked themselves that question. I have set out with this study to determine exactly what the breakeven point is in dynasty. Is it easy to breakeven? Is half your league doing it? Is it hard? Is it impossible? These are the questions I seek out quantifiably answer in this series. Actually, the sheer number of times I have to put down my corona to use my TI-83+ and excel is going to be impressive. Hopefully, the 12 ounce wrist-curls are as effective as the gym that I’m currently skipping to stay up all night writing this would have been. This mathematical odyssey sets out to determine how much money we are really making playing fantasy football if we had a large enough sample size to actually compute that in the statistical “long term”.
The study is also setup to determine how many years it takes each win-rate to breakeven if you can maintain that win-rate after a couple years of consecutive losing. This losing could be punting a year or two by drafting early, or could be drafting veterans winning the first year, losing the next 3 years getting back to sustainable win-rate. The same principals apply.
This study is setup to figure out if a popular dynasty strategy “punting” can be a profitable strategy in dynasty football. I have defined “punting” as drafting a start-up team that is drafted to not be competitive for a year or three. The theory to draft a team that will peak in a time period a year or two down the road. I don’t directly correlate the other dynasty start-up strategies in this particular article as I was especially curious about the very popular punt strategy.
I also take a look at the 3-year window and what that means for our dynasty profitability. We will see how much we make in a 3-year period of a sustained profitable rate while our team is “peaking”. After that period is over, the spreadsheet will then tell us how long we can have a “down” team that doesn’t make the playoffs while we get back to our peak status. The idea of a 3-year window is not to have a team good for 3-years and then drive it off a cliff, it’s quite the contrary. I will assume, however, that after 3-years, we botched our new talent/trades and fell off a cliff.
This study makes many statistical assumptions and takes to account two of the more common league payout settings.
[am4show have=’g1;’ guest_error=’sub_message’ user_error=’sub_message’ ]
Basic
- 12-team League
- 4-team playoff
- Two Different types of league payout ($50 buy-in, $600 total prize pool):
A.) Winner-Heavy: 1st Place: $397.50 (66.3%), 2nd Place: $132.50 (22%)
B.) Playoff-Heavy: 1st Place: $300 (50%), 2nd Place: $150 (25%), 3rd Place: $100 (16.7%), 4th Place: $50 (8.3%)
There are many other ways to do payouts in leagues which include total points winners and regular season winner. These don’t apply for this study
For our study, the league is 12-owners and there is always a 4-team playoff in your championship series. I also took a liberty to say you are absolutely not competitive year one in any punt scenario. I then run the numbers if you aren’t competitive up to a 4 year period after punting. I understand that you can be competitive year one of a punt, so no brag comments on that topic, please.
Once your punted team has peaked, I make generalized assumptions based on what percentage your team will make the playoffs (Variable X) in the league. I use the word “peaked” as a way of stating you are no longer in a “punt scenario” and your prospects have come to fruition as productive fantasy assets. Variable X is then used to derive Chances of Winning Semi-Final Game (Variable Y), Chances of Winning Championship (Variable Z), and Chances of Winning 3rd Place Game (Variable Q). I made generalized relationships for Y, Z and Q to X. These are as follows:
Variable Y is Variable X minus 10% of Variable X. For example: if you were 90% to make the playoffs in the calculator, your team will be 81% (90% – 9%) to win the semi-final game or a 4:1 favorite. These variables are determined in an empirical method. Since I want to apply a broad brush to capture a general snapshot of all leagues, I am not going to be breaking down these statistics beyond their relationship to Variable X.
Variable Z is Variable X minus 20% of Variable X. For example: if Variable X is 90%, your team will be 72% (90% – 18%) to win the championship game or a 3:1 favorite. Again, if you were essentially a lock to make the playoffs at the beginning of the season and are the best team in the league, 3:1 favorite in the champion game is very liberal, statistically.
Variable Q is set equal to Variable X in this analysis. Meaning the model calculates if you were 90% to make the playoffs, you will be 90% to win the 3rd place game. Obviously, there’s situations like the #2 seed loses in an upset and you essentially play a championship level game there. That isn’t taken into account in my modeling.
The model is reflective of what I would expect for typical playoffs. Teams that squeak into the playoffs, have a low chance of winning, and teams that crush all year have a high chance of winning. This is not always going to be the case if you are a team that just slides into the playoffs this year. You could have caught fire with Odell Beckham Jr. or the heavy favorite could have gotten hit with massive injuries in week 12. I assume those things do not happen in this model. If you are a favorite in the season, you are a favorite in the playoffs as I would expect in a vacuum.
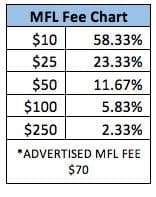
The analysis also takes the payouts, buyin and hosting fee for your website into account. The hosting fee is a pretty significant portion of the general prize pool in lower stake leagues. Here’s a quick chart that assumes you use the myfantasyleague.com private league, which is advertised as $70, as a percentage of total prize pool for a couple of buyin levels as a 12-team league:

Long story short, this “rake” from MFL becomes more difficult to overcome as the buyin of your league gets lower and easier as it gets higher. I don’t really want to focus too much on this aspect of the analysis, but it is something that you should be aware of as a dynasty fantasy owner. The rake is always important to include in your profitability calculations. My model will run with the hosting fee set at $70 which I believe is industry standard.
I have chosen to run my analysis at $50 buy-in because I feel this is a reflection of the industry average buyin. I do understand there are other buyins and I discuss them briefly in the article.
With Variables X, Y, Z, and Q, I am able to calculate the percentage that you finish in each place and then run a weighted profit average across the board. This weighted total profit shown in the bottom right hand corner of the statistical data table is a representation of how much money you can expect to net each year if the assumed X, Y, Z and Q are correct.
I apply this weighted total profit to an assumed “punt philosophy”. I call these Model A, B, C, and D. Model A assumes it takes you one year to get to peak form, I assume this a “mild punt”. Owners going for a couple of strong assets but still focusing very young, however still grabbing veterans as value. Model B assumes it takes two years to get to peak. Model C assumes it takes three years to get to peak. In my opinion, Model B and C are the most accurate for what I’ve seen in “start-up punting”. This means you focus on getting young, undeveloped assets and future draft picks while basically ignoring all aged veterans. Model D assumes a semi-botched punt and 4 years to get to peak. This assumes trying to punt and missing on several draft picks and assets. Obviously, if the majority of your developmental talent and draft picks didn’t pan out, there are worse scenarios and potential rebuilds after year 3 or 4. And you guessed it, I won’t cover those in this article.
Lastly, the breakeven timeline determines how long it will take a team who has punted in each model to break even. For example, if Variable X is 90% and you punt the first 3 years of your league, it will take you over 5 years to breakeven on the league. After the 5th year, you will start making profits.
With full disclosure, I have gone into this study with the hypothesis that punting is not a profitable strategy in a majority of dynasty settings prior to running this study and we will find out in the next 3 parts if I’m proven correct. On top of that, we will analyze the overall profitability of playing dynasty football and what being profitable in your league really means statistically.
[/am4show]
- Rookie Profile: Patrick Mahomes, QB Texas Tech - April 26, 2017
- Rookie Profile: Isaiah Ford, WR Virginia Tech - April 21, 2017
- The Dynasty Value Impact of Suspension: A Josh Gordon Story - January 28, 2017


