Rookie Draft Study: Part Four, Hit Percentages

This is part four in a series covering dynasty rookie drafts, pick value and historical ADP. If you missed parts one through three, we’d strongly recommend you check them out before continuing on with this article. They help set the stage for what we will be discussing today.
At the end of part three I promised a look at a composite of all four positions’ hit percentages. Never one to break a vow, I’m going to give you just that, but first I have to explain how I got there.
In order to jam all the players into one table, I needed to find a way to put the different positions on relatively equal footing. As you could imagine, trying to decide how the QB5 compares to the WR26 to the RB16 to the TE4 wasn’t easy. So I didn’t. I walked away for three days. When I returned, it still wasn’t easy. So I ate homemade strawberry ice cream and watched Gotham. Finally, at about 2am the morning I had to submit the article I figured it out.
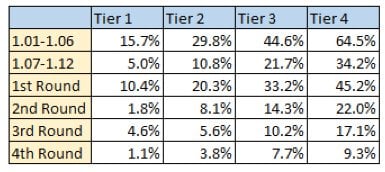
We will be using four different tiers in which to categorize players.
Tier 1 – Top 3 QB, Top 5 RB, Top 12 WR, Top 3 TE
Tier 2 – Top 6 QB, Top 12 RB, Top 24 WR, Top 6 TE
Tier 3 – Top 12 QB, Top 24 RB, Top 36 WR, Top 12 TE
Tier 4 – Top 18 QB, Top 36 RB, Top 48 WR, Top 18 TE
[am4show have=’g1;’ guest_error=’sub_message’ user_error=’sub_message’ ]
I used this system in large part because it meshed well with the way my already existing hit rate data is sorted (check out part three to see what I mean). It also makes a decent amount of sense when comparing ADP of, say, the WR12 to the RB5. It certainly isn’t 100% perfect, as WR is probably undervalued a bit, but I feel pretty good about it overall.

As we already knew, rookie picks carry risk. The composite once again backs that up. Questions still remain. Namely, with the obvious risk involved, are rookies worth the investment? And if they are, what picks should you target?
Rather fortuitously, our good friend Zach Bahner issued an updated rookie pick value chart just this week. I had considered making my own in lieu of using Zach’s old chart, but now I don’t need to. It would be helpful if you took a moment and familiarized yourself with the way his system works as I’ll be referencing it throughout. It would also be helpful to you in general because it is a fantastic bit of kit.
Let’s set up a hypothetical situation in which we are drafting at the 1.02 but have fielded offers to move back and accumulate additional picks. According to Zach’s chart, our pick has a point value of 2199. A quick bit of math shows the appropriate value for a trade back could include the 1.07, 1.09, and the 1.11 (2011 total points).
If we now turn our attention to part three in this series, we can look at hit rates for wide receivers taken in the top three of rookie drafts. Since drafting at least a WR2 is a reasonable goal, we’ll use the 62% figure shown in the wide receiver hit rate chart.
Now we need to determine what we’d end up with if we were picking three times in the mid to late first. Because it is safe to assume we won’t get a chance at three worthy WR’s there, let’s mix in a single running back at the 1.09. This leaves us with a 25% chance at WR2 production from the 1.07, 17% from the 1.11 and a 17% shot of RB2 goodness from the remaining pick.
After some furious punching of the keys on my calculator, I found out there is a 38% probability one of those three late firsts ends up posting a RB2/WR2 season. The odds any two of them both reach that mark is around 13%. Finally, there is a less than 1% chance all three cross that threshold in the same season.
On the surface it would seem like sticking at the top of the first is the right play. But math isn’t everything. Regardless of what the numbers say, they can’t account for things like the quality of a draft class or players unexpectedly sliding down boards. The math also has no concept of your roster needs, which is a huge factor in when you should and shouldn’t be trading up or down. So while we can get a good idea if the value proposition is correct by using a combination of Zach’s chart and my hit percentages, it is far from an ultimate solution.
In a vacuum, I think the hypothetical trade is just fine. Even though the odds more than one player will hit is only 13%, which is 13% more than the odds two players hit if you only have one player. It is hard to quantify this, but the value that brings should not be underestimated.
If you want to play around with different pick combos to look at your own trade scenarios, I’ve created a Excel spreadsheet that will do all the probability math for you. All you need to do is plug in the hit percentages from part three and the spreadsheet will get you the numbers you desire. A more in-depth explanation of how to use the tool can be found on the second sheet of the document. Click here to download the file and check it all out.
Now let’s talk about late round picks a bit more. When looking at hit rate it is easy to dismiss them, but I think that’s a mistake. Going back to the well of the rookie pick value chart we can see how incredibly cheap the last 20 or so picks are.
Take, for example, the fourth round. Despite a composite hit rate of 9.3% for tier four players, we’ve seen numerous useful pieces come out of the final 12 picks the last six years. From T.Y. Hilton to Jordan Reed to less heralded but still useful (at one time) Brian Hartline and Cecil Shorts. The odds may not be great, but when the price is so dang low I’m a huge fan of stocking up on late round longshots. You certainly don’t have to hit very often to justify the outlay.
Looking forward to part five, I will be wrapping things up by bringing all we’ve discussed together and applying it to something I said in the introduction: “roster makeup matters more than just about anything.“
In the meantime, I have a bit of ice cream left, and it’s calling my name.
[/am4show]
- How to Win Without Watching Football - July 22, 2021
- 2018 Summer Sleeper: Chicago Bears - July 9, 2018
- NFL Draft Aftermath: Winners and Losers from the AFC North - June 18, 2018


