By the Numbers: The DEF Metric
The analytics revolution in sports has not only led to many new statistics used by front offices, but it is also spawned many creative minds to do the same for fantasy owners. Everyone is looking for the next projection model or statistic to help them gain an edge on their competition. This series will try to help discern fact from fiction when it comes to the usefulness of statistics on fantasy performance.
After reading through many of the DLF Survey comments, a consistent theme was the interest in more IDP (individual defensive player) analysis. When digging through team and defensive player statistics, I decided to look into IDP scoring efficiency for players and teams. This article will create a metric to find out who is standing out with their efficiency relative to overall team performance.
How do we measure this efficiency?
Before we dive into efficiency, let’s start back a little and look at the simple relationship between defensive plays and IDP scoring. Looking below, we see the expected positive correlation that has a moderate R-squared at just a shade below 0.50.
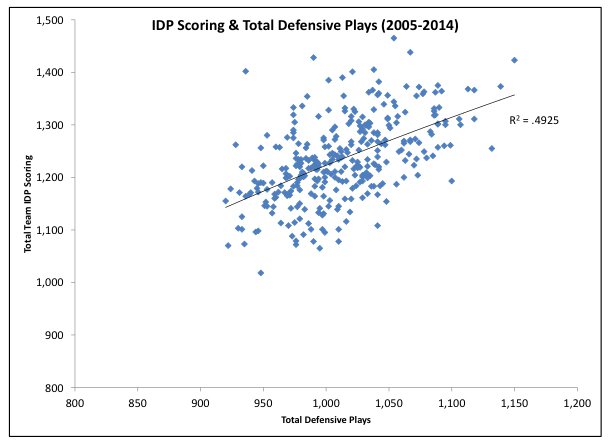
Knowing the number of defensive plays can vary in range between 900 and 1,200 per season, it helps to create a way to account for this when analyzing individual defensive players. Additionally, when digging into the causes for change in defensive plays, there were no strong correlations to the offensive side of the ball (number of plays, number of passes or runs, or offensive turnovers). Therefore, we move forward with a metric that will eliminate the need to explain that change and normalize it in a way where players who are more efficient at IDP scoring than their team will be highlighted.
Enter, the DEF Metric.
[am4show have=’g1;’ guest_error=’sub_message’ user_error=’sub_message’ ]
What is DEF and how do I calculate it?
Quite simply, the Defensive Efficiency Factor (DEF), looks at the total team scoring and opportunities and compares it against an individual’s scoring and their opportunities.
(Player IDP Points/Player Snaps)/(Team IDP Points/(Defensive Snaps*11)) = Defensive Efficiency Factor
Or to simplify: Player IDP points per snap/Team IDP points per defensive player snap = Defensive Efficiency Factor
Your first question may be, “Why multiply the defensive snaps by 11?” Well, it is to account for all 11 players on the field in the team side of the equation as that represents the total snaps available to defensive players of a given team.
What this formula will help do is account for the defensive pace mentioned earlier and help find players who are overperforming in IDP scoring relative to the team. Anyone who scores over a one will essentially overindex to their team.
The one caveat I will mention is defensive talent is not accounted for here. If a player is significantly talented and plays with other great players, it is harder for him to be a larger share of his team’s IDP scoring compared to one who is surrounded by inferior talents. So while this will help understand who is efficiently scoring fantasy points; you will need to consider free agency, scheme changes, and other personnel decisions independent from this metric.
Math lesson is over, let’s put this into practice!
Who stands out in 2014 and who is showing up as a player of interest in 2015?
Before we dive in, here are the IDP scoring rules I used:
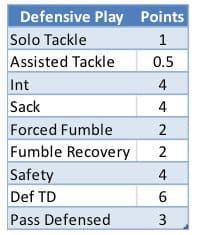
Let’s also take a look at the positional DEF scores and the standard deviation values, which will help us understand who is significantly above or below the positional score. I would use the positional score as a way to understand what efficiency level is a minimum acceptable level for your IDP options.
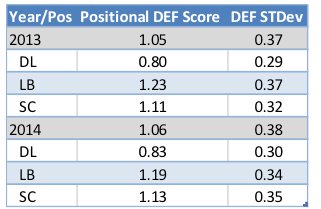
Now, we will focus on a few players who stood out in 2014 and my thoughts on their placement heading into 2015.
Bruce Carter, LB TB
2013 DEF Score – 1.11
2014 DEF Score – 2.23
Carter is very interesting as a former second rounder who has seen an equal number of brilliant plays and boneheaded plays. Twice benched in the last two years, Carter is an efficient tackler and even added in five interceptions and a touchdown in 2014. Moving to Tampa Bay is not a large concern to me as the opportunities and IDP scoring are quite similar. He is currently ranked 36th by DLF among linebackers so it is a low risk investment for a guy who has overindexed both years with a top five linebacker score in 2014.
C.J. Mosley, LB BAL & Ryan Shazier, LB PIT
2014 DEF Score – Mosley: 1.42 Shazier: 1.36
I lumped the two 2014 rookie linebackers together in an effort to show how efficient they both were. With only 258 snaps, it is hard to assess Shazier but this metric indicates a guy who scored IDP points at a high rate despite having no sacks, interceptions, or fumbles. With Mosley, he had the snaps (1,065) but didn’t just benefit from volume as he was scoring at an efficient level that validates his ranking (five) among linebackers. Both these guys look like the real deal early with Shazier having some upside in his ranking (eleven) to elevate into the top five.
Fletcher Cox, DE PHI
2013 DEF Score – 0.61
2014 DEF Score – 0.82
I can’t be nice to everyone so sorry in advance Fletcher. Here is a player who benefits from snap count (903 average the last two years) but isn’t efficiently scoring with the playing time. The improvement is nice in 2014, but it is buoyed by an overall worse IDP scoring defense in Philadelphia (from 1423 to 1368). He is currently ranked 15th among defensive linemen, which is aggressive for me considering Vernon Olivier (19th) had a similar DEF score (0.78) and Jerry Hughes (23rd) is more efficient (1.10 DEF).
Damontre Moore, DE NYG
2014 DEF Score – 1.58
Keep in mind, Moore only played 318 snaps in 2014 but is the third highest DEF score for players with at least 300 snaps (unsurprisingly, J.J. Watt is first). At one point, Moore was expected to be a top ten pick coming out of Texas but slipped to the third round after an uninspired combine. Going into his third season, the team is expected to give him more snaps, which could push him towards double digit in sacks (5.5 last year) and exceed the 32 total tackles he had last year. Unranked and under the radar, this is the type of efficient player you roll the dice on and see what happens.
Matt Elam, S BAL & Calvin Pryor, S NYJ
2013 DEF Score – Elam: 0.72
2014 DEF Score – Elam: 0.84 Pryor: 0.83
Elam and Pryor are a pair of young safeties who have struggled with consistency. Elam is two years into the league and has shown little progression. While his DEF score has improved, he is still 0.8 standard deviations below the mean in 2014, making him an easily replaceable piece. Meanwhile, Pryor struggled his rookie year and hopefully a position change improves that in year two. For comparison purposes, fellow rookie Ha Ha Clinton-Dix managed a 1.15 DEF score, looking like a future fixture on IDP rosters. DLF has Clinton-Dix at 13th, Pryor at 15th, and Elam at 20th.
Obviously, there are many questions and defensive players we can dive into so if anyone has a particular interest, I’m active on the comment section.
What to do next?
Remember, this is just one tool that you should keep in your utility belt of knowledge and it is not meant to be the one way to analyze an IDP option. Below are the team numbers for those looking to do their own math (which I always encourage):
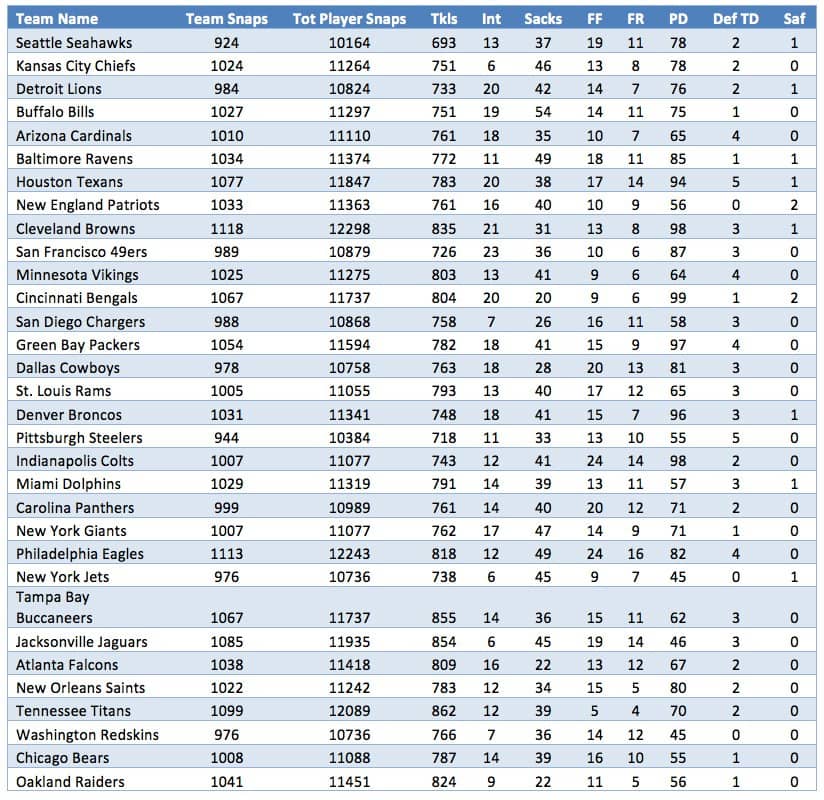
Thanks for reading and share your thoughts below!
[/am4show]
- Bowl Game Previews: CFB Playoff Semifinals - December 28, 2018
- The Narrative Fallacy and How it Compels Us - May 13, 2017
- 2017 NFL Draft – College Wide Receiver AIR - April 27, 2017


