NFL Combine Correlations

The NFL Combine is over, and it’s a great time of year for metrics believers.
In fantasy football, there are proponents of watching tape to judge the potential of an athlete, while others emphasize statistics to predict future performance. Prospects are labeled supreme athletes with a fast 40 yard dash, strong vertical, and an explosive broad jump. Jerick McKinnon became a household name in fantasy football based on his performance at the NFL Combine. We hear on Twitter, podcasts or other social media how a prospect must be destined for greatness based on a variety of metrics, like SPARQ or other complicated equations. Are metrics champions right? Or, is it possible NFL Combine results are overrated?
In this series, we will put NFL Combine performance to the test, and see if it truly makes a difference for fantasy football.
Here are the methods:
- I recorded total fantasy points for the top 36 running backs, wide receivers and tight ends in the 2014 season.
- For each player (n=108), I recorded their NFL Combine performance in the 40 yard dash, bench press, vertical, broad jump, shuttle and 3 cone drill. I also recorded where they finished in each drill for their specific NFL Combine year.
- Each drill represents an opportunity to finish first to last. In this way, we can assign a numerical score that reflects their performance relative to other competitors. The best possible score would be “1” in a drill. Likewise, when adding together all six drills, the best possible score would be a “6”.
- I recorded the total combine score for each player (40 yard dash+bench+vertical+broad jump+shuttle+3 cone drill = combine score).
- I grouped 36 players at each position into tiers 1, 2 and 3. Tier 1 would be the top performers in the combine drill, tier 2 would be middle-of-the-pack and Tier 3 would be the bottom 12 performers in each drill. I recorded total fantasy points for each tier in 2014 and points per game within each tier.
- I recorded age for each tier to evaluate whether this could be a confounding variable.
- I recorded ADP from MFL and dlfstg02.dynastyleaguefootball.com, representing both re-draft and dynasty perspectives for each tier.
Given the amount of data present, we will break this up into three articles, starting with running backs.
Please note not all drills have 36 scores available as some athletes missed drills due to injury or other reasons. Still, there is enough data to evaluate whether combine results influenced fantasy performance for the 2014 season.
Table 1: Average RB Combine Rank

Table 1 separates performers within each combine drill into top, middle and lower tiers. Players in the top tier scored the highest in each drill, whereas players in the lower tier scored the worst. Numerical values in the table represent the average ranking of running backs in each tier for the 2014 fantasy season. In this way, we can compare combine performance with fantasy production.
The top tier of combine performers ended the 2014 season ranked behind the worst combine performers (tier 3) in nearly every category, with just one tie (3 cone drill).
This table suggests that superior performance in combine drills did NOT correlate to better fantasy production at the running back position in 2014.
Table 2

- Combine score is the sum rankings of all six drills per player, then averaged together in each tier.
- Combine scores are inversely proportional to performance in drills (lower numbers are best).
In Table 2, for each player in a tier, I added together all combine drill rankings, then took the average of all players within each tier. For example, Arian Foster finished 22nd in the 40 yard dash, 10th in the bench press, 23rd in the vertical jump, 13th in the broad jump, 1st in the shuttle and 8th in the 3 cone drill, and the summation of his scores is 77, while his average combine score is 13. The top tier takes the average of all combine scores for players 1 to 12 at running back, and the same approach is used for middle and lower tiers.
[am4show have=’g1;’ guest_error=’sub_message’ user_error=’sub_message’ ]
Combine scores for all tiers is very similar, with a slight edge to the lower tier of running backs (players who finished 25 to 36 in 2014).
ADP data correlates well with each tier, but the combine score does not. Perhaps fantasy players are not so obsessive about combine scores, as it does not seem to be impacting their decision to spend more valuable picks on players who finish in the top 12, despite a slightly worse combine score.
I took the average age within each tier, to evaluate whether age impacted combine score results. The top tier actually has the youngest group of players, so age does not appear to be influencing these results.
This table does NOT support the notion that the most productive fantasy running backs will have superior combine scores.
Table 3: 40 Yard Dash – RB

I thought it would be interesting to evaluate fantasy points produced within each tier for specific combine drills. It is important to track points per game (PPG), as total games played within each tier may not be the same, either due to injuries, suspensions or other reasons that players miss games.
Total fantasy points produced in 2014 by tier 1 players in the 40 yard dash was 2484. Note tiers 2 and 3 are missing one player each, and this is necessary as Fred Jackson and Benny Cunningham do not have 40 yard dash times available.
While tier 1 has the edge in total points, PPG is equivalent. Players in tier 1 played 184 games, and hence PPG is 13.5. Tier 3 has fewer total points, but players in this tier only played 157 games, and their PPG is 13.7.
PPG is close across all tiers, with tier 3 slightly ahead. There does NOT appear to be a clear advantage in fantasy production across all running back tiers for the 40 yard dash.
Table 4: Bench Press – RB

Tier 2 has the edge in total points and PPG, and tier 1 has a two point advantage in PPG over tier 3. It’s encouraging to see tier 1 perform better than tier 3 in PPG, but top players still finished behind tier 2 running backs in PPG. Seven players in tiers 1 and 2 had more fantasy points than the best performer in tier 3. Bench press may have some correlation to fantasy production, but it’s not strong enough to separate top players from those in the middle.
Table 5: Broad Jump – RB

Broad jump is the first win for tier 1, albeit by a slim margin. Tier 1 finished 0.8 points above tier 3 in PPG, and 1.2 points above tier 2. Broad jump is an important drill for running backs, as it evaluates explosiveness and lower extremity strength. It makes sense that running backs should have superior scores in the broad jump. Yet, the difference in PPG is slim, suggesting the impact in fantasy is marginal at best.
Table 6: Vertical Jump – RB

Vertical jump champions are not faring well in fantasy production. Tier 1 is in last place by a wide margin compared to tiers 2 and 3. For running backs, broad jump is more important, as it tests horizontal explosiveness, and that is more relevant to the position. A poor vertical jump would be more of a concern for wide receivers. Nevertheless, vertical jump does not appear to be a strong predictor of superior fantasy production for running backs.
Table 7: Shuttle – RB
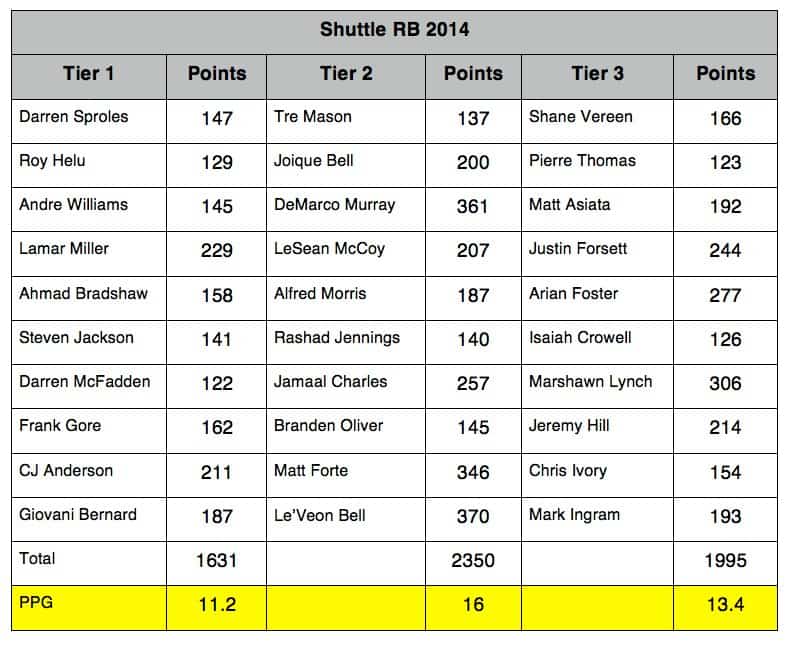
It is surprising that tier 1 running backs performed poorly in the shuttle relative to tiers 2 and 3. Shuttle measures short area explosiveness, agility and change of direction skills and those are all important for running backs. Tier 1 running backs fell short in this category. Top performers in the 2014 fantasy season such as Charles, Forte, Bell, Forsett, Foster, Lynch and Hill all finished outside the top tier in the shuttle. Tier 2 had a near 5 point advantage in PPG over tier 1.
Table 8: 3 Cone Drill
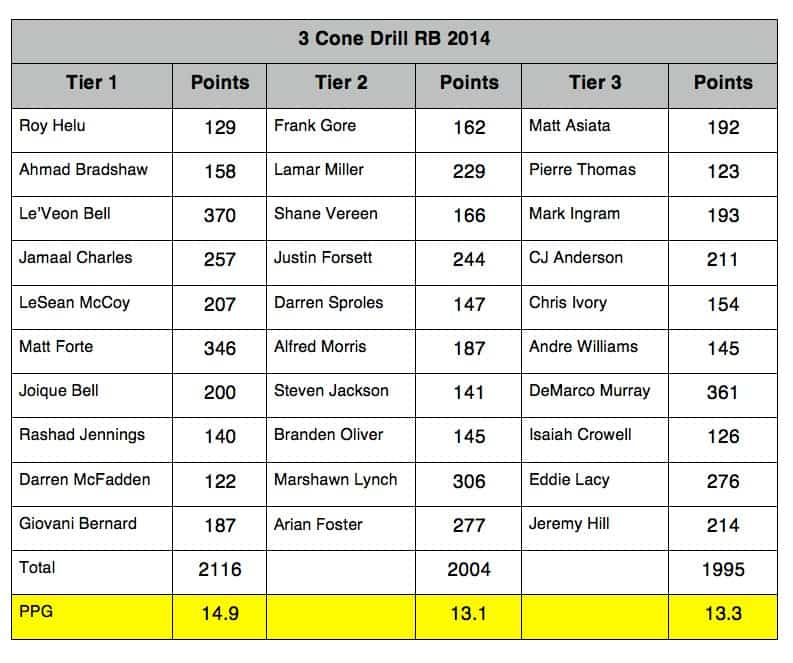
The 3 cone drill gave tier 1 running backs another slim victory. 3 cone drill may be the most important combine score for running backs, as it measures change of direction and agility. Tier 1 has the best PPG at 14.9, just ahead of tiers 2 and 3. Still, tier 1 had a less than 2 PPG advantage over tiers 2 and 3, indicating the margin of influence in fantasy production is slim.
Table 9: Biggest Surprises – RB
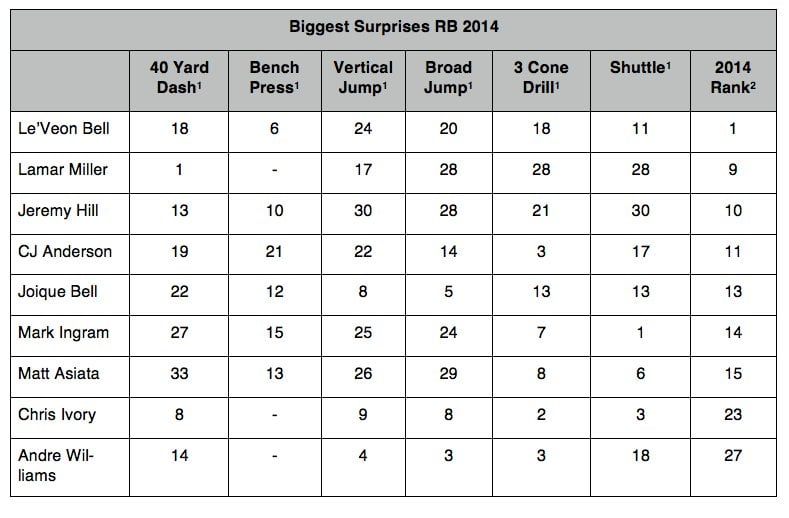
- NFL Combine rank
- 2014 RB rank with PPR scoring
Table 9 shows the biggest surprises in 2014 at running back.
Bell finished as the top running back in fantasy football in 2014, yet his combine score is an unimpressive 97, with an average of 16. To give that score perspective, Darren McFadden had an average combine score of 13, Pierre Thomas 11, Andre Williams 8, Chris Ivory 6 and Branden Oliver 14. Bell could only finish top 10 in bench press, the least important combine drill for running backs.
Trent Richardson and Matt Asiata both had higher average combine scores (18, 19) than Jeremy Hill (22).
Chris Ivory is an NFL Combine stud, and his average combine score of 6 was better than every running back in the top 36 other than Marshawn Lynch, who also scored a 6.
Conclusions
- There is no correlation to fantasy production at running back when all combine scores are considered as a group.
- Bench press, broad jump, and 3 cone drill are the best predictors of fantasy production at the running back position, but the difference in points per game is marginal.
- There is no evidence to suggest 40 yard dash influences fantasy production for running backs.
- Vertical Jump and Shuttle had a negative correlation to fantasy production, and may call into question their importance in the evaluation of running backs, at least in terms of fantasy production.
Hype on players like Christine Michael and McKinnon is deafening, yet results of this review suggest caution should be applied when acquiring talent in dynasty based purely on NFL Combine performance.
Wide receivers will be up next.
[/am4show]
- Dynasty Capsule: Carolina Panthers - February 3, 2017
- The Dynasty Doctor: CJ Anderson - January 25, 2017
- The Dynasty Doctor: Week 15 - December 20, 2016


